QS V4 ELITE: PLTR Speculative BouncePLTR Weekly Trade
Direction: Speculative bounce
Buy: PLTR $170 Call
Expiry: Jan 30, 2026 (Friday)
Entry: $2.75 – $2.95
🎯 Targets
Target 1: $3.50
Target 2: $4.50
🔴 Risk Stop loss: $2.10
Hard exit: PLTR below $165
Trade Rules: Small size only
Take profit fast if +25%
If price stalls near $170–172, be ready to exit
Harmonic Patterns

NZDUSD - Time To BuyNZDUSD was in a recent downtrend for the last few weeks and was struggling to stay bullish, but recently it has just broken a strong resistance trend line which it tested several times and failed to break through. NZDUSD is very likely to hit the next major resistance zone which is market as the "TAKE PROFIT" LEVEL. There are many clear signs of new bullish movements. BUY NZDUSD now.

EUR/USD consolidates within a fourth wave before the Fed meetingThe weekly chart shows the major currency pair in a sustained period of consolidation since June 23. This would suggest we see a spike to the upside to take out weak stop losses.
The four-hour chart highlights a gap open from Sunday at 1.1828. We have a 261.8% extension level at 1.2081
Conclusion: I would expect a continued period of consolidation up until tomorrow's Fed meeting. Gaps tend to be closed. Elliott Wave analysis suggests we are currently consolidating within a fourth wave. The bias remains bullish, and I look for dips to find buyers

BSE LTD | Swing Trade Update | BTR Sell Signal (23 Jan 2026)📅 Date: 23 Jan 2026
📉 Signal: BTR Generated SELL
📊 Outcome Today: No Movement → No Profit, No Loss (Neutral Day)
BSE LTD triggered a BTR Sell Signal on 23 Jan 2026, however price remained range-bound throughout the session. Lack of follow-through confirms indecision, not signal failure.
This is a classic example of patience over prediction — staying in the trade only while structure confirms.
🎯 Swing Targets (Downside):
Target-1: 2662
Target-2: 2642
Technical Observation:
Price consolidating near signal zone
Momentum cooling but breakdown confirmation still pending
Expansion expected once range resolves
📌 Trade Management:
Maintain position only below sell-signal zone
No aggressive action until directional expansion
Risk remains predefined — discipline intact
⚠️ Disclaimer: Educational purpose only. Markets involve risk. Follow your own risk management.

Gold Selling Plan!Short-term gold selling plan
Sell: 5085 - 5095
TP: 4095 - 5005
SL: 5120
Be sure to set the stop-loss level. Also, be mindful of your financial security.

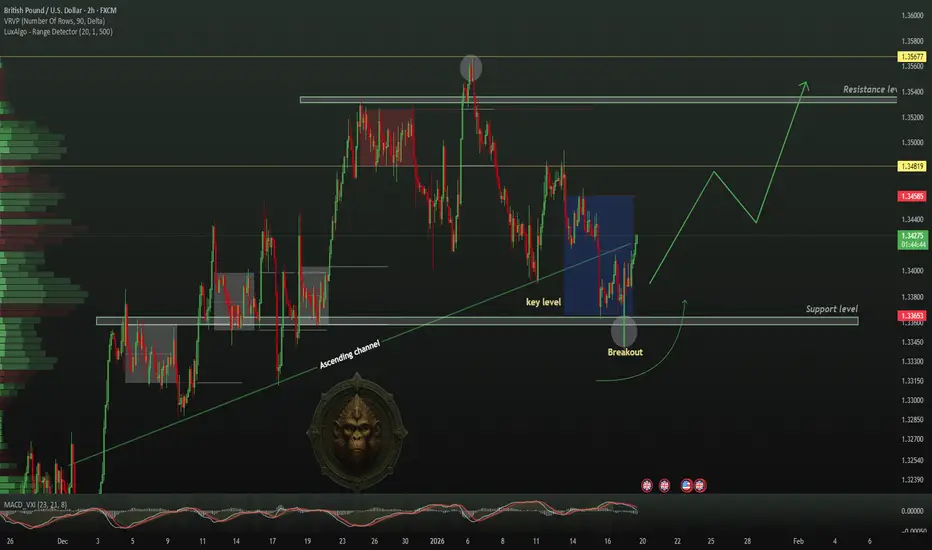
TheGrove | GBPUSD BUY | Idea Trading AnalysisGBPUSD is moving in an UP and broke Support line
The chart broke through the dynamic Support line and we expect a decline in the channel after testing the current level which suggests that the price will continue to rise
We expect a decline in the channel after testing the current level
Hello Traders, here is the full analysis.
I think we can soon see more fall from this range! GOOD LUCK! Great BUY opportunity GBPUSD
I still did my best and this is the most likely count for me at the moment.
-------------------
Traders, if you liked this idea or if you have your own opinion about it, write in the comments. I will be glad ⚜️
GOLD XAUUSD GOLD XAUUSD CURRENT PRICE 5085$
GOLD REJECTING 5100-5096 ZONE
KEY DEMAND 5000-4997 ZONE
FOLLOW THE STRUCTURE,STRUCTURE NEVER LIES.
KEY DEMAND FLOOR 4965-4960
KEY DEMAND FLOOR 4847-4840.
OR FOLLOW THE STRUCTURE.
STRUCTURE NEVER LIES
Geopolitical Tensions
US President Donald Trump's insistence on acquiring Greenland, including threats of force and tariffs on opposing European nations, has sparked US-Europe friction. French President Macron's rebukes and potential suspension of US-EU trade deals have weakened the dollar, boosting gold's appeal to foreign buyers.
Economic Factors
A softer US dollar makes gold cheaper globally, while expectations of steady Federal Reserve rates—despite labor improvements—favor non-yielding assets like gold. Central banks in China and India continue aggressive gold buying, adding structural support.
Future Outlook
Prices may climb towards 5200 zone if tensions persist and the dollar stays weak, though stronger US data could cap gains.watchdollar rise on demand .
the dollar index is holding daily support at 97.935$ and during newyork today buy candle kept yesterday demand floor and we are seeing GOLD price into systematic correction from 4890-4880 zone .if they insist on daily buy floor then we will be watching 4900 which is a pathway to 5000-524k and more advanced buying based on the trendangle strategy.
WHAT IS GOLD ???
Gold (Au) is a chemical element and dense, malleable transition metal prized for its lustrous yellow hue, exceptional conductivity, and resistance to corrosion.
History as Store of Value
Gold has served as a store of value for over 6,000 years, from ancient Egyptian tombs (c. 4000 BCE) symbolizing immortality to Lydian coins (600 BCE) enabling standardized trade across empires like Rome (aureus) and Byzantium (solidus, stable 700+ years). The 19th-century gold standard anchored global currencies until 20th-century abandonments, yet gold retains purchasing power
Tier 1 Status Clarification
Gold classifies as a Tier 1 asset under Basel III banking rules , with 0% risk weighting for physical bullion, equivalent to cash for capital reserves, enhancing bank balance sheets amid fiat volatility. This elevates it from prior Tier 3 status, affirming its role as "money again.
HOW DOES THE DOLLAR INDEX AFFECT THE PRICE ACTION AND DIRECTIONAL BIAS ??
The US Dollar Index (DXY) exhibits a strong inverse relationship with global gold prices, where a stronger dollar typically depresses gold values and a weaker dollar boosts them.
Core Mechanism
Gold trades in US dollars worldwide, so dollar strength raises gold's cost for non-US buyers, curbing demand and lowering prices. A weaker dollar reduces this barrier, making gold cheaper and spurring purchases from international investors.
Correlation Strength
Historical data shows a negative correlation coefficient of -0.40 to -0.80, meaning 40-80% of gold's movements often align inversely with DXY changes. Interest rate differentials amplify this: Fed hikes strengthen the dollar and hurt non-yielding gold, while cuts weaken it and favor gold.
Influencing Factors
Geopolitical risks or inflation can override the link temporarily, but dollar dynamics remain the primary driver in most cycles. For instance, recent dollar weakness from de-dollarization trends has fueled gold rallies.
the brics nation are busing buying GOLD.this is the year of GOLD as the new money backed by physical GOLD ,this is why all BRICS CENTRAL BANKS are stocking the yellow bullion.
#GOLD #XAUUSD

Bearish reversal?EUR/GBP is rising towards the pivot, which acts as a pullback resistance that aligns with the 38.2% Fibonacci retracement and could reverse to the 1st support.
Pivot: 0.8695
1st Support: 0.8652
1st Resistance: 0.8745
The opinions given above constitute general market commentary and do not constitute the opinion or advice of IC Markets or any form of personal or investment advice.
Any opinions, news, research, analyses, prices, other information, or links to third-party sites contained on this website are provided on an "as-is" basis, are intended to be informative only, and are not advice, a recommendation, research, a record of our trading prices, an offer of, or solicitation for, a transaction in any financial instrument and thus should not be treated as such. The information provided does not involve any specific investment objectives, financial situation, or needs of any specific person who may receive it. Please be aware that past performance is not a reliable indicator of future performance and/or results. Past performance or forward-looking scenarios based upon the reasonable beliefs of the third-party provider are not a guarantee of future performance. Actual results may differ materially from those anticipated in forward-looking or past performance statements. IC Markets makes no representation or warranty and assumes no liability as to the accuracy or completeness of the information provided, nor any loss arising from any investment based on a recommendation, forecast, or any information supplied by any third party

Bitcoin (BTC) CME Futures Gap Still OpenBitcoin price action on the CME futures chart is currently rotating higher toward a key CME gap fill, an area that also aligns with the 0.618 Fibonacci retracement, creating an important technical confluence for the remainder of the week. This region is acting as a magnet for price and represents a critical decision zone for short-term direction.
At present, there is still room for upside continuation into this gap-fill area. However, this does not automatically invalidate the broader bearish structure. Instead, this move can be viewed as a corrective rally within a larger downtrend, particularly if momentum begins to fade as price reaches the Fibonacci confluence.
The key factor to monitor will be lower-time-frame behavior once price trades fully into the gap. If Bitcoin begins to show signs of distribution or rejection—such as weak follow-through, long upper wicks, or bearish engulfing candles—it would increase the probability of a continuation of the broader bearish move for the week.
From a technical and market-structure perspective, the CME gap fill combined with the 0.618 Fibonacci makes this region a high-probability reaction zone. Until rejection is confirmed, upside remains possible in the immediate short term. However, failure to sustain acceptance above this area would favor a downside continuation, keeping the bearish bias intact.

Dockyard at a critical turning point,watch the next move closelyBased on the current technical analysis, Dockyard’s share price shows a strong potential upside toward the LKR 180–190 range. The RSI indicates improving momentum from lower levels, while the MACD suggests a possible bullish crossover, supporting the likelihood of a near-term price recovery.

Gold trading plan!Yesterday gold went straight up without retracement again and reached 5110, after which reversed quickly and erased all the gains. It printed a daily pin bar. This is a sign of reversal in short term and a top for this month in my opinion. We should see strong correction in the following few days.
Therefore, I will look to sell from 5050 today, targeting 4914.

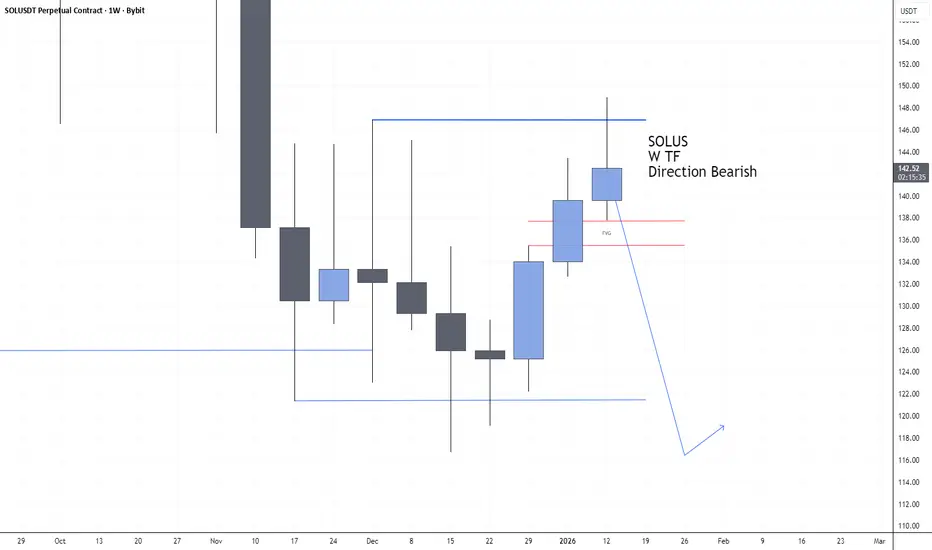
SOLUSD bearish Sign?looking at weekly chart looks like SOL most likely bearish setup.
Of course I was Bullish last week but looking at the candle closing inside wick possible short.
EURUSD : Final hurdlePrice broke the 15-year trendline @ DXY a moment ago.
This would be the final hurdle @ 1.20
Still a SELL until this last hurdle.
Good luck.

XAGUSD | Bearish RetracementSilver has hit its all time high and formed a strong resistance.It may make a short retracement which may go deep further considering the international politics.

Adani Green Energy LimitedShare price declines in Adani Group names following regulatory/legal developments involving the U.S. SEC that spooked investors, leading to sharp sell-offs
From early January levels near ₹1,030+ to ₹1,040+ to ~₹770–₹780 by 23 Jan 2026, the stock declined roughly 20-25% over the month.
The stock showed a relatively moderate downtrend, with daily small declines reflecting weakening momentum.
21–23 January: There was heightened volatility and large drop, with a short-term bounce attempt on 22 Jan, then a steep decline on 23 Jan.
By 23 Jan, price was trading near its 52-week low region (~₹758) versus the high near ₹1,177 in the past year, indicating significant relative weakness.
Have marked some important levels for Adani Green
647 - 531 seems good zone to accumulate on SIP mode...
Like and Share

NZDUSD 1📌 NZDUSD – Buy Limit (Professional Analysis)
Entry: 0.59600
Stop Loss: 0.58400
Take Profit: 0.60800
Market Structure & Bias
NZDUSD is currently in a clear bullish market structure on the H4 timeframe, characterized by consecutive higher highs and higher lows. Price has shown strong impulsive movement to the upside, indicating sustained buying pressure. The overall directional bias remains bullish, with expectations of continuation following a healthy pullback.
Technical Confluence
Price is approaching a previous resistance zone turned support around the 0.59600 level, aligning with the buy limit entry.
The level coincides with a bullish pullback area within the current uptrend, suggesting potential demand absorption.
Recent bullish momentum shows strong displacement, increasing the probability of continuation after retracement.
The entry sits near a minor demand zone, where prior buying interest was evident.
Overall price action suggests buyers remain in control, with pullbacks being corrective rather than impulsive.
Risk Management
The stop loss at 0.58400 is placed below the key structural low, invalidating the bullish setup if breached. This placement protects against deeper retracements while allowing sufficient room for price to react.
The take profit at 0.60800 targets the next significant resistance area, offering a favorable risk-to-reward ratio and aligning with trend continuation objectives.
Trade Expectation
Price is expected to pull back into the 0.59600 demand area, find bullish support, and resume the upward move toward the 0.60800 target. As long as price holds above the defined stop loss, bullish continuation remains the primary expectation.
Disclaimer
This analysis is for educational purposes only and does not constitute financial advice. Always apply proper risk management and ensure the trade aligns with your personal trading plan and risk tolerance.

Bullish momentum to extend?Aussie (AUD/USD) could fall towards the pivot, which aligns with the 50% Fibonacci retracement, and could bounce to the 1st resistance.
Pivot: 0.6813
1st Support: 0.6753
1st Resistance: 0.6937
The opinions given above constitute general market commentary and do not constitute the opinion or advice of IC Markets or any form of personal or investment advice.
Any opinions, news, research, analyses, prices, other information, or links to third-party sites contained on this website are provided on an "as-is" basis, are intended to be informative only, and are not advice, a recommendation, research, a record of our trading prices, an offer of, or solicitation for, a transaction in any financial instrument and thus should not be treated as such. The information provided does not involve any specific investment objectives, financial situation, or needs of any specific person who may receive it. Please be aware that past performance is not a reliable indicator of future performance and/or results. Past performance or forward-looking scenarios based upon the reasonable beliefs of the third-party provider are not a guarantee of future performance. Actual results may differ materially from those anticipated in forward-looking or past performance statements. IC Markets makes no representation or warranty and assumes no liability as to the accuracy or completeness of the information provided, nor any loss arising from any investment based on a recommendation, forecast, or any information supplied by any third party

Daily Major Forex Pair Scanning Session – 17 (27.01.25)Scanning multiple forex pairs to filter high-quality trade setups. No trades forced, only structure-based opportunities.
Note: There is a delay in this video due to upload processing time.

Key resistance ahead?GBP/JPY is rising towards the pivot and could reverse to the 1st support, which has been identified as a pullback support.
Pivot: 211.96
1st Support: 208.94
1st Resistance: 214.29
The opinions given above constitute general market commentary and do not constitute the opinion or advice of IC Markets or any form of personal or investment advice.
Any opinions, news, research, analyses, prices, other information, or links to third-party sites contained on this website are provided on an "as-is" basis, are intended to be informative only, and are not advice, a recommendation, research, a record of our trading prices, an offer of, or solicitation for, a transaction in any financial instrument and thus should not be treated as such. The information provided does not involve any specific investment objectives, financial situation, or needs of any specific person who may receive it. Please be aware that past performance is not a reliable indicator of future performance and/or results. Past performance or forward-looking scenarios based upon the reasonable beliefs of the third-party provider are not a guarantee of future performance. Actual results may differ materially from those anticipated in forward-looking or past performance statements. IC Markets makes no representation or warranty and assumes no liability as to the accuracy or completeness of the information provided, nor any loss arising from any investment based on a recommendation, forecast, or any information supplied by any third party

BTCUSD – 1H Long Setup AnalysisBTCUSD – 1H Long Setup Analysis
Educational purpose only
Market Context
Price formed a weak low near 87,300 and is showing a short-term recovery.
Structure indicates a possible corrective bounce after the recent sell-off.
Price is trying to hold above short-term EMAs, suggesting early bullish strength, but higher resistance remains overhead.
Long Setup (Bullish Scenario)
Entry zone (pullback / hold area): 87,600 – 87,800
This area aligns with short-term support and recovery structure.
Stop Loss (SL)
Stop Loss: 87,200
Below the recent swing low and invalidation of the bullish idea.
Targets
Target 1: 88,450 – 88,650
Target 2: 89,400 – 89,700
Extended Target: 90,300 (previous supply / resistance zone)
Invalidation
A strong 1H close below 87,200 would invalidate the long setup and may open further downside.
Summary
Long idea is counter-trend / recovery-based.
Works best with confirmation and support hold.
Conservative approach: partial profits near first resistance.
For educational purposes only.

BTC - an ICT and Wyckoff illustration of the current rangeWe have a lot going on in this chart, so let's simplify it.
When you start looking at time based liquidity, the charts simply start making sense... I have a completely free indicator called "Time Liquidity a Zulu Kilo Indicator" that will help you make sense of ICT much faster than any other indicator.
-We have consolidation which is a tell-tale sign that large hands want to control a very specific area, which will be extremely important in the future (for a far bigger move).
-Price manipulated above a previous monthly high, into a higher timeframe weekly FVG, which then reversed and created an IFVG while simultaneously creating displacement down AND confirming below a CISD level.
-This is also setting up a type 1 distributive Wyckoff schema, with the UT (upthrust) as the manipulation, the Wyckoff upper range setting the tone for a return to OTE (optimal trade entry).
Pretty much every check box has been checked for us to be able to take a short position from 93k to 96k.
-Manipulation above a higher timeframe (in our case monthly) into a high timeframe FVG - CHECK
-Price broke below the displacement created on the way up (iFVG), and then created displacement to the downside (FVG) while broaching the CISD (Change in state of delivery / which is yet another validation of bearish intent). CHECK
Price should now retrace into the 68% - 79% OTA (optimal trade entry) and reverse below the yearly open.
As I've previously written on this subject, I believe that we have one more strong bullish move before a much deeper, larger and significant Bitcoin crash THIS YEAR that will test around the 50k price levels...
We WILL be looking for bullish moves below 74,500 (another manipulation possibility below the yearly lows).

USOIL M30 | Bullish Bounce Off Pullback SupportMomentum: Bullish
Price is currently above the ichimoku cloud.
Buy entry: 61.202
- Pullback support
- 61.8% Fib retracement
Stop Loss: 60.900
- Swing low support
Take Profit: 61.660
- Swing high resistance
High Risk Investment Warning
Stratos Markets Limited (fxcm.com/uk), Stratos Europe Ltd (fxcm.com/eu):
CFDs are complex instruments and come with a high risk of losing money rapidly due to leverage. 69% of retail investor accounts lose money when trading CFDs with this provider. You should consider whether you understand how CFDs work and whether you can afford to take the high risk of losing your money.
Stratos Global LLC (fxcm.com/en): Losses can exceed deposits.
Please be advised that the information presented on TradingView is provided to FXCM (‘Company’, ‘we’) by a third-party provider (‘TFA Global Pte Ltd’). Please be reminded that you are solely responsible for the trading decisions on your account. Any information and/or content is intended entirely for research, educational and informational purposes only and does not constitute investment or consultation advice or investment strategy. The information is not tailored to the investment needs of any specific person and therefore does not involve a consideration of any of the investment objectives, financial situation or needs of any viewer that may receive it. Past performance is not a reliable indicator of future results. Actual results may differ materially from those anticipated in forward-looking or past performance statements. We assume no liability as to the accuracy or completeness of any of the information and/or content provided herein and the Company cannot be held responsible for any omission, mistake nor for any loss or damage including without limitation to any loss of profit which may arise from reliance on any information supplied by TFA Global Pte Ltd.
Stratos Trading Pty. Limited (fxcm.com/au):
Trading FX/CFDs carries significant risks. FXCM AU (AFSL 309763), please read the Financial Services Guide, Product Disclosure Statement, Target Market Determination and Terms of Business at fxcm.com/au

EURCHF H4 | Bearish Reaction Off Pullback ResistanceMomentum: Bearish
Price is currently below the ichimoku cloud.
Sell entry: 0.92530
- Pullback resistance
- 61.8% Fib retracement
- Fair value gap
Stop Loss: 0.92986
- Overlap resistance
Take Profit: 0.91913
- Swing low support
High Risk Investment Warning
Stratos Markets Limited (fxcm.com/uk), Stratos Europe Ltd (fxcm.com/eu):
CFDs are complex instruments and come with a high risk of losing money rapidly due to leverage. 69% of retail investor accounts lose money when trading CFDs with this provider. You should consider whether you understand how CFDs work and whether you can afford to take the high risk of losing your money.
Stratos Global LLC (fxcm.com/en): Losses can exceed deposits.
Please be advised that the information presented on TradingView is provided to FXCM (‘Company’, ‘we’) by a third-party provider (‘TFA Global Pte Ltd’). Please be reminded that you are solely responsible for the trading decisions on your account. Any information and/or content is intended entirely for research, educational and informational purposes only and does not constitute investment or consultation advice or investment strategy. The information is not tailored to the investment needs of any specific person and therefore does not involve a consideration of any of the investment objectives, financial situation or needs of any viewer that may receive it. Past performance is not a reliable indicator of future results. Actual results may differ materially from those anticipated in forward-looking or past performance statements. We assume no liability as to the accuracy or completeness of any of the information and/or content provided herein and the Company cannot be held responsible for any omission, mistake nor for any loss or damage including without limitation to any loss of profit which may arise from reliance on any information supplied by TFA Global Pte Ltd.
Stratos Trading Pty. Limited (fxcm.com/au):
Trading FX/CFDs carries significant risks. FXCM AU (AFSL 309763), please read the Financial Services Guide, Product Disclosure Statement, Target Market Determination and Terms of Business at fxcm.com/au
