[XAUUSD] Buy Idea. Inverse head & shoulderAfter the wick rejection at the support zone, I believed gold will trend up towards the last resistance zone. Simple but profitable. You can catch buys anywhere between the two zone, as price makes it's way back up.
Head-and-shoulder

[USDJPY] Sell idea! Head & Shoulder ReversalUSDJPY is currently in a major level of support where price can either go up or go down. Price is going to move down and form a perfectly executed head and shoulder Reversal. I see price dropping initially down to the last lowest wick, retracing back to entry and then making it's official breakout for the sell.

How to Properly Sell the Head & Shoulder Pattern for Easy $A head and shoulders pattern is a chart formation that resembles a baseline with three peaks, the outside two are close in height and the middle is highest. In technical analysis , a head and shoulders pattern describes a specific chart formation that predicts a bullish-to-bearish trend reversal.
The head and shoulders pattern is believed to be one of the most reliable trend reversal patterns. It is one of several top patterns that signal, with varying degrees of accuracy, that an upward trend is nearing its end. A head and shoulders pattern is a chart formation that resembles a baseline with three peaks, the outside two are close in height and the middle is highest.
A head and shoulders pattern describes a specific chart formation that predicts a bullish-to-bearish trend reversal. The head and shoulders pattern is believed to be one of the most reliable trend reversal patterns. Like all charting patterns, the ups and downs of the head and shoulders pattern tell a very specific story about the battle being waged between bulls and bears.
The initial peak and subsequent decline represent the waning momentum of the prior bullish trend .
Wanting to sustain the upward movement as long as possible, bulls rally to push the price back up past the initial peak to reach a new high (the head). At this point, it is still possible that bulls could reinstate their market dominance and continue the upward trend.However, once price declines a second time and reaches a point below the initial peak, it is clear that bears are gaining ground.
Bulls try one more time to push price upward but succeed only in hitting the lesser high reached in the initial peak. This failure to surpass the highest high signals the bulls' defeat and bears take over, driving the price downward and completing the reversal.

CGC -- INVERSE H & S -- A BUY CALLINVERSE HNS SPOTTED. THE NECKLINE SHALL BE RETESTED AND THE PRICE SHALL FLY TO TP1 (1.0 FIBO) AND NEXT TP2 (1.618 FIBO).

Head & Shoulder Pattern Using Mondays Candles Set UPThis is based on mondays candles which are boxed in the coloured boxes the break out of the zone indicates the head as shown.
Then we had a 100% retrace back to the bottom of that Monday zone creating the neck line.
Then the market moved back towards the opposite creating the right shoulder its right about on the support of the left shoulder i expect this to now be in a buy position and possibly move for a 30 to 50 pip movement

EURCAD Analysis for shorting opportunityAfter what felt like an eternity, price has finally formed the second shoulder completing what looks like an INVERTED DOUBLE HEAD and SHOULDER. Now price has reached the neckline and a major level of structure. One could ask themselves WHAT WOULD PRICE DO?.. break it right away? or take a short ride back down before trying one more time. With that shooting start its clear that the break wont happen now. So we will be taking a small short position is price tries to go back there and upon good price action short.
Gud Luck.


DIS Head and ShoulderNice one pattern here:)
My play is sell short, S/L on the peak of the right shoulder and T/P at the blue line area

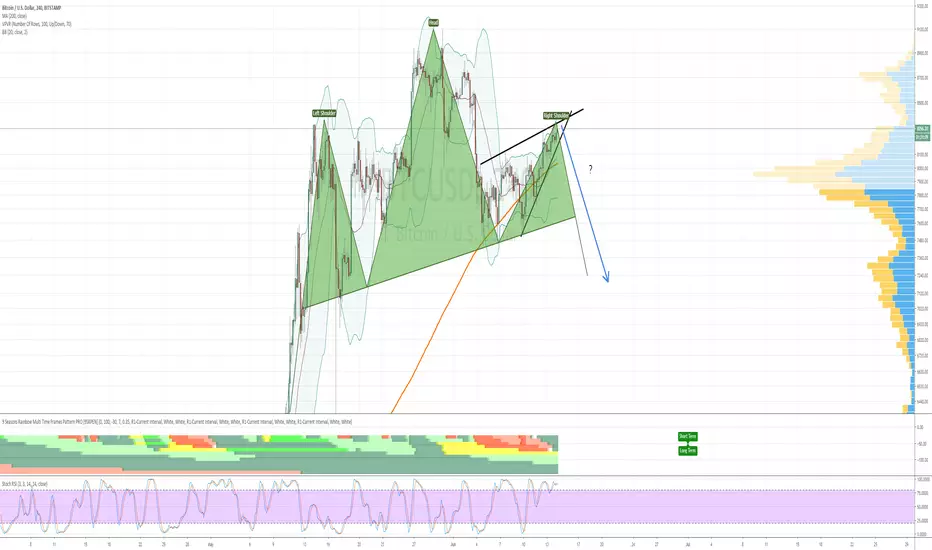
Head and shoulder plus rising wedge: Probability for correction So there's a H&S-ish looking pattern going on here. However, I am not 100% sure, as this looks a bit distorted.
Then there's also a rising wedge at the same time, which tells a higher probability for downside as well.
But as the last times BTC just wonderfully ignored any TA, I am not sure myself this time.
BTC maybe wants to make it look as if an imminent correction would occur, just to go berserk and pump to 12k.
So, I am not trading this pattern here, just observing.
The fearless among you could try to trade this pattern, by opening very slight shorts, with tight SL's at maximum 8450.
Good luck and let's see what BTC is up to :)
Update: Cardano Almost there (New Resistance & Support)We almost reached our IH&S Target of 1900 Sats Today.
Target was reached way earlier then i expected. Which means there is more room for growth before ADA summit on 17th-18th april.
If we Break 1900 sats in few days and close above it then we may go towards 2400.
If BTC helps Ada may also reach 3k Sats very soon.
Positive Signal: 50 EMA Crossing 200 EMA on daily chart.
Negative Signal: Weekly and daily RSI|STOCH RSI Overbought. (It may stay Overbought for long period especially when bulls are in Control.)
Retracement Level: Cardano have had very good last few weeks. It may retrace a bit which will be healthy correction. I am expecting a retrace towards 1700. If this level breaks, 1530 sats should hold.
If you were around in last ADA Bull Cycle then you may have noticed that ADA just pumps and stays there for few days and pumps again. Last Bull cycle was from 300 sats to 9k sats and all this happened within 40 days of time.
Good luck trading Ada.

BTC: Possible inverted H&S in the makingBTC likes those head and shoulder patterns. Because traders like this pattern, especially the inverted head and shoulder type.
However, we should remember how often this pattern has failed in the past months. So many times, there was an inverted H&S structure in the making, and many times, it failed. It looked as if it would burst through the neckline, just to fail in the last minute, and dump.
We are finally approaching the interesting levels that I have been mentioning since weeks and weeks now.
1. The lower logarithmic downtrend resistance connecting the ATH and the 6500 level where the last big dump started.
2. The higher logarithmic downtrend resistance connecting the multiple smaller tops since early 2018, with the 6500 area. This is the stronger of the two.
3. At the area of the upper downtrend resistance (around 4900USD right now, in 1-2 weeks at 4700-4800USD), we also have the upper weekly BBand and the daily MA200.
4. The number of daily transactions is still far away from ATH: www.blockchain.com
Therefore, if the inverted H&S fails, it will bounce off the lower resistance, the low will therefore also be lower, around 1800 USD.
If the inverted H&S succeeds, we might see a nice rally to the upper resistance, as high as 4800 USD. But this resistance is ultra strong, and BTC is very overbought on weekly, volume still low, no capitulation has yet occured.
Still too many weak hands in BTC, and too many people claiming 3200 has been the bottom. No despair yet! Also, the number of transactions, which I consider one of the strongest metrics for BTC, is still far away from ATH.
All this leads me to believe, that in the best case, BTC reaches 4800, then dumps down to 2400 USD. I see these two scenarios unfold in the coming weeks.
I see almost no chance (of course the chance is not 0%, but still quite low) for BTC going through both resistances, as sorry as I am.
After that final shakeout, we should see a very strong weekly volume bar. Then the low could be confirmed and finally real reversal can start to happen.
The momet of truth comes nearer and nearer :) Good luck!

ADABTC Make Inverse Head And Shoulder Pattern In 4 Hour Chart ADABTC Make Inverse Head And Shoulder Pattern In 4 Hour Chart In Binance Exchange Ada Look Bullish

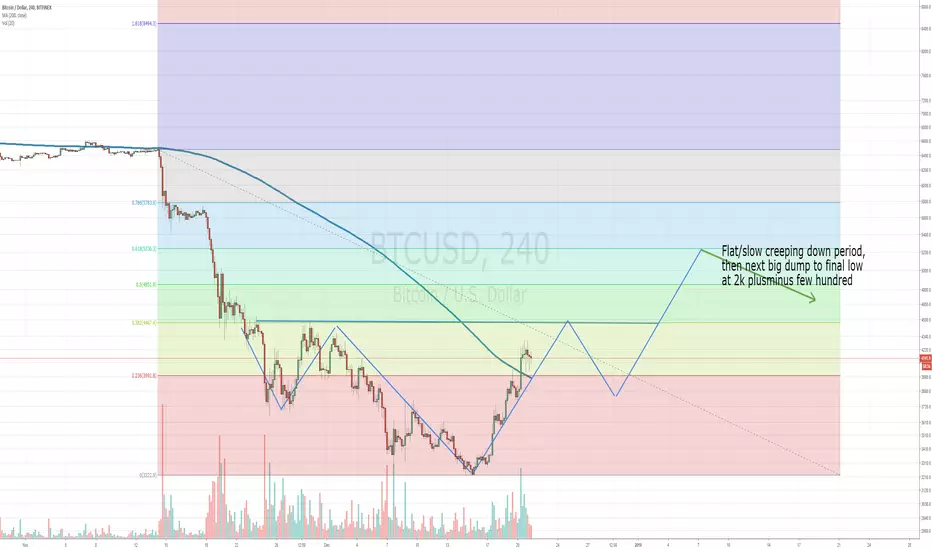
Possible inverted H&S structure in the makingThis could catapult BTC back into the 5000s, for a time at least.
Then we'll see some sideways creeping, and a longer flat, stable period of weeks, until BTC will make the final dump, sometime in March-April,
the low still remains at 2000 plusminus a few hundred imho.
I could of course be wrong, but that is the general feeling I have.
Weekly timeframe also points to this as well.
Good luck !
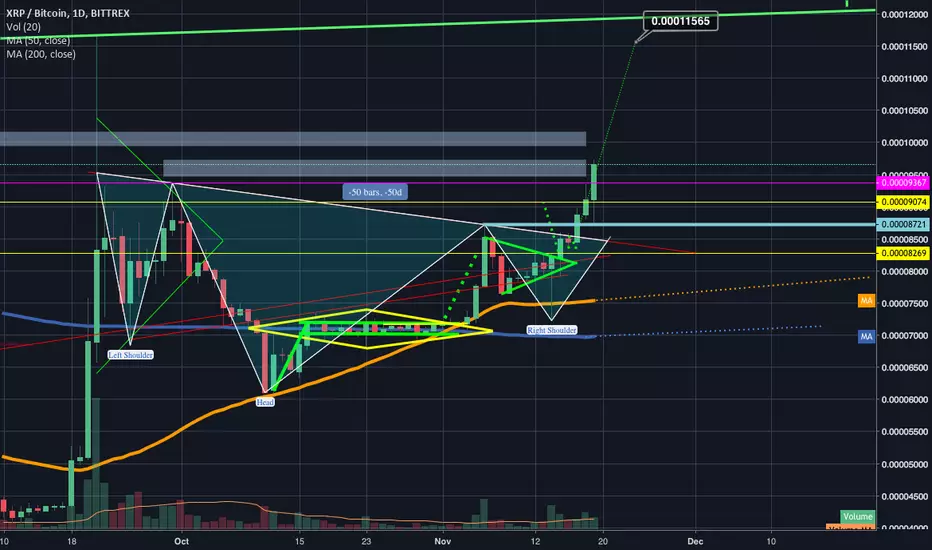
XRP continues bull run breaks key reistance triggers inv h&Swe can see XRP finally broke the resistance of the horizontal pink line. XRPLedger payments volume is really starting to boom as well on the xrpcharts on ripples website. Onward and upward we should hit the inv h&s breakout target within the next 1-3 1day candles is my estimation. Also greatly widening the gap and dominance over Ethereum and making big gains on btc at the same time. XRP is quickly becoming the standard. Once the XRPUSD pair finally gets its golden cross on the 1 day chart and sustains it then we are really gonna be taking off!

EURUSD - Long (Head and shoulder pattern completed)Price has completed a head and shoulder pattern and is currently retesting break line. Looking for a signal to buy to 1.173.
For further confirmation, wait until price breaks daily resistance line and then place order.

Head and ShouldersLooks like the Head and shoulders is forming quite nicely, and target around 7.7k to the last support, we will still have to wait for the follow through with volume. might be in for some bear flags after that.

H&S AND A BIG ALT FOMOFriends
When I see the chart at 1 or 2 minutes, I examine the relationship between volume and price with a magnifying glass. What I observe is a predominance of bearish muscle strength over the bullish forces. I see it not only because of the red volumes bigger than the green ones (3 to 7 times more powerful), but I also see it because of the effort it takes for the green volumes to be able to go up in price at key moments. A lot of green volume for little price increase. That means that the bulls are holding back the price.
At the same time and from a broader perspective, I see that just at this moment it seems that we are going down, the main ALTs have had incredible price increases creating a great FOMO.
What I believe is that the bears' war booties will be all the FOMO of the ALTS (many exchanges do not have ALTS / U $ S stop lose, they only have stop loss ALT / BTC). The whales know it and there the trap to keep their money.
I also see that the whales do not want to go to 12K because at those levels the sharks and dolphins (which are not now) come into play so that it would be more difficult for them to manipulate the market. Now the whales manipulate it because they are alone.
My analysis is a mixture of indicators and psychology because we must not forget that TA is a human psychological game above all things.
Only for educational purposes.
If you are agree with my idea, give me a Like :)

bearish brkdown of bear pennant; below Head & Shoulders necklinethe bear pennant did what probability expected it to do and finally broke down...as it did it has now dipped below the neckline of the head and shoulders. There is a chance on the new 4 our candle that one of our 4 support lines can break its fall and bounce it back above the neckline of the head and shoulder before this 4 hour candle closes to prevent it from triggering but there's also good odds that we may indeed trigger the head and shoulders. A solid support rebound zone would be the 4hr 50ma...potentially even the 4hr 200ma but more likely the 50ma....I shorted but put fractional buy backs at 7777, and 7641. there's still good odds we could dip further than that...however I see that the ascending trendline is now overlapping the eve pink curved trendline to create a double reinforced support so that could be a good rebound zone as well. I'm hoping we dip to the 50ma and then proceed to be bounced back above it before the 4hr close there by avoiding triggering the head and shoulders...if the head and shoudler is triggered and validated we could potentially dip below the eve trendline on a wick before rebounding but that doesnt necessarily invalidate the trendline instead it may just need to have its angle slightly readjusted since its currently a projection angle...changing the angle slightly of the eve could maintain all the previous candle touches it has while being able to encompass wherever the drop takes us as well..anyways for now we are short at least to the 200ma and probably the 50...and possibly even down to the eve trendline as I predicted a few ideas back that we would find our way back down to it after the bull impulse subsided. Best of luck out there this is only what I'm planning to do and not meant to be taken as financial advice...goodluck and thanks for reading.

TRX, Bullflag and Head & shoulders reversalTRX,
Entry on confirmation candle over neckline. That can spark a move to break out of the flag and continue the lenght of previous pole.
Entry 0.00000421 - 0.00000424
Stoploss 0.00000410
Target 1: 0.00000500

TRX Bullflag and head & shoulders reversalMy plan for TRX.
If we break neckline of the head & shoulders reversal we are likely to break out of the flag too.
Entry: 0.00000421 - 0.00000424 ( Over neckline ) on confirmation candle.
Stoploss: 0.00000410 ( Under right shoulder )

Giant Colossus: Head and Shoulders PatternGigantic Head and Shoulders pattern forming. Prepare for destruction down to 4k.

BTC/USD in head and shoulder patternI just found that there is going to be a head and shoulder pattern and buyer can wait for small profit from this pattern. It has a support on 12980 and the resistance on the 16510 where you can do a short for the bitcoin.
