#HBAR—This HNS Structure Rarely Fails After Liquidity Is Taken
Yello Paradisers! -Are you noticing how HBAR is quietly setting a trap after taking liquidity exactly where most traders panicked and sold, and could this be the moment when patience finally pays off?
💎#HBAR forming a clean inverse head and shoulders pattern right at a previous support zone, which is a classic professional accumulation behavior. Before this structure started to develop, price deliberately swept liquidity below support, forcing out weak hands and triggering stop losses from inexperienced traders. This is exactly the type of environment where smart money likes to build positions.
💎After the liquidity sweep, we saw a sharp bullish impulse accompanied by strong volume. This move was crucial because it broke above the previous swing high of the left shoulder, which also aligned perfectly with horizontal resistance acting as the neckline. This is a strong technical confirmation that buyers are stepping in with conviction, not randomly.
💎At the moment, #HBAR is forming the right shoulder. What is important here is not speed but quality. Price is consolidating tightly while volume is clearly declining. This is a healthy sign, as it signals an absence of aggressive sellers. When price holds near the neckline without heavy selling pressure, it usually increases the probability of continuation to the upside rather than a breakdown.
💎The RSI already gave us an early warning signal. A bullish divergence formed between the left shoulder and the head, showing that downside momentum was weakening even while price was still moving lower. This divergence often appears before trend reversals and is another reason why this structure deserves close attention.
💎Another key detail is the neckline behavior itself. This level has already been tested three times, and each test weakens the ability of sellers to defend it. Repeated tests usually favor a breakout rather than rejection, especially when combined with declining volume during consolidation.
💎From a level perspective, major support is located around the 0.072 area. As long as the price holds above this zone, the bullish structure remains valid. On the upside, the major resistance sits near 0.135, with an intermediate resistance around 0.110 that may cause short-term reactions.
That's why Paradisers, we are playing it safe and focusing only on high-probability structures like this one. Strive for consistency, not quick profits. Treat the market as a businessman, not as a gambler. This is the only way you will make it far in your crypto trading journey and get inside the winner circle.
MyCryptoParadise
iFeel the success🌴
Head_and_shoulder

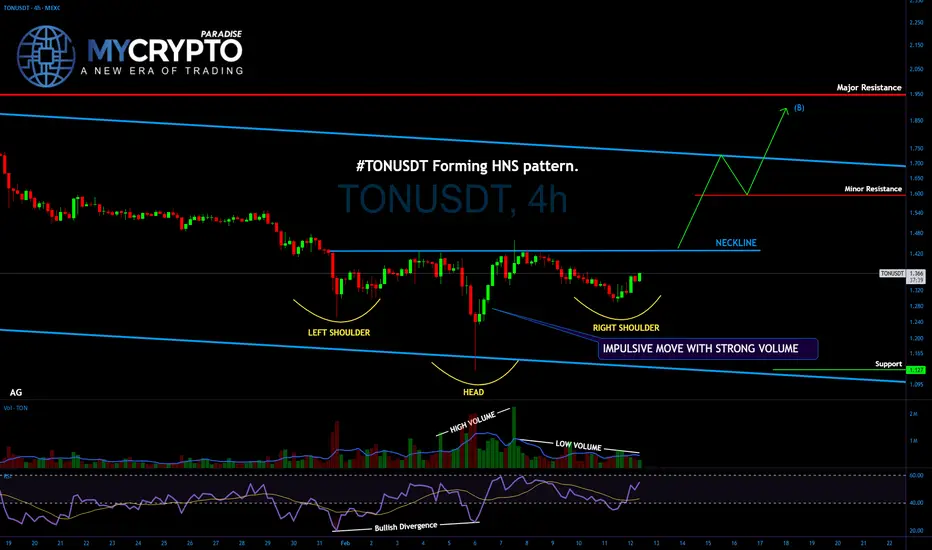
#TONUSDT Is Quietly Loading for a Breakout? –Trap for sellers
Yello Paradisers! Are you prepared for a potential #TONUSDT breakout while the majority is still emotionally reacting to the previous liquidity sweep?
💎#TON is forming a textbook inverse head and shoulders at the bottom of the descending channel support. Before the structure developed, price swept liquidity below the channel, triggering stop losses and forcing weak hands out. This liquidity grab is typical smart money behavior before accumulation phases. The bottom of the head formed at $1.126, which now acts as the key structural invalidation level.
💎The bullish impulse that followed the sweep was decisive. Volume expanded aggressively, and price broke above the left shoulder swing high, aligning with horizontal neckline resistance. This breakout confirmed buyer strength and shifted short-term structure bullish. Currently, price is building the right shoulder with tight consolidation and declining volume — a healthy compression phase that statistically favors continuation rather than breakdown.
💎Momentum supports the structure. RSI printed a clear bullish divergence between the left shoulder and the head, signaling weakening downside momentum before the reversal. Additionally, repeated neckline tests are reducing seller strength. Each retest absorbs supply, increasing breakout probability, especially while volatility contracts near resistance.
💎Key levels remain clear and objective. Support at $1.126 (pattern invalidation). Intermediate resistance around $1.60 (short-term reaction zone). Major resistance and breakout target around $1.80. As long as the price holds above structural support, the bullish bias remains intact. A confirmed high-volume breakout above the neckline would open expansion toward higher liquidity zones. The overall trend of #TON is down; we are trading a counter-trend move.
Strive for consistency, not quick profits, paradisers. Treat the market as a businessman, not as a gambler. Discipline and patience are what separate professionals from emotional traders.
MyCryptoParadise
iFeel the success🌴
Careful!TREET Analysis
Closed at 32.01 (10-02-2026 03:20pm)
Head & Shoulder pattern appeared;
with potential target around 29;
either this could be a Support level if we
witness Bullish Candles else,
Better to exit around 33 - 33.70 once.
It can be re-bought after crossing &
Sustaining 34.20.

NVIDIA (NVDA): Head and Shoulders Updated ChartThis is an updated chart for posted earlier as right shoulder completed a bit later
Spotted on time as the price is right on the edge of breaking the Neckline, watch it closely
RSI already broke below crucial support to align with the pattern
Target for pattern - $130
Next support - $91

Bitcoin Ethereum and Solana show bullish structureBTC , SOL , and ETH are all three coins most likely to show growth, as BTC is expected to rebound from the resistance line we reached (~$74,450 and ~$78,000)
We also collected all the main liquidity from the bottom, leaving behind a huge volume of liquidity now higher
BTC also failed to break the trend line and formed a structure, with the low above the previous one (by ~0.13%), so we are still in an upward trend
The resistance line has not been broken, and even if it is, with the formation of a descending structure, there will still be a price rebound and a small upward rebound
The unemployment data is expected in the coming days. The index is likely to drop from 4.4% to 4.5%, which will have a positive impact on the market, as this is not a critical increase. This means investors will expect a Fed rate cut, which will create additional liquidity and will be more likely to buy back
Globally, we have also formed the right shoulder of the Head and Shoulders pattern, which I wrote about last year.
Forming the right shoulder is always a sign of success. The bullish flag pattern is the originating pattern
We also see ABC correction waves formed, after which a 5-stage growth cycle usually begins
It's too early to take a more global view of the scenario...
Full breakdown with levels and graphs on the website

H&S on Bitcoin Daily Is Now Confirmed!Trading Fam,
Not a long post here as I have said enough on this in many of my previous posts. Just wanted to update you on the Head and Shoulders pattern. Our candle close today has now confirmed a break in the neckline. This is bad. We will now look to the weekly candle close to confirm further price action down. The weekly could save us. But this is doubtful.
Remember, I have outlined at least 6 additional strong bearish patterns in previous posts that have all been confirmed. This H&S was really the final nail in the coffin. My target down remains a rough 40-50k. If we're lucky, we'll turn up again at 60k. But that remains to be seen.
One more note and something to keep an eye on, Michael Saylor's MSTR BTC buy-in price is roughly 74k. If Bitcoin breaks below that for any sustained amount of time, things could get spicy!
The show must go on.
✌️Stew

Inverse H & S pattern4165 Analysis
Closed at 141.50 (22-01-2026)
Inverse H & S pattern targeting around 150.
Immediate Supports are around 140 & then around 135 - 136.
Sustaining 140 may lead the price towards 150 - 151 initially.

Ethereum - can it be?Setup
Bearish - potential bullish reversal
Inverse H&S bottom pattern
Rebounded off 50% retracement of 2025 rally
Above 20/50 SMA
Below 200 SMA
RSI moved into bullish range
Commentary
NOTE: The setup is similar to Bitcoin and both will likely move in the same direction so be careful not to double up on a correlated trade.
The Bullish case for Ethereum is a bit more convincing with an inverse H&S pattern - but it could also turn into a triangle pattern breakdown.
Strategy
Buy touch of broken neckline
Wait and buy on break above last peak at 3,300.
But - as always - that’s just how the team and I are seeing things, what do you think?
Share your ideas OR send us a request!
Cheers,
Jasper
Disclaimer:
The communication does not constitute investment or trading advice, nor does it include any recommendations. Additionally, it does not serve as an offer or solicitation to engage in transactions involving financial instruments. WeTrade does not take responsibility for any actions taken based on the information provided, nor for any outcomes that may occur as a result of the actions taken.

ETH-The final drop before the cows come home (SHORT TERM SHORT)hello all 👋🙋♂️🙋♀️ Thank you so much for coming today
Let's get right to it💡. Today we are looking at a 4 hour view of ETHEREUM. I have noticed several things about ETH price action and what it could indicate.
⬆️ above on chart 📈📉 you can see I have labeled
major trend line (support line)
We have made contact with this long standing trend line and have seen some bullish pressure after doing so.
🤸🤸♂️
HOWEVER
There has been a Head and shoulders bearish pattern formed on the 4 hour view in which we did go down from but bounced back up to make a bearish flag 🐻🧸
🌊🏄♂️🏄♀️
MORE RECENTLY
We have formed a bearish harmonic pattern, which leads me to believe we will try to continue our head and shoulders pattern (with a drop in price) ⏬🔻But will catch support at our major trend line ~(3800)
🐼This is a Short term short Idea. The cryptocurrency market is extremely volatile.💣
This is not financial advice
🐶
Always have a stop loss ✋🛑💲 set🆗
Any thoughts 💭💡, questions 🙋♀️🙋♂️❓, good 👍, bad👎, happy 😄 or sad 😥, in the comments always welcome.😄
Jazerbay ☯️

AUDUSD rally hangs on China stimulus or Head & ShouldersThe Australian dollar was a top performer on Thursday, surging to test the 0.6700 resistance despite a rising US dollar. But the Aussie is now at a critical technical junction. Is this a move that could be fuelled by China's new stimulus and record gold prices, or are we forming the right shoulder of a dangerous H&S pattern?
We analyse the tailwinds lifting the AUD against the bearish technical risk of a head and shoulders formation on the daily chart. We map out the key levels at 0.6727 and 0.6660 that will decide the next major move.
Key topics:
China stimulus & commodities: The PBOC's decision to cut policy rates on January 19 is a direct boost for Australia's economy, while gold ($4,600) and silver (nearing triple digits) provide more support.
Danger zone: The rally faces resistance at 0.6727 (the previous corrective peak). A failure here could confirm the right shoulder of a head and shoulders pattern, risking a drop to 0.6660 and 0.6592.
Bullish breakout: If momentum clears 0.6727, the bearish structure would be invalidated. This would likely confirm a double bottom or (running) triangle breakout targeting multi-year highs at 0.6766.
Trade scenarios:
Bearish : Rejection at 0.6700/0.6727 + Break below 0.6660 = Head and Shoulders confirmation.
Bullish : Hold above 0.6660 + Break above 0.6727 = Triangle/Double Bottom breakout to 0.6766+.
Are you betting on the China stimulus breakout or fading the resistance at 0.67? Let us know in the comments!
This content is not directed to residents of the EU or UK. Any opinions, news, research, analyses, prices or other information contained on this website is provided as general market commentary and does not constitute investment advice. ThinkMarkets will not accept liability for any loss or damage including, without limitation, to any loss of profit which may arise directly or indirectly from use of or reliance on such information.

GOOGL Swing - Head & Shoulderson the 4H chart formed a Head and Shoulders formation passing a resistance area with more buyers than sellers
Upside can be the depth of the head which would equal to almost 10%
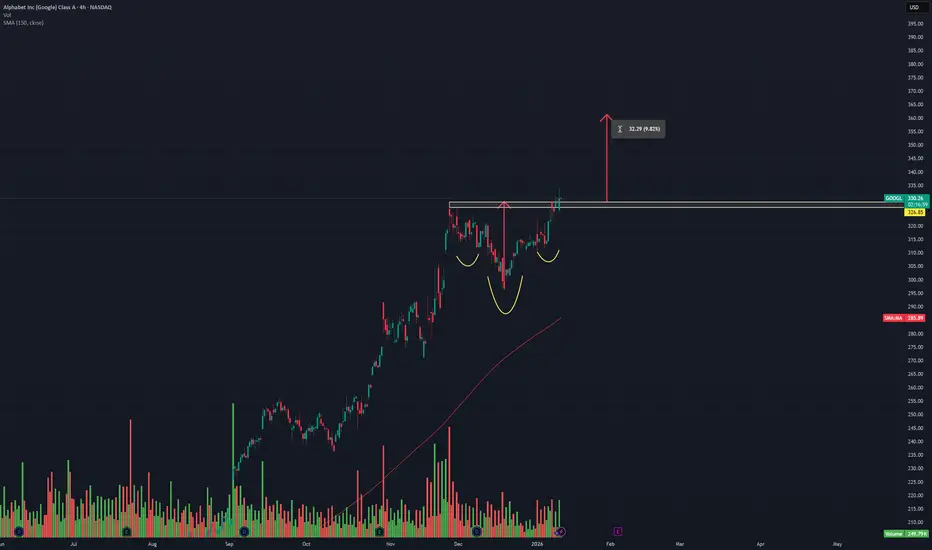
Chart Patterns ranked by reliability (1-8)Chart Patterns as a Strategy (Not a System)
In the world of technical analysis, chart patterns are often marketed as stand-alone trading systems. In reality, their real edge comes from probabilistic structure recognition, not prediction.
The key insight from my large-sample testing (10 years, 200,000+ patterns (Futures, FX)) is this:
Patterns don’t predict direction — they quantify structural bias once price has already revealed intent.
That distinction is what separates profitable traders from pattern collectors.
How These Patterns Were Tested (Why the Stats Matter)
All patterns discussed below were:
Only counted once fully completed
Required confirmed breaks of structure (trendline, neckline, or support/resistance)
Measured using objective projection rules, not discretionary targets
TP Rule: Full Head and Shoulder Height, using the Head distance and the right shoulder as the SL.
Full Height of triangles, and a full height for flags as well.
Twice the height of the Channel as TP, and Time TP for Channels, for half of the duration of the it.
Rectangles were Full Box Width as TP, and a time-based TP of 1/4 the Length.
It could be trailed further, but some such as Rectangle TP made great mean-reversion trade.
This removes hindsight bias — a major flaw in most pattern discussions.
Continuation Patterns (Trend Context Is Mandatory).
#8. Bull & Bear Flags (~67%) (Alt. Name: Cups, Volatility Contraction Pattern)
Occur after near-vertical impulse moves, typically the 50 EMA can filter the direction.
Represent temporary pauses, not reversals.
Best when:
Flag is tight
Forms near the extreme of the impulse
Volume contracts during consolidation
Professional takeaway:
Flags are trend health checks, not entries. If a flag fails, momentum is likely exhausted.
#7. Ascending & Descending Triangles (~73%)
Market compresses against a hard level
One side shows aggression, the other absorption
Breakout confirms institutional imbalance
Use them to answer:
“Is price being accumulated or distributed?”
#6. Ascending & Descending Channels (~73%) (Alt. Name: Cups & Handle)
Wide consolidations between parallel trendlines
Stronger than flags due to time + participation
Breakouts often lead to measured trend continuation
Key insight:
Channels are delayed continuation, not indecision.
Reversal Patterns (Confirmation Is Everything)
The Joker: Double Tops & Bottoms (75–79%)
Require structural failure
Completion only occurs after neckline break
Bottoms outperform tops statistically (markets rise faster than they fall)
⚠️ Common mistake:
Anticipating the second top/bottom instead of waiting for confirmation.
The Queen: Triple Tops & Bottoms (77–79%)
Stronger due to repeated rejection
Represent exhaustion of dominant participants
Interpretation:
The market tried three times — and failed.
The King: Rectangle Patterns (~78–80%)
Flat consolidation after a trend, more than 3 touches top and bottom.
Essentially failed reversal attempts.
Breakouts often trap traders positioned against the trend, it's best to enter on retest of breakout or earlier at the Bear-Bull Midline of the Box.
Critical lesson:
Most “double tops” fail — and turn into rectangles.
The Ace: Head & Shoulders (~83%)
Why it works so well:
Clear distribution → failure → confirmation
Captures institutional exit mechanics
Neckline break aligns with order-flow imbalance
Both regular and inverted versions are the most reliable classical patterns when properly confirmed.
⚠️ Common mistake: It's easy to mistake a Head and Shoulders with another pattern like a Double or Triple Bottom if it's neckline is not broken well.
The Trap Pattern: Pennants (~55%)
Despite being taught alongside flags:
Pennants break against trend too often
Over-compression increases randomness
Lack clear structural dominance, Pivot HL are spots where trader's should sell.
Professional rule:
If it looks too tight, it’s probably a coin flip.
It's better to target Equal High and Lows to the left as TP.
How Professionals Actually Use Chart Patterns
We don’t trade patterns — we trade what they imply.
Patterns help answer:
Is the market accepting or rejecting price?
Are participants trapped or in control?
Is this continuation, transition, or reversal?
They work best when combined with:
Market structure (HH/HL, LH/LL)
Time-of-day context
Volume or order-flow
Higher-timeframe bias
Final Truth About Pattern Accuracy
Pattern Type Role Best Use
Flags / Channels Continuation Trend validation
Triangles Pressure build Breakout bias
Double / Triple Reversal Failure detection
Rectangles Continuation Trap identification
Head & Shoulders Reversal Distribution confirmation
Pennants ❌ Avoid

Daily Analysis: Nifty 6th Jan 2026The candles are under process of head and shoulder pattern (bearish). The right shoulder is still to be formed and it is projected to 26200-26250 as resistance for this shoulder.
All major levels are mentioned in the video, so watch the entire video.

GOLD (XAUUSD) – Inverted Head & Shoulders Setup📊 Technical Outlook
Gold is currently forming an inverted head & shoulders pattern, with the right shoulder established around 4308. Price action is consolidating near the neckline zone (4380–4400), and a confirmed breakout above this level would validate the bullish continuation.
🎯 Upside Targets
• TP1: 4540 – First long-term target aligned with measured move projection.
• TP2: 4650 – Extended bullish target, continuation of momentum.
📈 Trade Plan
• Entry Zone: Accumulation around 4308–4320, confirmation above 4380–4400.
• Stop-Loss: Below 4300 (invalidates right shoulder).
• Take Profit:
• TP1: 4540
• TP2: 4650
⚠️ Risk Notes
• A breakdown below 4308 risks invalidating the bullish setup.
• Watch for false breakouts at 4380; volume confirmation is key.
• Macro drivers (Fed policy, inflation, geopolitical tensions) may add volatility.
📌 Summary: As long as 4308 holds, gold remains bullish with potential continuation toward 4540 and 4650. Breakout above 4400 is the trigger for momentum buyers.

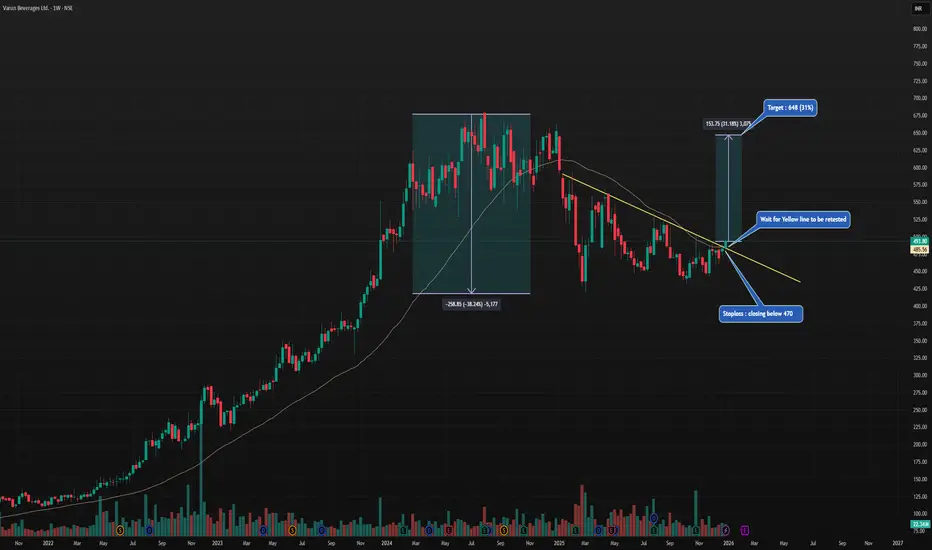
VBL : Ready to give you 30% within 06 MonthsHi Friends,
VBL looks promising now & ready for ~30% (648) upward journey. I am anticipating the stock to start its upward journey.
Targets, Stoploss & Entry are mentioned in the chart .
Please feel free to share your views regarding this chart & analysis .
Note : I am not a SEBI registered advisor . Please consider my analysis only for Education purpose .
USDJPY – Bullish Drive Toward Second Supply Zone (RTM Outlook)On the Daily structure, USDJPY remains bullish — and the current upward leg began from a key pivot, where price reacted to a QML level and broke its 1H descending trendline, giving strength to buyers and initiating this expansion.
Currently on the 4H, price is sitting inside the first supply zone: 156.900 – 157.200, which has already been tapped once. Buyer strength here is slightly weaker than the previous touch — but the bullish structure is still intact.
For that reason, my primary expectation remains continuation upward toward the second supply zone: 157.333 – 157.577.
That zone is where I will reassess – since that's where a true confrontation between buyers and sellers is more likely to determine whether a larger correction becomes meaningful.
On the 1H timeframe, price is already inside supply. Aggressive (reactive) traders might look for a CHOCH (Change of Character) inside the zone as a trigger to anticipate early correction — but for me, at this moment, I remain on the side of continuation until price reaches the second zone.
Right now, the most valuable action is simply watching how price behaves at the next zone, rather than predicting too early.
Updates will follow once price reaches that area — and that’s the moment where the real market decision will unfold.
`Pouryabdi

BTC - Weekly Analysis. Preparing to go down Big TimeOn weekly time frame, historically BTC made a Cup And Handle formation (Nov 2021 ~ Sep 2024) then reached its peak in Oct 2025 which is very close to the depth of the Cup.
Weekly trend line has been drawn (black) and the price has dropped below it.
Price is testing EMA 100 which becomes critical on weekly analysis. Classical Head & Shoulder pattern has been drawn (classical has right shoulder lower than left) which if followed will likely to give a big drop equal to the height of the Head (around $ 23,000).
But in doing so it will give opportunity to trade.
For LONG Trade, Buying around $74,000 ~ $68,000 region and selling off around $96,000 to $98,000. And then taking a SHORT Trade for a few months to enjoy good profits (expected by end Sep 2026 to mid Oct 2026).
Then again Taking LONG trade by Buying at $26,000 to $24,000 region and ride it till the top of $120,000.
Also note that there various Support zones are marked as well and price me stay there for a bit more than usual.
Disclaimer: Kindly do your own research first before getting in to trade.

Entry on a nice H & S pullbackThis stock pays a nice dividend and I want to build a pretty good position. I have some at $89 and see this is a really good spot to add.
GOLD (XAU/USD): Day Trading Setup for Today📈GOLD is currently consolidating within a horizontal intraday range.
Following a test of the channel's support, the price may continue to ascend towards its resistance.
As a confirmation, I observe a head and shoulders pattern formation.
Target - 4255

H&S Scenario on 4H | Jobless Claims could decideFX_IDC:XAUUSD H&S SCENARIO
Until Thursday morning, trader sentiment about another rate cut was around 80%-90% in favor, but the sentiment on the Gold price since the beginning of the week has been highly undecided 🤔 due to several economic data releases which were not strong enough to give Gold a clear direction.
Data: ( Actual | Forcasted | Previous)
Monday, December 1, 2025 🗓️
S&P Global Manufacturing PMI (Nov) 52.2 | 51.9 | 52.5 ⬆️
ISM Manufacturing PMI (Nov) 48.2 | 49.0 |48.7 ⬇️
ISM Manufacturing Prices (Nov) 58.5 | 59.5 | 58.0 ⬇️
Fed Chair Powell's speech omitted any important mentions of economic conditions or the rate cut process, focusing instead on the political processes surrounding the selection of a new Chair. 🏛️
Tuesday, December 2, 2025
CPI (YoY) (Nov) 2.2% | 2.1% |2.1% ⬆️
Wednesday, December 3, 2025
ADP Nonfarm Employment Change (Nov) -32K | 5K | 47K ⬆️
S&P Global Services PMI (Nov) 54.1 | 55.0 | 54.8 ⬇️
ISM Non-Manufacturing PMI (Nov) 52.6 | 52.0 |52.4 ⬆️
ISM Non-Manufacturing Prices (Nov) 65.4 | 68.0 | 70.0 ⬇️
U.S. President Trump Spokes about drugs and car costs mostly 🗣️
If the Gold price continues to decline past $4225 and reaches the Neckline support at around $4174 - $4179, then a further drop could send the price breaking through the Neckline and Gold could drop primarily to $4110, and secondarily down to the $4070 to $4020 mark. 📉
The Initial Jobless Claims announcement at 8:30 AM ET on Thursday, December 4, is expected to determine the next step for Gold and potentially provide a clear direction. 📰
If the actual Initial Jobless Claims figure is higher than expected, this could push Gold back toward the $4250 resistance level. ⬆️ Conversely, if the figure is lower, I anticipate the price will either fall or continue to trade sideways in the $4186 - $4225 range. ⬇️ ⚖️
The Initial Jobless Claims data may be ineffective in driving Gold's price due to the significant economic data releases scheduled for Friday, December 5. ⚠️
Core PCE Price Index (MoM) (Sep)
Core PCE Price Index (YoY) (Sep)
The technical analysis regarding the Head and Shoulders (H&S) pattern is primarily a trader-driven sentiment result. While it typically acts as a reversal signal following a recent uptrend, the pattern on higher time frames (such as the 4-hour chart) does not always offer a clear direction, and the price does not consistently follow its implications. Keep this in mind and monitor economic data releases closely.
My bias remains bearish until a clear market shift occurs.
Buy for Sell: $4200 - $4215
Late entry could be $4179 when Initial Jobless Claims look good.
Stop Loss: $4230
TP 1: $4167
TP 2: $4153
TP 2: $4116
TP 3: $4070
-------------------------------------------------------------------------
This is just my personal market idea and not financial advice! 📢 Trading gold and other financial instruments carries risks – only invest what you can afford to lose. Always do your own analysis, use solid risk management, and trade responsibly.
Good luck and safe trading! 🚀📊

Bulls Still in Control?Hello traders! Here’s an idea for AUDCAD based on current structure, trend, and momentum.
(This is market analysis, not financial advice. Always use proper risk management and seek additional confirmations before entering a trade.)
Intraday Buy Idea (short term move)
• Entry: 0.91500 – 0.91600
• Stop-Loss: 0.91350 – 0.91300
• Target Area: 0.91800 – 0.92000
⸻
Market Analysis
AUD/CAD continues to trade within a relatively modest daily range—typical for this pair—especially as we approach the end of Q4 and move deeper into the holiday season, when liquidity thins and price action often becomes more choppy and range-bound.
On the 4-hour chart, an inverted head-and-shoulders pattern has formed. The market recently closed above the neckline/right-shoulder zone, confirming potential bullish structure. A clean retest of this zone (around 0.91500-0.91600) could provide an opportunity to catch the continuation of the bullish momentum that began late last week (around Nov 21).
Our target—0.92000—lines up closely with November’s high and a key structural resistance level. If momentum remains intact, price could attempt another test of this area.
⸻
Fundamentals (per economic sources)
Australia (AUD)
• The RBA has kept rates steady, maintaining stability in the AUD.
• Commodity prices trending higher (especially metals) provide underlying support for the Australian dollar.
• A potential shift toward U.S. Federal Reserve rate cuts later on can indirectly support AUD through broader USD softness and risk-on flows. (per economic sources)
Canada (CAD)
• Canada’s manufacturing sector continues to contract, signaling broader weakness.
• While recent GDP growth was positive, the expansion was driven mainly by oil exports and government spending, not broad economic strength.
• Mixed and uneven economic performance may limit near-term CAD strength.
Combined, these factors support a slightly bullish bias for AUD/CAD in the near term, aligning with this technical setup.

EURUSD: double Scenario
Hello Traders,
this is the long-term channel!
We are truly in the way of more bearish days!
However, in the more natural timeframe we see a possible Head and shoulders!
I'm not a pattern trader! but sellers were not able to goes further than the HEAD!
So???
They are not strong enough! new buyers are in! may be a peace in Ukraine could alter it!
but I'm still more bearish for the term of my trade length! Although I aim to long after confirming the H&S and also breaking the latest strong level and breaking the bearish channel up!!

NVDA Head and Shoulders- Dec Rate Cuts has changed setupNvidia’s setup has shifted. With the Fed signaling a likely rate cut on December 10th, the market will start baking that optimism into asset prices ahead of time. When monetary conditions ease, high-valuation tech often gets an extra tailwind, which means the expected head-and-shoulders pattern on NVDA may fail to play out cleanly. The chart might still roll over, but the macro backdrop now works against a decisive breakdown. Short positions here demand caution.
Original post
Nvidia’s bear case rests on one core idea: the stock price assumes a flawless, world-eating AI future, and markets almost never deliver on “perfection narratives.” NVDA trades at extreme valuation multiples for a hardware-driven, highly cyclical business. Those multiples only hold if AI infrastructure spending keeps compounding at its current breathtaking pace for years. But that demand is dangerously concentrated in a handful of hyperscalers who are spending now and rationalizing later. Michael Burry’s recent argument sharpens this point: he claims true end-demand for AI horsepower is vastly overstated, and that much of the current GPU frenzy is a self-reinforcing loop of capital, hype, and accounting gimmicks rather than broad, organic need. If boards pause to question real ROI, or if the circular funding loop breaks Nvidia’s revenue curve can flatten quickly, dragging the valuation down with it.
Competition, long dismissed by NVIDIA bulls, is another structural headwind. AMD is now shipping accelerators that hyperscalers are actually integrating, and every major cloud provider is building in-house silicon to reduce dependence on NVDA’s margins. Even if Nvidia maintains leadership, it doesn’t need to lose the crown to lose the multiple, slight shifts in workload allocation or a handful of missed design wins are enough to pressure margins. And Burry’s critique deepens this point: he argues Nvidia’s reported profitability is flattered by depreciation assumptions and massive stock-based compensation that buybacks have failed to offset, meaning the “true” economic profit is less bulletproof than headlines suggest. Add to that the fact that U.S. export controls have effectively erased the China data-center market, once 20–25% of revenues and expectations of a seamless global TAM look increasingly unrealistic.
Technically, NVDA is doing exactly what a euphoric, overowned stock does when gravity starts tugging: momentum is fading, the price is slipping under short-term moving averages, and reactions to spectacular earnings have been strangely sluggish. That’s often the early signature of distribution rather than accumulation. And this lines up directly with Burry’s broader thesis: when a narrative becomes crowded and reflexive, the slightest wobble triggers violent air pockets. NVDA has become the ultimate proxy for the AI boom, the most crowded long in the market, meaning it’s the first thing funds sell when risk appetite cools, and the last thing buyers chase during corrections.
Put simply, Nvidia is a phenomenal company priced as if nothing can ever go wrong, while Burry is arguing that much of what looks “perfect” is not what it seems. The bear case isn’t that Nvidia collapses. It’s that the AI boom normalizes, competition accelerates, accounting realities catch up, margins slip toward something earthbound, and investors recalibrate how much they’re willing to pay. In that world, NVDA doesn’t need bad news to fall. It only needs the news to arrive slightly less euphoric than the fantasies currently baked into the price.
#NVDA #Bearish #HeadandShoulders #MichaelBurry
