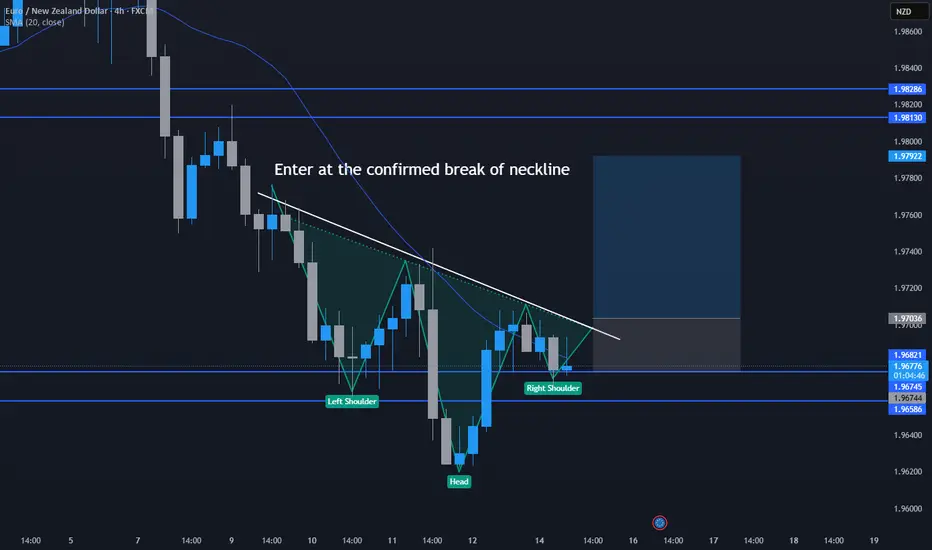
EURNZD Head and Shoulders Forming?A high probability head and shoulders has been forming on EURNZD. With the support area, this makes the setup a nice one. Wait for confirmed break then you can enter
Head and Shoulders
Yes the chicken man - PPC Short?PPC is at the bottom of a monthly box and at VAL of the daily and weekly anchored volume profile. It could catch a bid here and retest $45.60s(VPOC).
If the retest ends in a rejection of that area, and a daily close below the previous low around $41.95 then I expect short continuation and validation of the H&S.
I would especially like this trade after a retest and rejection of box bottom around $43.41 - $43.30.
My targets would be 40.11, 38.98, 37.27,35.96 then 33.72.

The Chicken man?? - Potential H&S Play on PPCGot bored and scanned the market for potential shorts. This is what I came up with. The put call ratio on this thing isn't very high but that could change if we see a shift in character price action wise. There is a daily head and shoulders, I've drawn my target(low 30s) on the chart.
Let's see what happens.
~The Villain

USDCAD Head & Shoulders forming.Price got rejected at the left shoulder at (1.38927 - 1.38758) and triggered a sell off followed by tight consolidation with rising trendline. Wait for price to break the rising trendline for Sell Entries to the Neckline at (1.37554 - 1.37221).

$MHKI - Inverted Head and Shoulder?So, the chart doesn't really show that it's forming an inverted head and shoulders pattern yet. But if you look at the moving averages, this stock is still above the 10 and 20 moving averages, which means it's still in a decent uptrend on the daily timeframe.
This could be a chance to make a speculative buy with the stop loss mentioned above!
Tradeplan:
Buy 159 - 156
Stoploss < 151

USDCAD Daily Head and ShouldersGoing into next week we have a nice head and shoulders pattern on the daily. This is also at a nice resistance level. We have recently broken out of a weekly channel so I think this will be the pattern we need to continue to the downside.

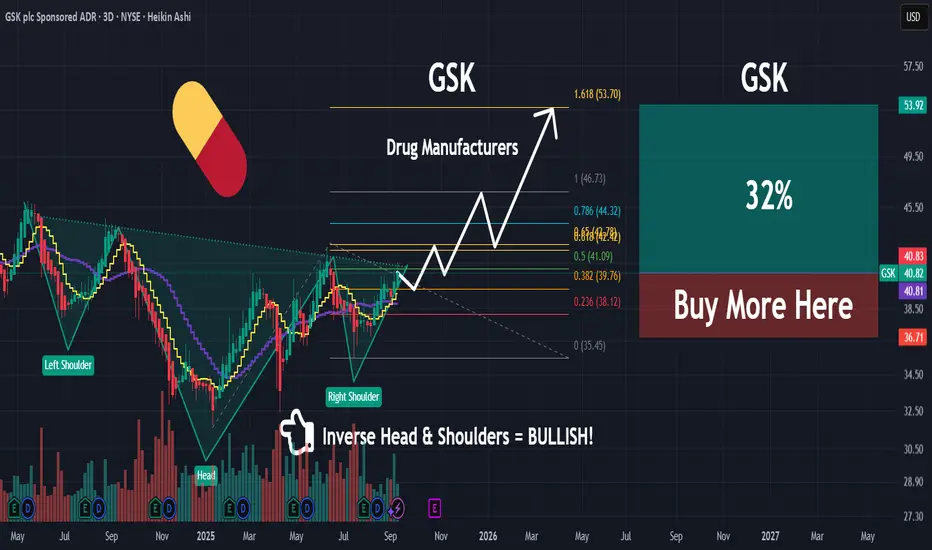
GSK | Powerful Move Going Into 2026 | LONGGSK Plc is a healthcare company, which engages in the research, development, and manufacture of pharmaceutical medicines, vaccines, and consumer healthcare products. It operates through the Commercial Operations, and Research and Development segments. The Commercial Operations segment has three product groups of specialty medicines, vaccines, and general medicines. The company was founded in 1715 and is headquartered in Middlesex, the United Kingdom.
MET | Life Insurance Industry Will Rise | LONGMetLife, Inc. engages in providing insurance and financial services to individual and institutional customers. It operates through the following segments: Group Benefits, Retirement and Income Solutions (RIS), Asia, MetLife Holdings, and Corporate and Other. The Group Benefits segment offers group life insurance products with renewable term policies. The RIS segment contains short and long-duration products, including capital market products, pension risk transfers, structured settlements, and other benefit funding products. The Asia segment focuses on Japan only and offers traditional life insurance, and accident and health products. The MetLife Holdings segment includes traditional and universal life products. The Corporate and Other segment refers to surplus investment portfolios used to fund capital and liquidity needs. The company was founded on March 24, 1868 and is headquartered in New York, NY.

BX |Bullish Momentum Incoming | LONGBlackstone, Inc. engages in the provision of investment and fund management services. It operates through the following segments: Real Estate, Private Equity, Credit and Insurance, and Hedge Fund Solutions. The Real Estate segment includes management of opportunistic real estate funds, Core+ real estate funds, high-yield real estate debt funds, and liquid real estate debt funds. The Private Equity segment consists of management of flagship corporate private equity funds, sector and geographically focused corporate private equity funds, core private equity funds, an opportunistic investment platform, a secondary fund of funds business, infrastructure-focused funds, a life sciences investment platform, a growth equity investment platform, a multi-asset investment program for eligible high net worth investors and a capital markets services business. The Credit and Insurance segment refers to Blackstone Credit, which is organized into two overarching strategies: private credit which includes mezzanine direct lending funds, private placement strategies, stressed and distressed strategies and energy strategies, and liquid credit which consists of CLOs, closed-ended funds, open ended funds and separately managed accounts. In addition, the segment includes an insurer-focused platform, an asset-based finance platform, and publicly traded master limited partnership investment platform. The Hedge Fund Solutions segment focuses on Blackstone Alternative Asset Management, which manages a broad range of commingled and customized hedge fund of fund solutions. It also includes a GP Stakes business and investment platforms that invest directly, as well as investment platforms that seed new hedge fund businesses and create alternative solutions through daily liquidity products. The company was founded by Stephen Allen Schwarzman in 1985 and is headquartered in New York, NY.

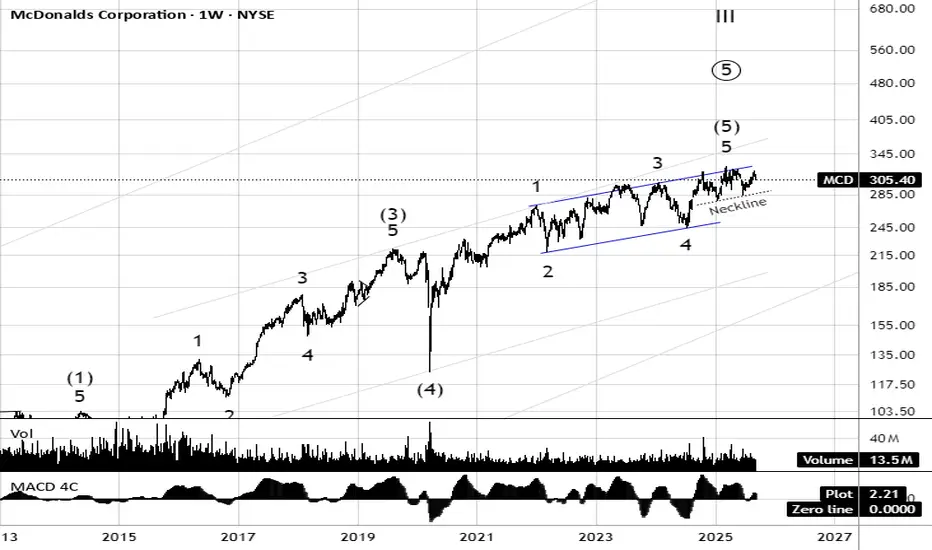
MCD produces ending diagonal to terminate 2020 advanceMcDonald’s (MCD) appears to be in the late stages of a long-term Elliott Wave advance, with the final 5th (5) wave nearing exhaustion inside a rising wedge pattern. Momentum divergences and the neckline support around $285 highlight growing risk of a breakdown. If the wedge fails, a corrective phase could unfold, targeting the 210–240 region where prior 4th wave support lies. Until then, upside is capped near $330–340, making the risk-reward skewed toward caution at current levels.
Aud bullish head and shouldersAudi’s bullish head and shoulders
Plus oscillators
The AUD/USD pair posts a fresh 10-month high near 0.6670 during the European trading session on Friday. The Aussie pair strengthens as the Australian Dollar outperforms its peers amid cheerful market sentiment. S&P 500 futures are marginally down during the European trading session, but gained 0.85% on Thursday.

Head and Shoulders Pattern on U.S. Dollar Index (DXY) – Bearish Overview of the Idea (as shown in the chart)
The chart illustrates a Head and Shoulders (H&S) reversal pattern forming on the U.S. Dollar Index (DXY). This classical technical pattern signals a potential trend reversal from bullish to bearish.
Left Shoulder: The first peak followed by a pullback.
Head: A higher peak, forming the top of the pattern.
Right Shoulder: A lower peak compared to the head, roughly equal to the left shoulder.
Neckline: A support line connecting the lows between the shoulders. Once broken, it indicates potential bearish continuation.
The chart highlights:
A breakout below the neckline.
A retest of the neckline (common in H&S setups, where old support becomes resistance).
A projected downside target aligned with the height of the head-to-neckline move.
Detailed Analysis
1. Pattern Identification
The H&S is clear: higher high (Head) flanked by two lower highs (Shoulders).
The neckline is slightly ascending, but once broken, it signals sellers stepping in.
2. Breakout Confirmation
Price broke below the neckline, confirming the bearish pattern.
The retest at ~97.62 shows rejection, strengthening the bearish outlook.
3. Bearish Projection
Technical rule: the expected downside target is approximately equal to the distance from the head to the neckline, projected downwards from the breakout point.
The chart projects a move toward 97.25, which aligns with the marked support zone.
Timing
The projection points to Monday, 15/09/25, suggesting this bearish move may unfold in the upcoming trading sessions.
Walkthrough Thought Process
Think of the market like a battle between buyers and sellers:
The buyers pushed price higher (Head), but then failed to sustain strength at the right shoulder.
When price breaks the neckline, it shows sellers are gaining control.
The retest confirms that what was once support (neckline) has now become resistance.
This setup gives traders confidence to enter a short (sell) trade, targeting the projected downside.
Trade Idea
Entry : After retest rejection around 97.62.
Target (TP) : 97.25 (support zone based on H&S projection).
Stop Loss (SL) : Above the right shoulder at 97.80 (to protect if pattern fails).

EURAud trendy bearish head and shoulders for the winEURAud gave a head and shoulders sell signal.
All technical indicators said sell and this paid off well
The Aussie pair strengthens as the Australian Dollar outperforms its peers amid cheerful market sentiment. S&P 500 futures are marginally down during the European trading session, but gained 0.85% on Thursday.

GBPJPY bullish head and shoulders with room to growGJ is showing very good upside potential. This is based on head and shoulders… gj needs room to run and is showing another head and shoulders up
a broadly weaker Japanese Yen on Friday. Market concerns about the political uncertainty in Japan are weighing on the JPY, pushing the pair Up!

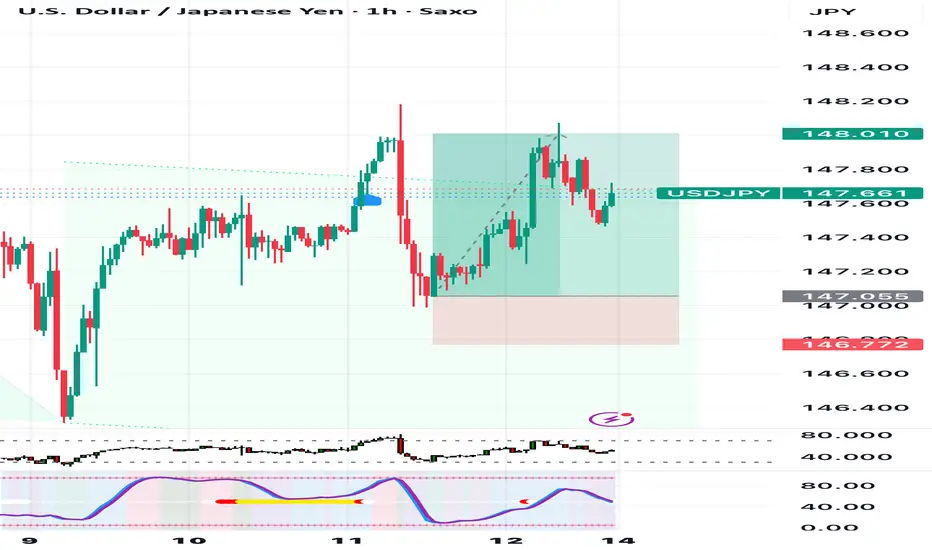
Usdjpy has been showing bullish head and shoulders buy patternsUsdjpy gave a technical bullish head and shoulders pattern, patience pays… waited for rsi to line up. And it matched fundamentals:
The US Dollar is regaining lost ground against a broadly weaker Japanese Yen on Friday. Market concerns about the political uncertainty in Japan are weighing on the JPY, pushing the pair to 187.90. From a longer perspective, however, the pair has kept trading sideways roughly between 146.00 and 149.00 since early August
DXY Correction to the UpsideThe much-anticipated pullback to the upside has started.
Remember, even though the overall trend is still bearish as seen by the bigger picture Head and Shoulders pattern I mapped out on H4 TF, we still projected this upside move as a retest of that main pattern.
Confirmations to long as seen on the H1 TF are this inverted Head and Shoulders and a break out and retest of the falling wedge.
Apply correlation to your dollar pairs and Gold.

Long Term Buy Position in GBPUSDICMARKETS:GBPUSD has completed Head & Shoulder on Daily Timeframe on 25th August 2025
In this trade, I will not follow any noise as it is a long term trade with high pips in Risk but even higher reward intact. I am waiting for this price action since one month but it is not triggering the cleaned Head and Shoulder's breakout at 1.3596.
I have placed a Buy Stop Order at 1.3596 with my SL at low of inversed right shoulder.
I will take two positions both at the breakout of right shoulder at 1.3596. Both position has 2% risk in total
Position 1 with 1 % Risk
Buy Stop: 1.3596
Stop Loss: 1.3388
TP: 1.3815
Position 1 with 1 % Risk
Buy Stop: 1.3596
Stop Loss: 1.3388
TP: 1.3815

Crvusdt buy opportunityCRVUSDT is forming a potential inverse head and shoulders pattern, with price approaching the neckline zone. The marked entry range offers a strategic buy opportunity for early positioning. A confirmed breakout above the neckline would signal strong bullish continuation, with the final target outlined on the chart. Let us know your thoughts on CRV.

$BTC The Correction is OVER - IH&S 50DMA Reclaim.VERY CONFIDENT THE ₿ITCOIN CORRECTION IS OVER 🤓
In other words, WE'VE SEEN THE SEPTEMBER LOWS.
Inverse Head & Shoulders reversal pattern closed outside of the Danger Zone and CRYPTOCAP:BTC reclaimed the 50DMA.

NZDUSD A Long BreakoutHello traders if follow my previous analysis on this pair we reviewed and predicted this breakout however the fundamental news today made the breakout possible. now we are looking forward to a long continuation.
Stay in touch
Like and follow up
thanks for reading

NZDUSDthis pair are in downtrent, we have a retracement to our fibo 50 and 60 zone and there we have good retracement also we have head and shoulder pattern, so might go down after this and in D timeframe we need to fill a cable and to go to our buy point 0.56600, GL...

BTC HEADING UP NORTHThere appears to be a breakout and retest of the inverse H & S on the DTF. Anticipate a pullback to the neckline and a bounce of the 4HTF with a bullish engulfing candle for an entry upward. Target $122,100 per coin.

GBPUSD SELL 1.3540On the hourly chart, GBPUSD has formed a head and shoulders pattern. Currently, attention can be paid to the resistance around 1.3540. If the rebound encounters resistance, consider shorting. The downside target is around 1.3460.
