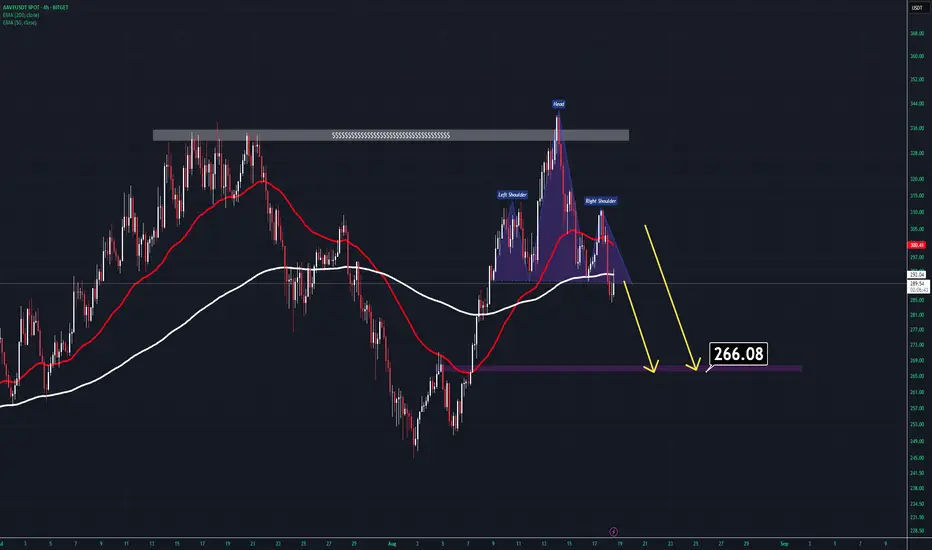
AAVE ANALYSIS (4H)After grabbing the upper liquidity pool, AAVE has shifted into a bearish structure.
Currently, the price is trading below both the 50 EMA and the 200 EMA.
Additionally, we can clearly identify a textbook Head & Shoulders pattern on the chart.
With these confirmations, AAVE remains bearish, and the downside target should be around $270 – $266.
Thanks for reading.
Head and Shoulders
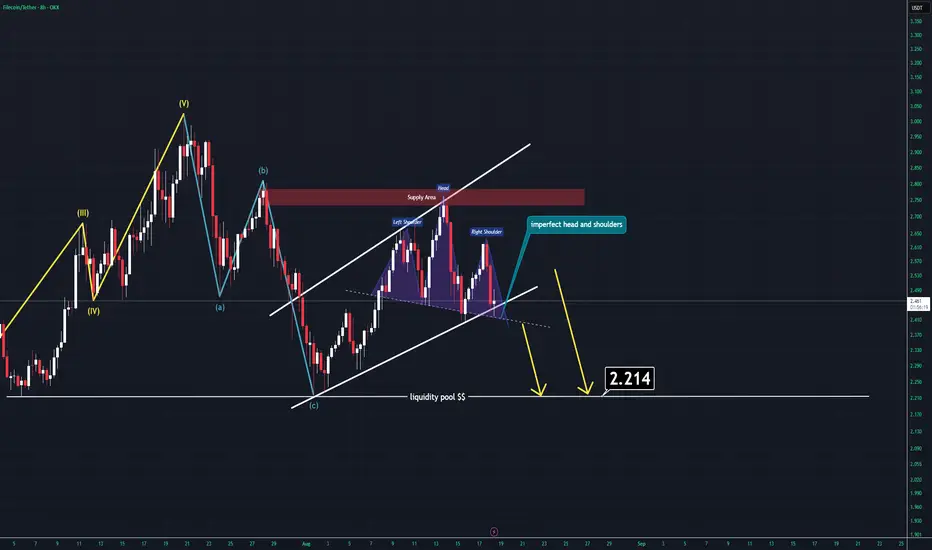
FIL ANALYSIS (8H)After hitting a major supply line, FIL has entered a corrective wave.
Similar to the other setups I shared earlier today, this one is showing very comparable price action. Currently, FIL is trading below all key moving averages (such as the 200 SMA and 50 EMA).
On top of that, an imperfect head and shoulders formation is in play. With the recent breakout, it seems likely that FIL will attempt to grab the lower liquidity pool, which sits around $2.2.
Thanks for reading.
UNI UPDATE (4H)After completing a five-wave impulsive move to the upside, UNI now appears to have entered a corrective A–B–C pattern.
Additionally, a head and shoulders formation has already broken down and been retested, further confirming bearish momentum. All signals currently point toward a downward continuation.
On the 15-minute timeframe, a mini bear flag has also formed, which strengthens this bearish outlook.
Good Luck.

USDT DOMINANCE UPDATEThe market is currently entering a well-anticipated minor bearish phase. Many altcoins have formed bearish price action patterns, and several indicators are signaling that a stronger downward movement may be imminent.
So far, the USDT.D chart has been very reliable, and its daily bearish outlook remains intact. Of course, the market cannot always stay bullish — a correction here is both expected and necessary to maintain balance.
As mentioned in my previous analysis, many alts are already starting to weaken. USDT dominance looks ready to break down a key trendline, which could trigger even more sell-offs. Keep an eye on the 4.50% level — this should be the first area to consider taking profits from short positions.
Bonus: This weekend, a significant amount of staked ETH will be unlocked. Once released, selling pressure is likely, which could lead to a sharp correction in ETH.
Good luck.

XAUUSDDon't get annoyed by what you see on youtube. Just follow your system. BTW, a system should not be difficult, but it only should consider market law's. cause and effect, effort vs result, supply and demand. That's all.

EURCHF: Strong Bearish PatternThe 📈EURCHF pair may experience further retracement from the identified daily resistance level.
A confirmed breakout below the neckline of the head and shoulders pattern would strongly indicate a bearish trend.
The nearest support level is situated at 0.9370.

BITCOIN (BTCUSD): Bullish Move From Support Confirmed
There is a high chance that BITCOIN will bounce
from a key daily support cluster.
An inverted head and shoulders pattern on an hourly
time frame provides a strong bullish confirmation.
Goal - 113840
❤️Please, support my work with like, thank you!❤️

Second Chance Setup – AUDUSD Bears Ready to Smash Supports
Last time, AUDUSD didn’t push lower as expected, instead making a false breakout / FVG sweep that trapped early sellers. But now, price action has given us a much stronger bearish confirmation.
On the 1H chart:
- A Head and Shoulders pattern has formed, signaling distribution.
- Price rejected from the FVG zone and failed to hold above the 200 EMA.
- The neckline has been retested , showing commitment from sellers.
This second chance setup looks more convincing than the first because momentum is clearly shifting toward the downside. My expectation is now for AUDUSD to extend lower toward 0.6456 , with further downside targets at 0.6422 and potentially deeper if sellers remain strong.
📉 Bias – Strong Bearish
📍 Key Resistance – FVG zone & neckline area
🎯 Target Levels – 0.6456 → 0.6422 → 0.6400

NZDUSD: Bearish Outlook Towards Key SupportWeekly Analysis
NZDUSD Weekly Analysis: Bearish Outlook Towards Key Support
On the weekly timeframe, NZDUSD continues to exhibit a protracted bearish trend, marked by a consistent pattern of lower highs and rejections from descending resistance levels.
Price has recently encountered and shown a strong rejection from the "Current Resistance" zone, confirming the prevailing structural weakness.
We anticipate a continuation of this downtrend, with the pair likely targeting a retest of the critical "Key Support" area around the 0.55000 level in the coming weeks and months.
This multi-year downtrend remains intact, favoring further depreciation of the Kiwi dollar against the USD.
Daily Analysis
NZDUSD Daily: Bearish Breakout Targets Lower Support
NZDUSD on the daily timeframe paints a decidedly bearish picture, currently trading within a well-defined descending channel.
Price has rejected the "Current Resistance" level and, more critically, has now definitively broken below the "Key Support Broken" zone that previously offered horizontal stability.
This breach signifies a shift in market structure, turning former support into new resistance.
We anticipate a potential retest of this broken support level before a continuation of the downtrend towards the "Key Support" zone around 0.55000-0.56000.
Disclaimer:
The information provided in this chart is for educational and informational purposes only and should not be considered as investment advice. Trading and investing involve substantial risk and are not suitable for every investor. You should carefully consider your financial situation and consult with a financial advisor before making any investment decisions. The creator of this chart does not guarantee any specific outcome or profit and is not responsible for any losses incurred as a result of using this information. Past performance is not indicative of future results. Use this information at your own risk. This chart has been created for my own improvement in Trading and Investment Analysis. Please do your own analysis before any investments.

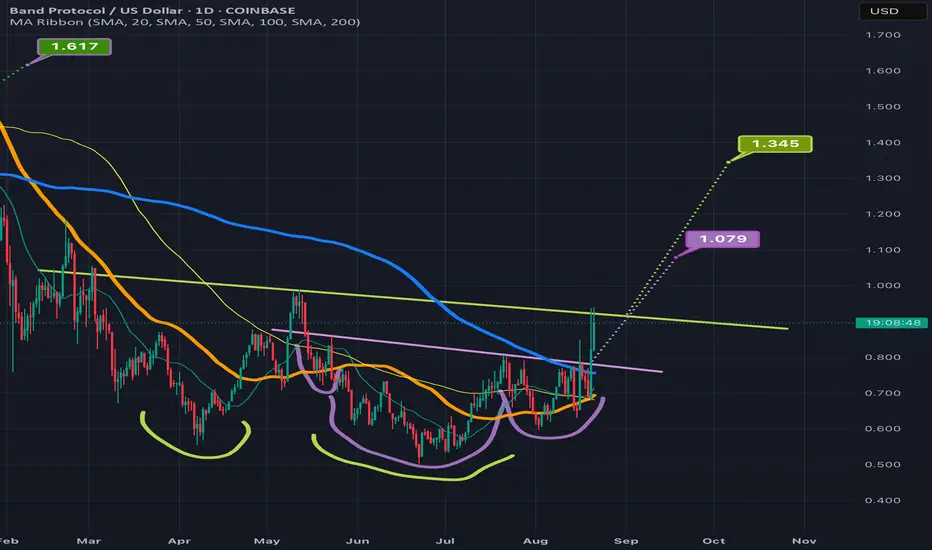
BANDUSD attempting an invh&s + double bottom breakoutBAND has been available for a significant iscount lately but the sale may be ending soon as it is now attempting both an inverse head & shoulders breakout, as well as sending wicks above the neckline of a slightly larger double bottom pattern. The double bottom pattern is in chartreuse and the inverse head and shoulder pattern is in lilac. We can also see BAND looks lke it’s about to have a golden cros in the next week or 2 which should increase probability to confirm the breakout of these two bullish patterns as it will add bullish confluence as long as prce action isn’t two high above the 30&200 moving averages at the time of the golden cross *not financial advice*
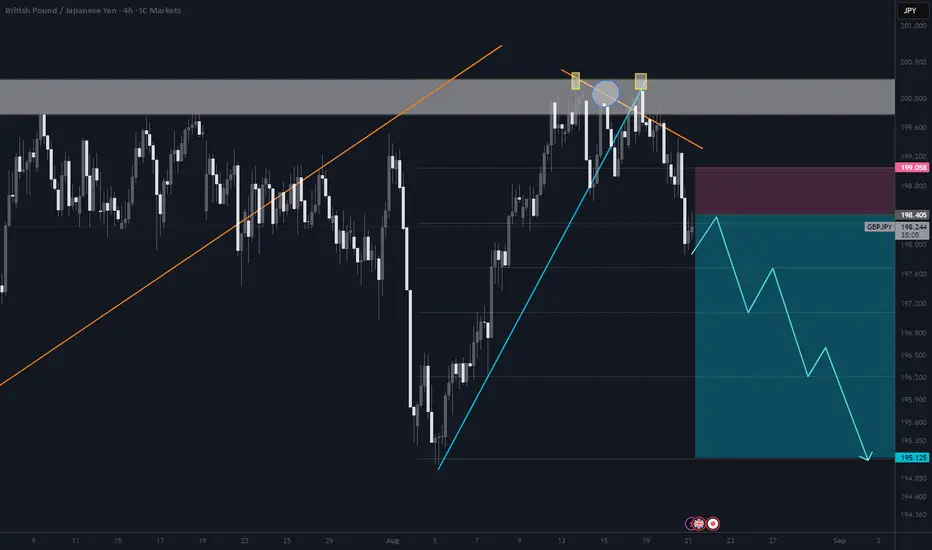
Downward movement after bouncing off Weekly/Daily time framesPrice has started to come downward and it has shown sign to move down and down. There is a clear Head and Shoulders pattern on 4H. Price is retesting before it goes down.
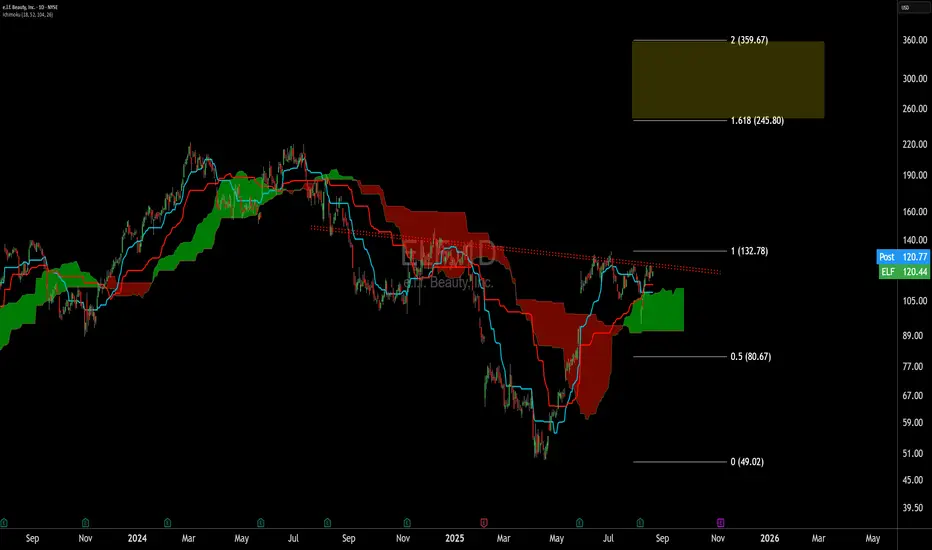
IHS Breakout PendingiHS - breakout reversal pattern
Entry: >neckline, >125
Exit: 1.618 fib to measured move, 250-350
SL: price in cloud, <110
AUDCHF - Head and ShouldersHello Traders!
The AUDCHF price formed a head and shoulders pattern.
Currently, the neckline is broken!
So, i expect a bearish move📉
____________
TARGET: 0.52050🎯

XAGUSD SELL 37.5On the 4-hour chart, XAGUSD formed a head-and-shoulders pattern before declining, indicating a short-term bearish trend. Currently, focus on resistance near 37.5. Consider shorting if a rebound is blocked. Focus on the previous demand zone of 36.2-36.7 below.

Sell Dow Jones (US30) – Elliott Wave & Chart Pattern OutlookThe chart applies Elliott Wave and pattern analysis on the Dow Jones (US30). Price has completed a large rounded bottom formation (Wave 4 to Wave 3 structure) and is currently consolidating within a contracting triangle pattern.
The market is testing resistance near 45,000.
A corrective wave count (A–B–C–D–E) suggests a possible short-term pullback toward ~43,000 before resuming the next impulsive rally.
If the triangle completes, the next major bullish wave could push US30 significantly higher, with a target above 48,000.
Key Levels:
Support: 43,000 → 41,865
Resistance: 45,000 → Breakout toward 48,000
This indicates a short-term corrective dip is possible, but the long-term bias remains bullish.

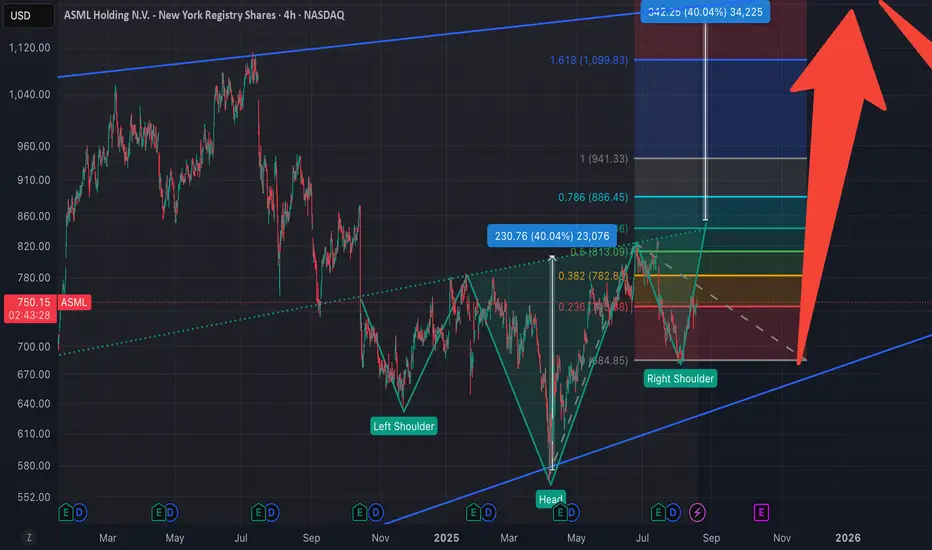
Multi-Month iHS Ready for BreakoutMega iHS has formed over the past 10 months.
Entry: Neckline Breach
Exit: Fibs, MM, 51-55k
SL: LL, <43k
NFA

NZDCHF - Head and ShouldersHello Traders!
The NZDCHF price formed a head and shoulders pattern.
At the moment, the neckline is broken!
So, I expect a bearish move📉
_____________
TARGET: 0.47660🎯

Is This a Head and Shoulders Bottom?Based on the conjecture, the right shoulder is about to form. The head and shoulders bottom pattern will only complete upon a breakout above 840. If the price falls below the previous low (approximately 680), the conjecture fails. The projected rise from the head and shoulders bottom roughly aligns with the overhead resistance levels. The long-term chart pattern appears more like a wedge.
Short-term support : 68x
Short-term resistance : 84x
Target levels : 84x, 94x, 11xx
Long XAU, Inveted Head and Shoulder
Wishful thinking for an inverted Head and Shoulder on Gold.
1 Hr
Just before the New York Session

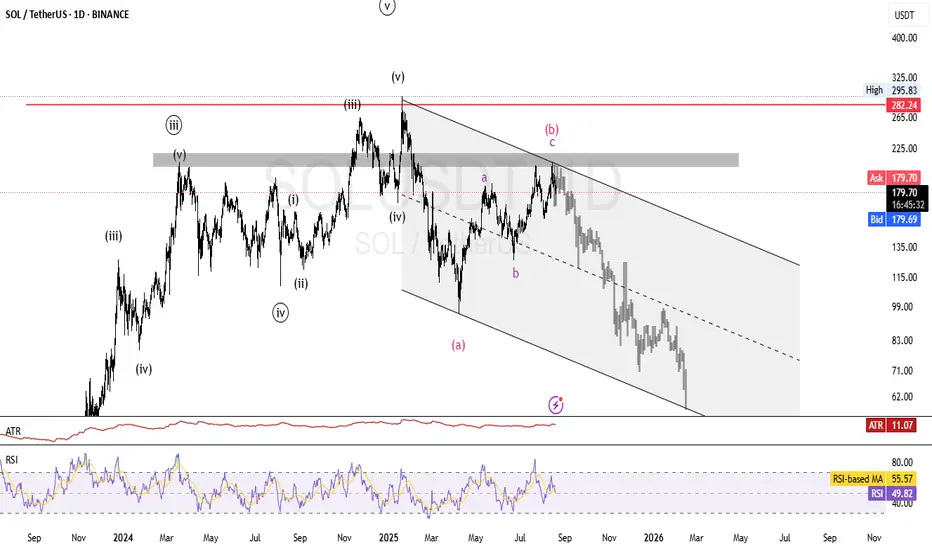
SOLUSDT: Elliot waves Analysis Hello. As you can see in the Solana chart, the analysis is based on Elliott waves in the long term. This is only a perspective and cannot be the basis for trading, but it seems that after reaching the deadline area, we can expect a continuation of the correction for wave C. So keep this perspective in mind, as it is possible.
Doge H&S is it all over?Potential head & Shoulders printed on Doge. Is it all over for its massive rally up? ETH and BTC drop more, This is play out unfortunately. Buyers need to hold support!

GBPCHF: Strong Bearish Pattern 🇬🇧🇨🇭
GBPCHF may retrace more from the underlined blue daily resistance.
A breakout of a neckline of a head and shoulders pattern that
occurred on Friday provides a strong bearish confirmation.
Closest support - 1.09
❤️Please, support my work with like, thank you!❤️
I am part of Trade Nation's Influencer program and receive a monthly fee for using their TradingView charts in my analysis.

Reversal in sight on UJLook I am not trying to convince anyone to follow this, I am just sharing this idea so that you may also consider this possibility that UJ might tank to 143. Always good to know "why?" right?
