Long Term Buy Position in GBPUSDICMARKETS:GBPUSD has completed Head & Shoulder on Daily Timeframe on 25th August 2025
In this trade, I will not follow any noise as it is a long term trade with high pips in Risk but even higher reward intact. I am waiting for this price action since one month but it is not triggering the cleaned Head and Shoulder's breakout at 1.3596.
I have placed a Buy Stop Order at 1.3596 with my SL at low of inversed right shoulder.
I will take two positions both at the breakout of right shoulder at 1.3596. Both position has 2% risk in total
Position 1 with 1 % Risk
Buy Stop: 1.3596
Stop Loss: 1.3388
TP: 1.3815
Position 1 with 1 % Risk
Buy Stop: 1.3596
Stop Loss: 1.3388
TP: 1.3815
Head and Shoulders

Crvusdt buy opportunityCRVUSDT is forming a potential inverse head and shoulders pattern, with price approaching the neckline zone. The marked entry range offers a strategic buy opportunity for early positioning. A confirmed breakout above the neckline would signal strong bullish continuation, with the final target outlined on the chart. Let us know your thoughts on CRV.

$BTC The Correction is OVER - IH&S 50DMA Reclaim.VERY CONFIDENT THE ₿ITCOIN CORRECTION IS OVER 🤓
In other words, WE'VE SEEN THE SEPTEMBER LOWS.
Inverse Head & Shoulders reversal pattern closed outside of the Danger Zone and CRYPTOCAP:BTC reclaimed the 50DMA.

NZDUSD A Long BreakoutHello traders if follow my previous analysis on this pair we reviewed and predicted this breakout however the fundamental news today made the breakout possible. now we are looking forward to a long continuation.
Stay in touch
Like and follow up
thanks for reading

NZDUSDthis pair are in downtrent, we have a retracement to our fibo 50 and 60 zone and there we have good retracement also we have head and shoulder pattern, so might go down after this and in D timeframe we need to fill a cable and to go to our buy point 0.56600, GL...

BTC HEADING UP NORTHThere appears to be a breakout and retest of the inverse H & S on the DTF. Anticipate a pullback to the neckline and a bounce of the 4HTF with a bullish engulfing candle for an entry upward. Target $122,100 per coin.

GBPUSD SELL 1.3540On the hourly chart, GBPUSD has formed a head and shoulders pattern. Currently, attention can be paid to the resistance around 1.3540. If the rebound encounters resistance, consider shorting. The downside target is around 1.3460.

BTC Inverse Head and ShouldersThe chart clearly shows an inverse head and shoulders formation:
Left Shoulder: ~Aug 26 low.
Head: ~Aug 29 low.
Right Shoulder: ~Sep 5-7 low.
This is a bullish reversal pattern after a prolonged downtrend. The breakout above the neckline (around 113,200 – 113,500) confirms the bullish bias.
Fib & Extension Targets :
Immediate target: Fibonacci 1.0 extension ~119,600.
Extended target: 1.618 extension ~123,500.
These align well with previous resistance levels (early August highs).

DXY Head and Shoulders Retest H4Change of bias on DXY - if the current bounce of price in support is a retest of this H&S pattern then we may see prices fall to the 94 - 95 region.
NB: the upward-facing arrow is just a rough estimation of the retest target. Prices may fall from a much lower level than that.

SHORT TERM DOW - REVERSE (H & S ) PATTERN FORMATION🔹 Pattern Observed
The chart shows a reverse Head & Shoulders (H&S) attempt.
Left shoulder, head, and right shoulder are marked clearly.
But note: written that “8 out of 10 times H&S fails”, which is important — H&S is powerful, but also prone to false breakouts. AND FALSE BREAKOUT ITSELF IS VERY STONG SETUP!5
🔹 Short-Term Technical View
Structure:
Price attempted to form an inverse H&S, but neckline is not yet broken decisively.
Instead of breakout, Dow is showing weakness near the right shoulder.
Bearish Bias Active:
Failure of the reversal pattern often triggers sharp declines (trapped longs exit).
Breakdown projection is already plotted on your chart.
Target Zone:
Immediate downside target highlighted = 41,125.
That’s consistent with measuring the depth from head to neckline and projecting downward.
Invalidation:
If price reclaims and sustains above the neckline (~45,000–45,200 zone), the bearish view weakens.
🔹 Short-Term Trading Implication
Bias: Bearish as long as below neckline.
Target: 41,125 (short-term).
Stops: Above neckline (45,000+).
R:R: If entered near 44,600–44,800, reward to risk is favorable (2.5:1+).
✅ Conclusion
The Dow shows a failed inverse H&S, which typically results in downside continuation. Short-term target is 41,125, with risk managed above 45,000.
⚠️ Disclaimer:
This analysis is provided purely for educational and informational purposes only. It is not investment advice or a recommendation to buy, sell, or hold any security, index, or derivative. Trading carries significant risk of loss and may not be suitable for all investors. Please do your own due diligence or consult with a registered financial advisor before making any trading or investment decisions.

Inverse Head And Shoulder playing! Just wait for neckline break and Hold
😃 Already broken neckline we are seeing
But need some closings above will be more strong and good,
LFG 🚀 🚀 🚀 🚀


#RIOT and the miners pumping = AltseasonThe Bitcoin miners have quietly entered a Bull market since April, without much attention.
This indicates that investors are looking for additional risk beyond #BTC as they prepare for an exciting Altseason.
Their reasoning might arise from the perception that Bitcoin can provide only a limited return going forward based on its current point in the cycle and the outsized returns it has already delivered over $100K+ per coin from the low 3 years ago.
As you can see, RIOT has recently broken out of an inverse head and shoulders pattern against Bitcoin dominance.
Historically, when this pattern has emerged in the previous two cycles, the logarithmic target has been achieved and even exceeded, coinciding with strong altcoin performance.
We have much to look forward to in the upcoming months.

AUDJPY: The Last Gap Setup! I Promise... 🇦🇺🇯🇵
Those who have recently joined my group may think that I only trade the gaps.
That is not the case at all because good gaps are relatively rare.
Each time they form, I am trying to get maximum from them.
The last one that I wanted to share is a nice gap up on AUDJPY.
With a bearish London session opening, I think that this gap is going
to be filled soon.
Goal - 96.75
❤️Please, support my work with like, thank you!❤️
I am part of Trade Nation's Influencer program and receive a monthly fee for using their TradingView charts in my analysis.

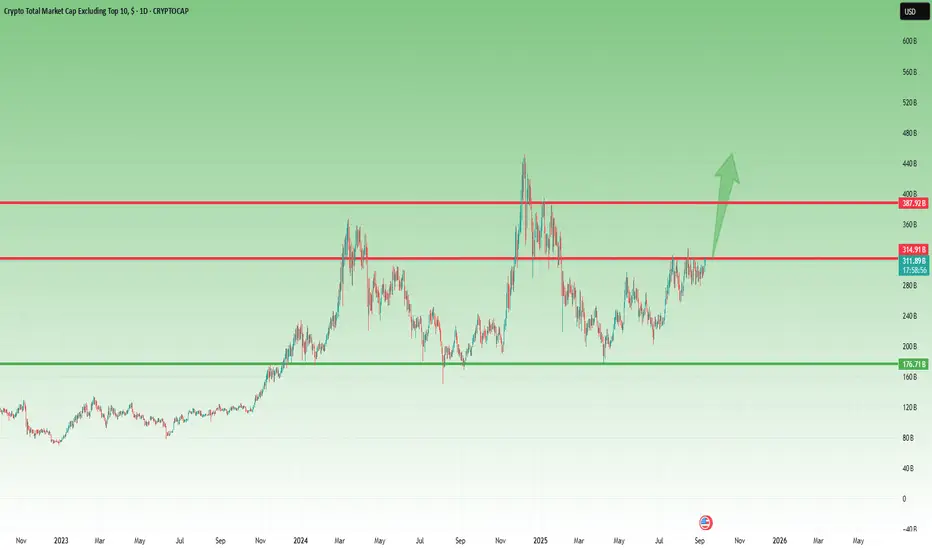
Smaller alts, a constructive outlookThe Big Question: Will We Finally See Moves on Alts?
The past month – or rather the past 6 weeks – has been nothing short of frustrating for altcoin traders. Most individual charts looked stagnant, choppy, or simply lacked momentum. But zooming out to the Total chart, the picture is much clearer, and the answer looks like a confident YES .
What the Chart Tells Us
• After the December 2024 top, we witnessed a deep correction, which finally bottomed on 7 April, during the infamous tariff mania .
• From there, an initial leg up developed, reaching resistance around the 300B mark.
• The correction that followed was healthy: it established a higher low, confirming that the bottom was not just a dead cat bounce.
• The next attempt pushed even deeper into resistance, creating a higher high – a strong bullish sign.
• Since the end of July, things have turned even more interesting: the market has been pressing hard into resistance, and we could even argue the formation of a continuation Head & Shoulders setup.
Where We Are Now
At the time of posting, the Total chart is testing resistance at ~310B once again. The more this level gets tested, the weaker it becomes. A breakout from here doesn’t just look possible – it looks almost unavoidable .
What to Expect Next
When that resistance finally breaks, the tension built up over months of sideways action – and the frustration of traders who have been waiting for more than half a year – will likely unleash a strong acceleration.
In my view, we could easily see a 50% rally, taking the Total chart back to the December 2024 highs.
🚀 The stage is set. All that’s missing is the trigger.
Build-A-Bear WorkshopClassic ChartWizards setup. NYSE:BBW
ChartWizards first reported on NYSE:BBW around $22 back in 2022, buying the clean Head & Shoulders FAILURE breakout that most ignored.
Since then, BBW has been one of the most consistent secular uptrends we’ve tracked, grinding higher through 2023–24 with textbook pullbacks and measured breakouts. In mid-2025 we flagged the move through $38 as a fresh all-time high and a technical validation of our multi-year bullish stance. Fast forward to September 2025, and the stock has exploded to $71, a more than 3x move from entry.
I’ll say it again: I’m biased, but I don’t think anyone has covered this name better than we have. This is the kind of chart that defines what Chart Wizards is all about.

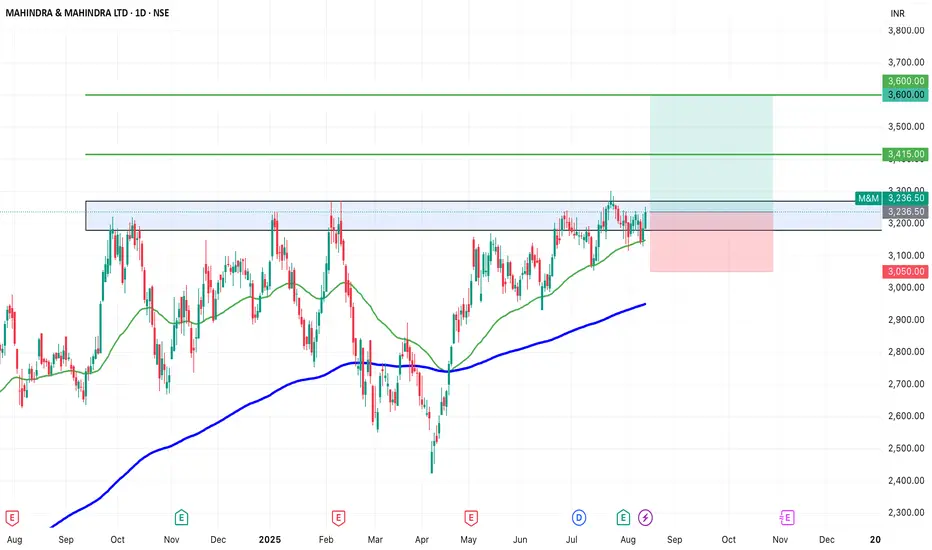
SWING IDEA - M&MM&M , a leading Indian automotive and farm equipment manufacturer, is showing signs of a potential breakout, making it a strong swing trading candidate.
Reasons are listed below :
3,200 resistance tested multiple times — now weakened and primed for a breakout
VCP (Volatility Contraction Pattern) forming, indicating accumulation
Trading above 50 & 200 EMA, confirming long-term trend strength
Inverse Head & Shoulders pattern forming, a bullish reversal setup
Target : 3415 // 3600
Stoploss : daily close below 3050
DISCLAIMER -
Decisions to buy, sell, hold or trade in securities, commodities and other investments involve risk and are best made based on the advice of qualified financial professionals. Any trading in securities or other investments involves a risk of substantial losses. The practice of "Day Trading" involves particularly high risks and can cause you to lose substantial sums of money. Before undertaking any trading program, you should consult a qualified financial professional. Please consider carefully whether such trading is suitable for you in light of your financial condition and ability to bear financial risks. Under no circumstances shall we be liable for any loss or damage you or anyone else incurs as a result of any trading or investment activity that you or anyone else engages in based on any information or material you receive through TradingView or our services.
@visionary.growth.insights
BTCUSDT 4HBTC Update – Inverse Head & Shoulders in focus
On the 4H chart, a clear Inverse Head & Shoulders pattern has formed.
The neckline has already been tested and broken to the upside – a classic bullish signal.
📊 Key Levels:
Support zone: $111,193 – $110,500 (right shoulder area)
First realistic target: 200 EMA at $112,744
Next level: Break above $113,500 → potential to close the CME Gap at $116,887
Target zone based on iH&S: around $117,000 → Premium target in the yellow box: $117,841 – $119,900
⚠️ Risk:
If BTC falls below the right shoulder (~$109,200), the pattern becomes invalid, increasing the likelihood of another dip towards 107k – 105k.
✅ My View:
As long as BTC holds above 110–111k, the setup remains strongly bullish. A retest of the neckline would even be healthy before the next push upward."

GBPUSD Head and Shoulders Pattern|Daily SupplyI posted this exact same setup for GU almost a month ago and I stated that as long as this daily supply holds, I remain bearish.
Not much has changed since then. Price has just been consolidating around the same zones. Same but opposite of DXY.

Trade Idea for the XAUUSD | Short-term SellingXAUUSD Trade Idea after a long time.
After a series of bullish movements, I am now looking to short the currency pair.
Just spotted a quick 4H Bearish - Head & Shoulders pattern, looking forward to the multiple timeframe analysis.
I will also share the entry position once the price moves in the desired direction, which is Downward.
Let me know about your opinions in the comments section down below...
Thank you and many regards,
OANDA:XAUUSD

CELH | Triple Digit Gains IncomingCelsius Holdings, Inc. engages in the development, marketing, sale, and distribution of functional drinks and liquid supplements. It also offers post-workout functional energy drinks and protein bars. The company was founded in April 2004 and is headquartered in Boca Raton, FL.

Zydus Lifesciences – Weekly Breakout Watch, Targeting 1,200Chart Context (Weekly)
Multi-year horizontal resistance around 1,020 tested repeatedly since 2022.
Strong weekly candle now approaching this zone with above-average volume (7.15M vs 5.01M).
RSI climbing ~60, momentum building without overbought conditions.
Setup
Base formation since late 2024 after a deep correction.
Breakout above 1,040 on a weekly close confirms structural reversal.
Measured move from base points to ~1,200 (~20% upside).
Levels
Breakout trigger: Weekly close > 1,040.
Upside potential: 1,150–1,200.
Risk management: Structure invalid below 960.
Bias: Medium-term swing; breakout confirmation needed for follow-through.
Disclaimer: This analysis is for educational purposes only and does not constitute investment advice. Please do your own research or consult a financial advisor before making trading or investment decisions.

What will bitcoin do next?Based on my analysis, bitcoin currently retested 110200.
Price will visit 114400 before a retest of support at 112000…
Price will then pump from 112000 to 115500 and then 117500 before dropping to find support again
