GOLD:head and shoulder breakdown Gold is moving aggressively in last month
It crosses over round number 4000
It could not sustain and formed a M pattern or double top pattern above round level 4000 in smaller timeframe. Collapsed below 4000 yesterday
Now it is treding near the head and shoulder neckline near 3945
Any break of this level could slip the gold price by 100 dollers @3850 zone
Beawar of dynamic support ema 21 around 3860
SL and target mentioned in the chart.
A 1:8 RR
Trade with psychology and monoy management
Educational purpose only
Head and Shoulders

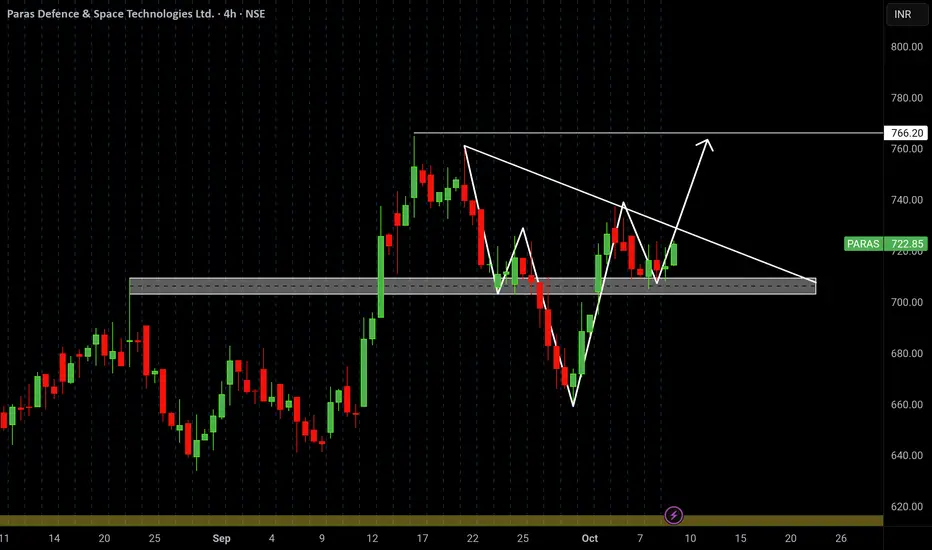
Paras DefenceThe chart is bullish biased as long as the price stays above the ₹705–₹710 zone.
Watch for a breakout above the trendline (~₹730) for potential entry.
If breakout sustains, ₹766 becomes a logical short-term target.
Eth is ready to fallEth is ready to fall, eth is forming head and shoulder pattern and ready to fall in short term

USDCNH Inverse Head and Shoulders PatternUSDCNH is forming inverse H&S after finding support from major level.
Wait for the price to break the 7.15 level and establish above to enter.
SL at 7.08

inverse head and shoulder buildingi dont see the problem?
ethereum has hit the long term channel bottom that been lasting since april on 25 sept $3840.
After hitting this bottom ethereum has rallyed 24%.
now ethereum is taking a breath of that rally and is nearing the $4276 support zone wich is also the 0.5fib zone.
i expect ethereum to find support here or a little above as we are in the golden fib zone.
even if the 0.5 fib zone does not hold we still have the 0.61 fib zone wich is also at the bottom of the channel again.
if we find support at the 4260 zone we are also at the bottom of the left shoulder of the inverse head and shoulders forming.
if we reverse there we are looking at another jump back to the 4750 zone and then watching for a inverse head and shoulders breakout wich has a target of psychological level $6000

USDCHF – A Slow Mover Showing Big Signs of ReversalAlthough USDCHF is not the most volatile pair out there, it has been on my radar lately — especially after printing a low near 0.78, a level unseen since 2011.
Since June, the overall price action has been suggesting that we are approaching a major bottom. As shown on the daily chart, a falling wedge has developed over the past four months — a pattern that typically signals the end of a downtrend.
If we look closer, there’s even an argument for an inverted Head & Shoulders, with a descending neckline connecting the previous lower highs.
After the latest dip to 0.78, the pair bounced strongly, touched the neckline, and then consolidated for a few sessions — forming what looks like the right shoulder with a higher low structure.
Yesterday, USDCHF finally broke above the falling trendline, confirming the breakout. At this point, the odds favour a medium-term reversal.
• 🎯 First target: 0.8170 zone
• 🚀 Medium-term target: 0.83 area
That being said, my plan is simple:
→ Buy dips near 0.80 or slightly under, aiming for a 1:3 risk-to-reward setup.
The structure looks strong, the momentum shift is visible, and the timing couldn’t be better for a potential reversal.

Usdchf longUsdchf long position
Support level
Head and shou Pattern
Don’t forget your money management

USDCHF BUY 0.8000On the 4-hour chart, USDCHF has formed a head-and-shoulders bottom pattern, indicating a short-term bullish trend. Currently, support around 0.8000 is a concern, with an upward focus on the 0.8090-0.8103 area.

Inverse Head & Shoulders (NZD/JPY)Setup: possible long term bottom and bullish trend reversal
- inverse head and shoulders (pattern incomplete)
Signal:
A) At current breakout
B) Buy on gap fill during pullback
Nornally I follow trends - but seems like FX market bottoming out in several places...
Is this a bottom? or trend still lower, and better sell?


DXY – The Road to 100 Looks ClearIn my previous analysis on DXY, I mentioned that as long as the 97.60 zone holds, there are strong chances for an upside move and a possible test of the 100 level.
Indeed, the index reversed perfectly from that support area and has now broken above the interim resistance around 98.60, trading close to 99 at the time of writing.
Over the last three sessions, DXY has also completed an inverted Head & Shoulders pattern, with the neckline breakout confirming the bullish structure.
From here, the path toward the 100 zone appears clear and technically justified.
I maintain a bullish bias for the U.S. Dollar Index, which naturally implies a bearish outlook for EURUSD and GBPUSD in the short term.

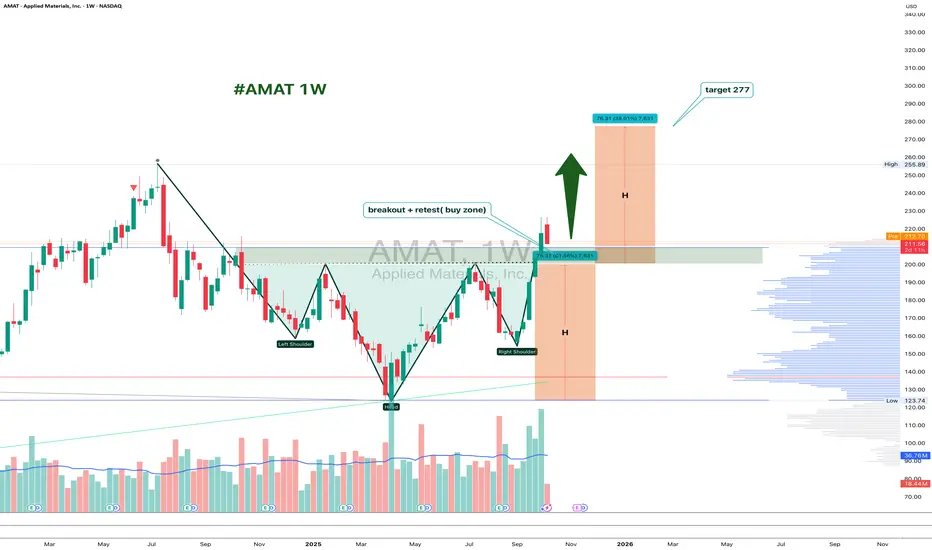
AMAT 1W: Retesting the Neckline Before the Next Move?On the weekly chart, Applied Materials (AMAT) has completed a clean inverted head and shoulders breakout around $226, and is now pulling back to retest the neckline zone near $200–211.
This area acts as strong support. If buyers defend it, the bullish pattern stays valid, with a projected target around $277, matching the 1.618 Fibonacci extension.
From a fundamental perspective, AMAT remains a key semiconductor player, benefiting from ongoing demand for chip-making equipment. The pullback looks more like a healthy pause than weakness - a classic chance for latecomers to re-enter.
Funny enough, the “head and shoulders” pattern, known for signaling tops, is doing the exact opposite here - apparently, even the market likes a good plot twist.
Bullish DXYPotential Inverted Head and Shoulders display.
Am very Bullish on USD Index right now and Bearish on most xxx/USD pairs.

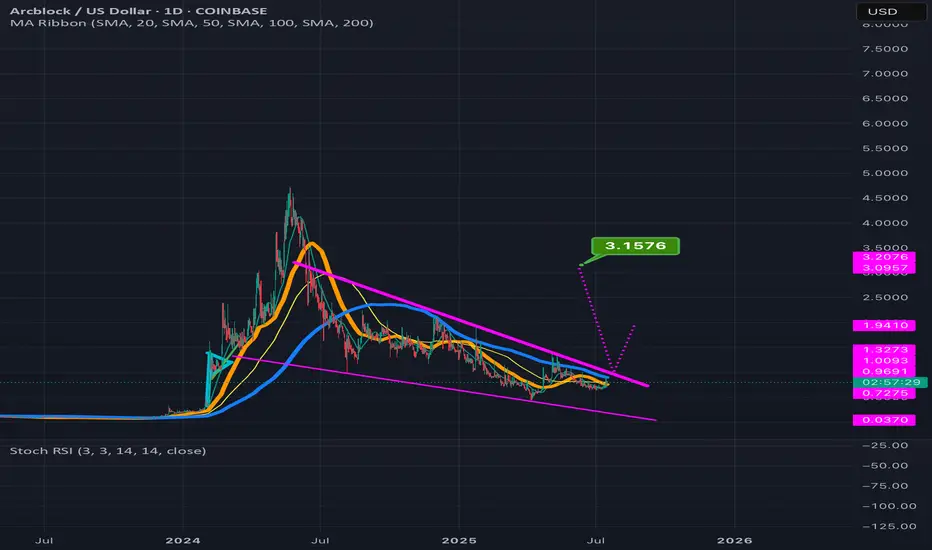
ABT can potentially 4x in value reading up from the wedge its inThe smaller pink dotted measured move line is for the inv h&s pattern its formed inside the wedge with the top trendline of the wedge doubling as the invh&s pattern’s neckline. Hitting that smaller target is more or less a 2x from current price action. If we hit the full falling wedge target that’s a 4x from where it is currently. *not financial advice*
Short - AMDTime period for this play : week to months
Analysis : Elliot wave 12345 ABC. Expect hitting .618 and bounce back up to go higher.
Pattern if wave B completed : Head & Shoulder
Price Target: Wave ABC
ETA Timeline for correction. Please refer to the chart.
Upcoming events:
Tariff active on 8/1/25 - Friday
Earning on 8/5/25 - Tuesday
Top is not in yet, so 2 Possible top-in levels:
Top 1 - $163.45 : Retesting to hit 163.45, rejected, and break $158
Top 2 - $173.94 : Breaking 163.45 and reject at 173.94
=> Overall, It begins trading side way and show some weakness now.
The correction may not pull back to .618, which is the best level. Other scenarios:
- 0.5 fib, where it test wave 3
- 0.328 fib, strong bullish level if it doesn't break & go to the upside faster

Meta platforms, D ( Channel + 2 Fibonacci Extensions up & down )Hey Traders and Investors, I hope you all are doing well in your life.
market is nature's response and Price is the God .
Let's check the market with the help of natural levels tool : Trend Based Fibonacci Extension in addition with Trend Channel .
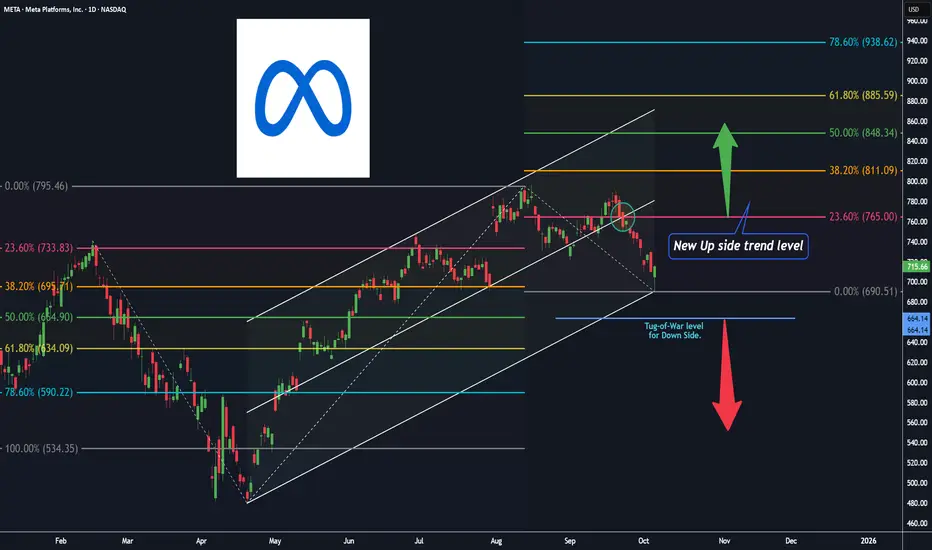
After forming almost a ' Head and Shoulders ' pattern on Daily chart, Meta platforms has given a pull-back ( base for Fib-Extension UP level tool on the right side , $690.51 ).
The Pull-back trend expect to continue till the retest level of 23.6% ( $765 ) of Fib-Extension UP level tool on the right side .
The most near level for the re-test is the 50% level ( $664.14 ) of Fib-Extension Down level tool on the left side , for a new UP trend Entry ( investors ).
Note: The marked Circle ⭕ enclosed candle is the important level candle, Up Trend channel's 50% trend line is intersecting with 23.6% of Fib-Extension UP level tool on the right side .
Keep on checking this Level for your future trading decisions.
" Buy 🟢 "above $731 with the stop loss🔻of $690 for the
🎯 Target 1: $765
🎯 Target 2: $811
🎯 Target 3: open.
" Sell 🔴 " below $664 with the stop loss🔺of $690 for the
🎯 Target 1: $634
🎯 Target 2: $590
🎯 Target 3: open.
Smart Levels is Smart Trading 👨🎓
⚠ RISK DISCLAIMER :
All content provided by "TradeWithKeshhav" is for information & educational purposes only.
It does not constitute any financial advice or a solicitation to buy or sell any securities of any type. All investments / trading involve risks. Past performance does not guarantee future results / returns.
Always do your own analysis before taking any trade.
Regards :
Team @TradeWithKeshhav
Happy Trading and Investing!
AUDJPY | Inverse Head & Shoulders at Channel SupportAUDJPY is attempting to carve out an inverse head and shoulders pattern near channel support. The left shoulder, head, and right shoulder are in place, but a neckline break is still required for confirmation. Until then, the broader down-channel remains intact. A sustained close above the neckline could open the door to a shift in momentum, while failure keeps pressure on the downside.

Reversal in progress?Is NESF starting to complete the Head phase of an inverse H&S pattern?
Still no end to the downtrend yet.
Probably need to wait another 12 months to see.
If the BOE further reduce interest rates, this will help its cost of capital.

MPWR 1D: shoulders are squared and the battery's still fullMonolithic Power Systems broke out of a long-term descending trendline after completing a clean inverse head and shoulders. Now the price is pulling back into the 705–688 zone — a textbook retest area that combines the neckline, the 0.705–0.79 Fib levels, and a major volume shelf. Add to that a golden cross (EMA50 crossing EMA200 from below) and we have a solid technical foundation for continuation. Volume on the pullback is low, indicating no panic, just rotation. If 688 holds, the next levels to watch are 755.66 and 952.17 — the latter being the 1.618 Fib extension. Tactical setup: look for a reversal signal between 705–688, with a stop just below 661. As long as price holds this zone, the bullish structure remains intact.
Fundamentally, MPWR remains one of the strongest names in the semiconductor space. With over $1.5B in annual revenue and industry-leading margins, the company continues to see strong demand from data center and EV sectors. In its latest report, management highlighted accelerating orders from Tier‑1 manufacturers. The balance sheet is clean, with zero debt, and ongoing buybacks provide downside support. In a sector full of volatility, MPWR stands out with both structural reliability and technical clarity - making it a strong candidate for long-term positioning.
If this textbook pattern plays out, the train’s just leaving the station. The best seat is usually the one taken before the doors close.

AMD - Inverted Head and Shoulder in makingDisclaimer : Do your own research before investing. This is just a chart analysis. No recommendation to buy and sell.
Advanced Micro Devices (AMD) enters the second week of October with a moderately bullish tone.
while analyzing AMD chart found there is Inverted Head and Shoulder pattern in making.
I have highlighted level on the chart.
Please share your thouhts.

long TNSR/USDT.ptensor about to go higher, it made a H&S pattern, the recent rise it left a small consolidation. currently its trading back to that. the point of controll of that small range is imo good for a long entry to around 0.1114 or even higher. trade safe, cheers

Double or nothing The price is moving with its third upward wave toward the $16 mark.
It’s possible that this move will represent a solid +100% gain from the lows near the lower blue support at $7.77.
Head and shoulders completed on 4H
Be cautious: these small-cap companies often swing 10% in a single day due to high volatility.
The space sector is shaping up to be one of the next speculative bubbles in the coming years — better to start positioning early.
In my recent picks, I’ve included several other space-related stocks

MARA | My Life Long Girlfriend Stock | LONGMARA Holdings, Inc. is a digital asset technology company, which engages in mining cryptocurrencies with a focus on the Bitcoin ecosystem. It also deals with owning and operating bitcoin mining facilities or data centers, selling proprietary software or technology to third parties operating in the Bitcoin ecosystem, offering advisory and consulting services to support Bitcoin mining ventures in domestic and international jurisdictions, and generating electricity from renewable energy resources or methane gas capture to power Bitcoin mining projects. The company was founded on February 23, 2010 and is headquartered in Hallandale Beach, FL.
