EURAUD upside is endingThe EURAUD bullish run may be coming to an end.
Price action has broken trend support and formed a head-and-shoulders trend reversal pattern.
From a fundamental perspective, the AUD is an attractive investment due to its stable inflation and robust GDP growth.
If EURAUD doesn't become bearish, we may see the price action form a consolidation.
OANDA:EURAUD FX:EURAUD
Head and Shoulders

NZD/CAD: Time to Recover?!NZDCAD approached an important daily horizontal structure support level.
The subsequent test of this level halted the bearish momentum.
Furthermore, the market formed an inverted head and shoulders pattern on the 4-hour timeframe, subsequently breaching its neckline, thereby providing a clear bullish signal.
Consequently, a price rebound towards the 0.8131 level is anticipated.

GER40 Bearish Confirmations on the H1 TFA confirmed head and shoulders pattern with a bearish flag that still needs a breakout and retest.
But signs are pointing towards a bearish move.

Bitcoin to 150kThe head and shoulders pattern is a chart pattern that signals a change in trend. This pattern is identified by three consecutive peaks, with the middle peak being higher than the others. This pattern rarely occurs on larger time frames such as daily, weekly, or monthly, but when it does, we experience very strong movement, in this case, for Bitcoin, upward movement. We could easily reach the 150,000 mark, a 33.33% change. We have the 112,500 range as the first support of August, and a breakout of 120,000. This will be a significant increase!

STORY PROTOCOL $IP ... Still has room to the upside!In this fast moving price action.
In theory dips could still be bought for further upside if Ethereum obliges and resumes it's Bull market.
This was a beautiful inverse head and shoulders setup.... apologies for only sharing it now.
I just saw this chart / coin a few mins ago.
Hope this helps a few people in a long.
Cheers.

NZDCAD: Pullback Trade for TodayThe 📈NZDCAD pair formed an inverted head and shoulders pattern on a significant daily horizontal support level.
The violation of its neckline suggests a local advantage for buyers.
Therefore, it is conceivable that the pair could experience an upward movement, potentially reaching the 0.8115 level.

BTC – Inverse Head & Shoulders Forming | 4H Chart#Bitcoin is currently consolidating sideways on the 4-hour timeframe, and an Inverse Head & Shoulders pattern is clearly developing. This is often considered a bullish reversal setup, especially when supported by the absence of any major bearish signals.
Key Levels to Watch:
Neckline (Major Resistance): The breakout point for bullish confirmation.
Support Zone: The shoulders are holding well, showing strong buyer interest.
Trading Plan:
Wait for a decisive breakout above the neckline with strong volume.
On the retest of the neckline, look for confirmation candles to enter a long position.
Always apply proper risk management to protect capital.
If this breakout plays out, #BTC could begin a new bullish trend, offering strong upside potential.
What do you think — will #BTC break the neckline soon, or continue ranging sideways?
Drop a like if this analysis helps you.
Share your thoughts in the comments.
Follow me for more #BTC and crypto trade ideas.
#BTC #Bitcoin #Crypto #CryptoTrading #PriceAction #TechnicalAnalysis #BTCUSD #Bullish #InverseHeadAndShoulders #TradingStrategy #SwingTrading #Breakout #4HChart #LongTrade #RiskManagement #CryptoCommunity

BTCUSD has formed a head and shoulders topOn the 4-hour chart, BTCUSD has formed a head-and-shoulders pattern. Currently, attention should be paid to resistance near 115,200. Consider shorting if the rebound encounters resistance. Support is expected to be around 113,000, and further support is expected to be around 110,000 if the price breaks below.

ANANT RAJ – Breakout From Rounded Base | ₹700+ Swing PossibleANANT RAJ has triggered a fresh breakout above the ₹580 zone – reclaiming its prior breakdown level from Feb 2025. This comes after a rounded base formation lasting 4+ months.
Breakout 1: June 2, on volume, cleared the March–May base
Breakout 2: Now taking out neckline of broader inverse H&S
Volume: Expanding again
RSI: Bullish, no divergence
Structure: Clean higher highs and lows post-Feb low
Measured Move Target: ₹700
Stop-Loss: ₹558
Fundamentals Support Swing Bias:
Low debt, strong solvency
Net profit margin ~21%
FY26 profit growth estimate ~32%
Valuation expensive (P/E ~46), but growth supports it short term
Not a long-term compounding candidate yet – monitor execution
Positioning:
Swing trade, not an investment. Ride momentum. Trail stops. No averaging up. Exit if ₹558 breaks on closing basis.
Disclaimer:
This analysis is for educational purposes only. It is not investment advice. Do your own due diligence. Trade at your own risk.

Watchlist for the upcoming MonthWatchlist, I am leaving the buy and hold or technical analysis to the trader.
90% Equity Allocation
T (AT&T) – One of the largest U.S. telecom operators. Known for wireless, broadband, and media services. Defensive dividend stock, often favored for income but less growth.
HWM (Howmet Aerospace) – Supplies aerospace components, particularly jet engine parts and fastening systems. Strong tie to aviation cycles and Boeing/Airbus demand.
PLTR (Palantir Technologies) – A data analytics and AI-driven company with heavy government and enterprise contracts. Popular among growth investors for its AI positioning.
TPR (Tapestry) – Parent of luxury brands like Coach, Kate Spade, and Stuart Weitzman. A play on consumer discretionary spending and global luxury markets.
CBOE (Cboe Global Markets) – A major U.S. options exchange. Benefits from high volatility and increased derivatives trading.
STX (Seagate Technology) – A storage solutions company, specializing in HDDs and increasingly in data center storage. Sensitive to tech hardware cycles.
VST (Vistra Corp.) – A Texas-based power generator and retail electricity provider. Recently a big beneficiary of U.S. grid transition and power demand growth.
LDOS (Leidos Holdings) – Provides defense, IT, and engineering services. A government contractor with exposure to cybersecurity and national defense budgets.
RTX (RTX Corporation / Raytheon Technologies) – Aerospace & defense giant. Combines Pratt & Whitney engines and Raytheon defense systems. Key player in defense spending.
RPRX (Royalty Pharma) – Buys pharmaceutical royalties, giving exposure to drug revenues without direct R&D risks. A unique business model in biotech financing.
NFLX (Netflix) – Streaming leader. Strong global brand with massive original content library. Faces competition from Disney+, Amazon Prime, etc., but maintains scale advantage.
PM (Philip Morris International) – Tobacco company with a pivot toward smoke-free products (IQOS). Strong global distribution, especially outside the U.S.
AVGO (Broadcom) – A semiconductor and infrastructure software powerhouse. Key supplier to Apple and data centers. Huge in AI-driven chip demand.
UAN (CVR Partners LP) – Produces nitrogen fertilizer. Highly cyclical, tied to agricultural demand and natural gas pricing.
10% 2x Leverage Allocation
CAKE (Cheesecake Factory) – U.S. casual dining chain. Consumer discretionary, sensitive to economic cycles and inflation.
NVDA (NVIDIA) – AI and GPU leader. Critical to data centers, gaming, and autonomous vehicles. Market darling in AI revolution.
TSLA (Tesla) – EV leader, also expanding into energy storage and AI-driven autonomous driving. Strong growth but highly competitive sector.
GEV (GE Vernova, the energy spinoff of General Electric) – Focused on renewable and grid solutions. Plays into global decarbonization and power infrastructure demand.
MMM (3M) – Diversified industrial conglomerate (healthcare). Currently restructuring amid legal challenges, but historically a strong dividend payer.

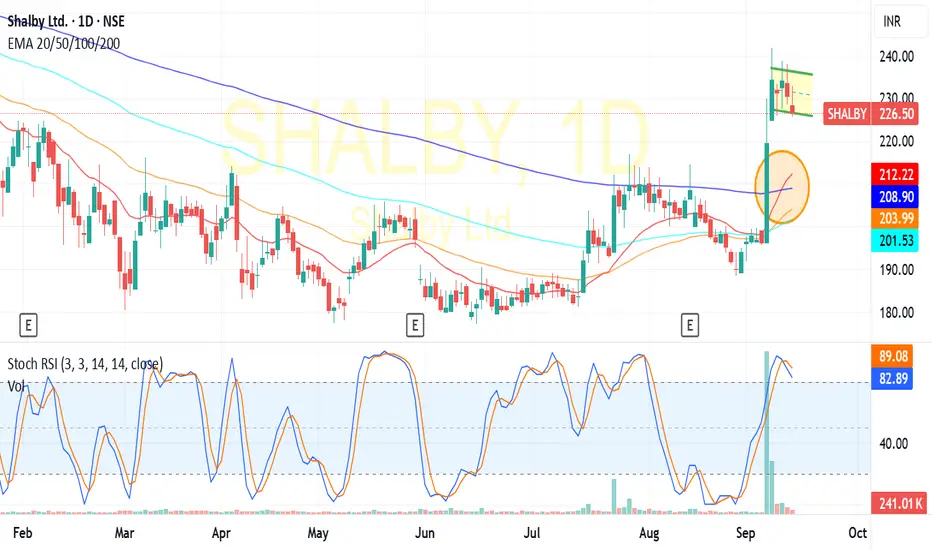
SHALBY LTD:Likely flag pattern breakoutShalby ltd:Trading at 226.50 now seems to be a value pick a this level.after a reasonable correction now trading above its 20/50/100/200 DEMA Averges in daily chart ia a clear indication of trend reversal.Shalby also formed a FLAG PATTERN in daily chart and its neck line resistance stands at 235-240,Trading above its neckline resistance see a move towards 270-300
Buy ideaReverse head and shoulders looks to be forming, with rejection at the left shoulder’s support, could see a push up to 88 if no break below support! Let me know what you think!! Comments and/or suggestion highly appreciated :)

ASTER (ASTERUSDT): Will Dump to 1.00$? Here's Why!📉ASTER formed a nice head and shoulders pattern on a hourly time frame.
The bearish violation of its neckline is a strong bearish reversal signal.
We can expect more decline and test of 1.198 / 1.00 level soon.

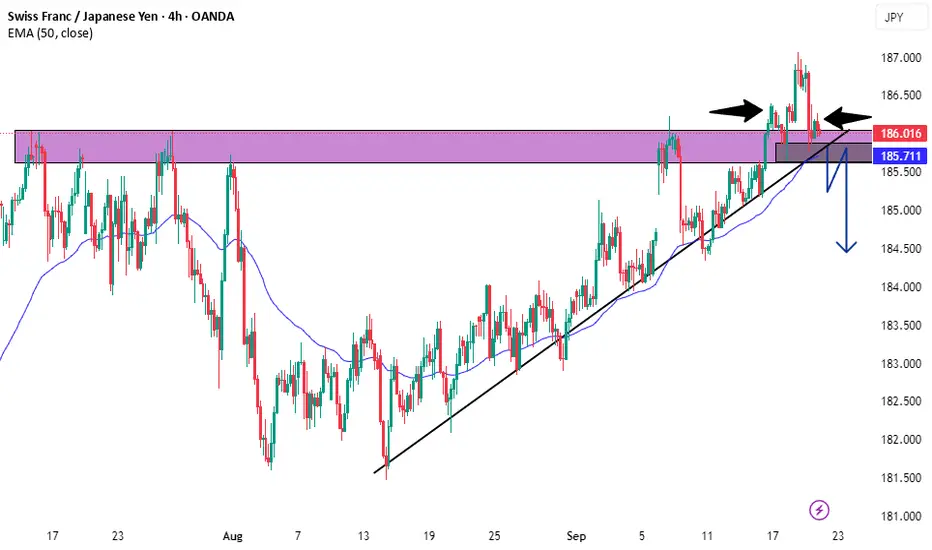
CHFJPY False Breakout & Bearish Reversal Trade.- Price broke Key Resistance level at (186.049 - 185.625) and close above the level.
- Price later retested Key Resistance Level & formed Head & Shoulders pattern Neckline at (185.883 - 185.633).
- Rising Bullish Trendline Tested Multiple Times.
* Break of Trendline Entry since we are going against the dominant uptrend.
* Wait for Break & Retest of Head & Neckline at (185.883 - 185.633)) for Entry .
Without either of these 2 conditions the bearish trade setup is invalidated.
EURUSDPrice has been playing around the weekly support zone for more than two months now and is showing and inverse head a shoulders pattern. Approximately at the neckline area, Lets see what price action we get this week.

GBPUSD: Bullish Cypher Pattern + Price Action Opportunity In today’s video, we break down two potential bullish trading opportunities on GBPUSD.
🔹 The first setup is a bullish Cypher pattern, offering a high-probability harmonic trading opportunity.
🔹 The second is a price action trade, based on a key level of structure that has been tested multiple times in recent market history.
If you have any questions, comments or just want to share your ideas, please feel free to do so below & as always show some support by hitting that LIKE button before you go!
Akil

Bunge Breaks Out of Head & Shoulder with Volume SurgeHead & Shoulder Breakout -
Bunge (BG) has recently broken out of a Head & Shoulder pattern .
This breakout indicates a potential continuation of bullish momentum.
Volume Confirmation -
The breakout was supported by a strong surge in volume on the last trading day .
Rising volume adds conviction and reliability to the breakout.
Support Trend Line Break -
The stock has also broken out of the support trend line .
This trend line was formed during the previous Inverse Head & Shoulder pattern formation .
A breakout from this structure gives additional confirmation of strength.
Price Target -
Based on the breakout and pattern analysis, the next upside target is projected at 73.9 .
Technical Confluence -
Breakout from a major pattern (Head & Shoulder).
Volume surge confirming buying interest.
Breakout from trend line formed during earlier Inverse H&S.
All these factors combine to strengthen the bullish outlook.

CZ's DOG Broccoli - potential inv. head & shoulders.With #BNB cruising past the key $1000 mark.
Let's take a look at the CZ memecoin based on his pet dog #Broccoli.
*Memes should be fun gambles*
any allocation above 1% can start causing financial damage in your portfolio!
But as lesson in speculation they can be great tools!
And a chart is a chart.
Let's see if this coin can bust through that wide neckline.

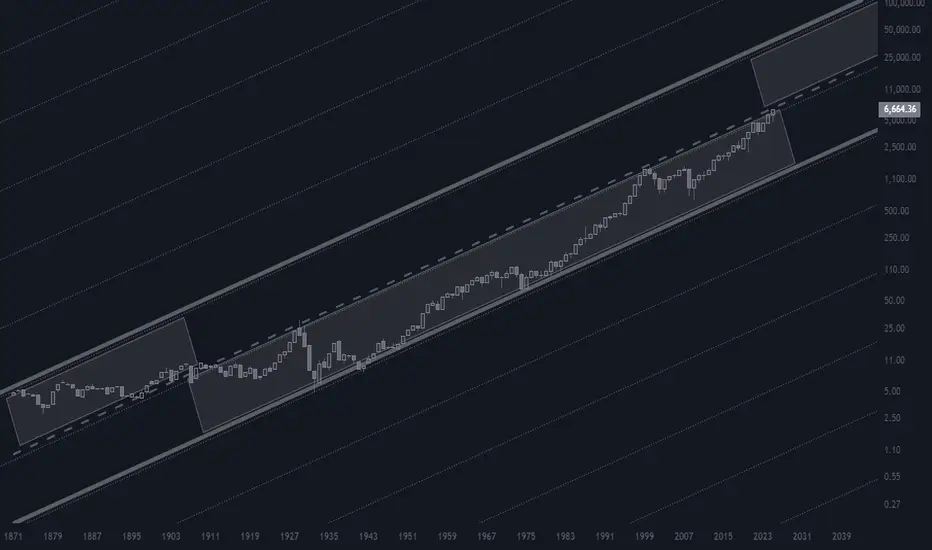
YOU MAY LIVE TO SEE MANMADE HORRORS BEYOND YOUR COMPREHENSION :)"Beyond Technical Analysis" aka "Wave Analysis > Shingo Waves"
Some very notable calls in recent years:
SPREADEX:NIKKEI and TVC:DJI both to 40k (over 1y in advance)
CRYPTOCAP:BTC pico bottom at 15k and recent local top at 70k
FX:EURUSD pico bottom & TVC:DXY pico top at 115
TVC:USOIL pico bottom at 68
NASDAQ:SMCI mega breakout at 100
NASDAQ:NVDA mega support at 120
NASDAQ:TSLA pico bottom at 105
NASDAQ:NFLX pico bottom at 165
I've also absolutely NAILED _both_ OANDA:XAUUSD and OANDA:XAGUSD breakouts in their entirety (@ see history)
EURAUD – Wave Analysis OutlookEURAUD has reacted well from the green support zone, completing a corrective (X) leg and bouncing higher. Current price action is testing the neckline area of a potential reversal setup.
If consolidation holds at this level, I’ll look for long opportunities, with the next leg higher likely targeting the 1.81–1.82 zone in line with the wave count.
👉 Watching closely for a base to form here before confirmation of the next upward swing.
⚠️ Disclaimer: This outlook is based on my personal wave analysis and shared for educational purposes only. It is not financial advice.

DELL | New All Time Highs Incoming | LONGDell Technologies, Inc. is a technology company, providing customers with a broad and innovative solution portfolio to help customers modernize their information technology (IT) infrastructure, address workforce transformation, and offer critical solutions that keep people and organizations connected. It operates through the following segments: Infrastructure Solutions Group (ISG) and Client Solutions Group (CSG). The ISG segment includes servers, networking, and storage, as well as services and third-party software and peripherals that are closely tied to the sale of ISG hardware. The CSG segment includes designs for commercial and consumer customers of desktops, thin client products, and notebooks. The company was founded by Michael Saul Dell in 1984 and is headquartered in Round Rock, TX.

GBPAUD: Strong Bearish Price ActionAfter a test of a critical daily resistance cluster, two robust bearish confirmations are evident on 📈GBPAUD.
The price violated the trend line of a rising channel and the neckline of a head & shoulders pattern with a single, strong bearish candle.
Further downward movement is anticipated, potentially reaching the 2.0384 level in the near term.

PGIL INVERSE HEAD AND SHOULDER IN PROGRESSI am bullish on PGIL.
You may book profit at resistance or wait for the neckline to break and see the rise of a multibagger stock.
Target is mentioned it may take an year or more but worth waiting.
