Careful!TREET Analysis
Closed at 32.01 (10-02-2026 03:20pm)
Head & Shoulder pattern appeared;
with potential target around 29;
either this could be a Support level if we
witness Bullish Candles else,
Better to exit around 33 - 33.70 once.
It can be re-bought after crossing &
Sustaining 34.20.
Headandshouldersformation

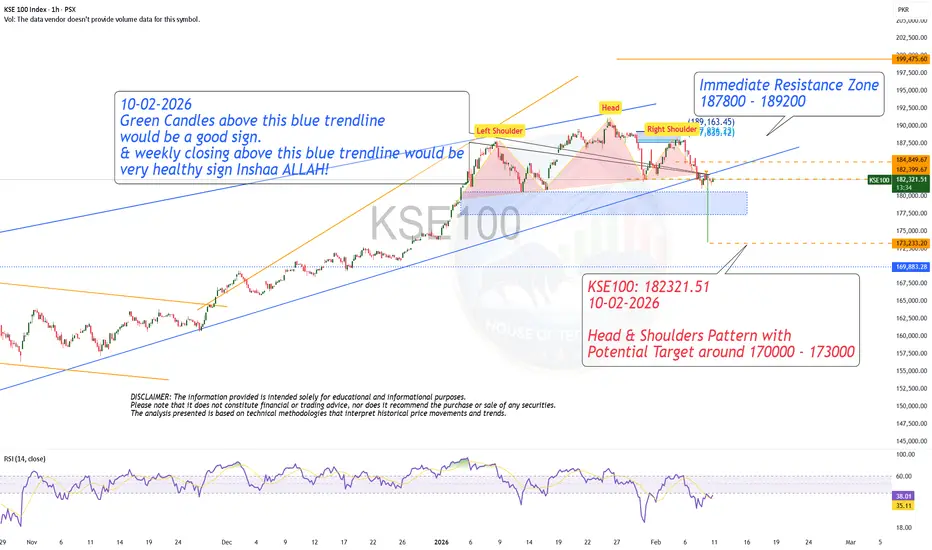
H & S Pattern - Cautious Approach!KSE100: 182321.51
10-02-2026
Head & Shoulders Pattern with
Potential Target around 170000 - 173000
RegimeWorks Trade Idea — AUDUSD (Context-First Scenario Map)1) Regime Context (Higher-Timeframe)
AUDUSD is currently interacting with a key decision band on the daily structure, where price has recently pushed into a zone that matters for directional follow-through. The area marked POI aligns with a 61.8% Fibonacci retracement level, making it a high-relevance area for reaction if price rotates lower.
RegimeWorks framing: this is a context zone — not a signal. Directional permission comes from how price behaves at the decision levels.
2) Execution Context (1H Structure)
On the 1H timeframe, a Head & Shoulders structure has formed, and price has broken below the neckline at:
Neckline / decision level: 0.69798
Price is now drifting back toward that neckline, which sets up a clean “retest decision” situation.
3) Primary Scenario (Bearish Continuation — If Retest Rejects)
If price retests 0.69798 and fails to reclaim it (i.e., rejection / inability to hold above on 1H closes), then the breakdown remains structurally valid and a continuation move becomes plausible.
Path of least resistance (scenario):
Retest neckline → rejection → rotation lower
Downside interest shifts toward the POI zone, which also matches the 61.8 daily Fib retracement area
RegimeWorks interpretation: neckline rejection = “permission” for further downside within this scenario map.
4) Alternate Scenario (Breakdown Failure — If Neckline Reclaims)
If price reclaims 0.69798 and begins holding above it on closes, the breakdown thesis weakens and the move below the neckline may have been a false break / sweep.
Implication (scenario):
Reclaim + acceptance above neckline can open the door to mean-reversion back into the prior range/structure.
RegimeWorks interpretation: reclaim = “permission removed” for the bearish continuation thesis.
5) Key Levels
Decision / neckline: 0.69798
Downside objective zone (if rejection holds): POI (61.8 Fib confluence on daily mapping)
RegimeWorks Disclaimer
This is a RegimeWorks scenario map — not an instruction, not advice, and not a prediction. It outlines possible paths based on structure + confluence. Price can invalidate either scenario quickly; always wait for your own confirmation criteria before acting.

BTCUSD making head and shoulder pattern.One time oppurtunity.Head and shoulder pattern is likely to form in weekly pattern if 74500 holds.
If it breaks 74500 abondon this idea..
A successful H&S can take the price to 22.5K
Presently right shoulder formation is likely possible upto 108K.
Dont loose this oppurtunity to go long now till 108k and then short from 108k.
play safe with required leverage.you can turn 1k to 10k or more with this kind of patterns.

H&S on Bitcoin Daily Is Now Confirmed!Trading Fam,
Not a long post here as I have said enough on this in many of my previous posts. Just wanted to update you on the Head and Shoulders pattern. Our candle close today has now confirmed a break in the neckline. This is bad. We will now look to the weekly candle close to confirm further price action down. The weekly could save us. But this is doubtful.
Remember, I have outlined at least 6 additional strong bearish patterns in previous posts that have all been confirmed. This H&S was really the final nail in the coffin. My target down remains a rough 40-50k. If we're lucky, we'll turn up again at 60k. But that remains to be seen.
One more note and something to keep an eye on, Michael Saylor's MSTR BTC buy-in price is roughly 74k. If Bitcoin breaks below that for any sustained amount of time, things could get spicy!
The show must go on.
✌️Stew

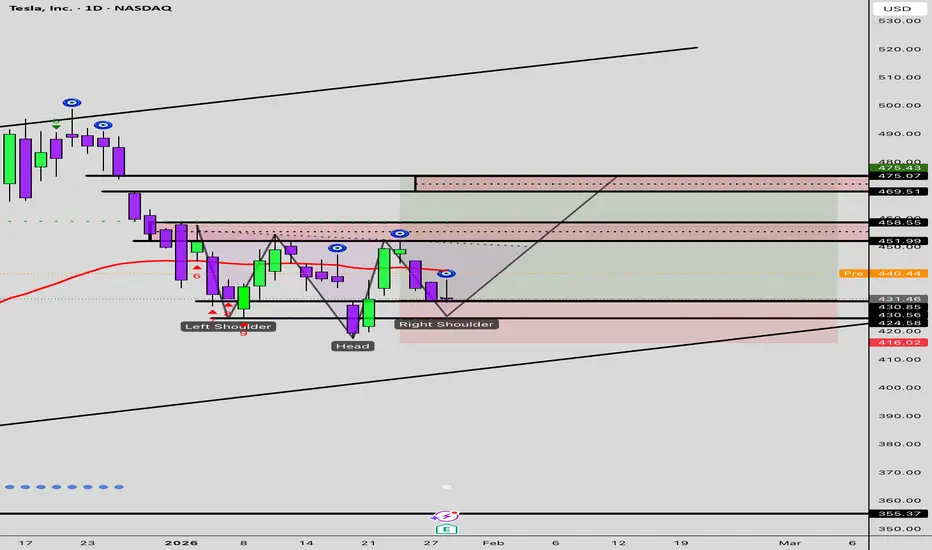
TSLA (Tesla) Long Set Up Entry Price 1: $432.00
Entry Price 2: $424.00
Stop Loss: $414.00
Take Profit 1: $442.00 (Close 25%)
Take Profit 2: $452.00 (Close 50%)
Take Profit 3: $462.00 (Close 75%)
Take Profit 4: $475.00 (Close 100%)
Inverse H & S pattern4165 Analysis
Closed at 141.50 (22-01-2026)
Inverse H & S pattern targeting around 150.
Immediate Supports are around 140 & then around 135 - 136.
Sustaining 140 may lead the price towards 150 - 151 initially.

$AVAX Warning: Big Mountain Ranges = BIG Crevices!Why the MountainBears are Growling
The "Mountains of Avalanche" is looking shaky.
Avalanche by name.
Avalanche by nature?
While the bulls are trying to hold the line, the chart is printing a Head and Shoulders pattern that looks like a final warning for Q1 2026 before breakdown (maybe q2)
Negative Momentum: The MACD histogram on longer timeframes is showing weak momentum, and the RSI is hovering in a neutral-to-bearish zone near 38–42, suggesting sellers are slowly taking control.
Institutional Caution: Despite ETF rumors earlier in the month, the current market structure favors caution over aggressive long positions until major resistance at $16.55 is cleared.
Supply Hangover: A massive token unlock (9.5 million AVAX) is on the horizon, which could dump $240 million of fresh supply onto an already shaky market.
#AVAX #Avalanche #HeadAndShoulders #CryptoWarning #TechnicalAnalysis

Daily Analysis: Nifty & Hindunilvr 20/01/26Covering the levels for Nifty and Hindunilvr setup.
Nifty has breached support and testing it as resistance, hence a sell setup is on the radar.
In Hindunilvr, an inverted H&S is completed for bullish bias.

Ethereum - can it be?Setup
Bearish - potential bullish reversal
Inverse H&S bottom pattern
Rebounded off 50% retracement of 2025 rally
Above 20/50 SMA
Below 200 SMA
RSI moved into bullish range
Commentary
NOTE: The setup is similar to Bitcoin and both will likely move in the same direction so be careful not to double up on a correlated trade.
The Bullish case for Ethereum is a bit more convincing with an inverse H&S pattern - but it could also turn into a triangle pattern breakdown.
Strategy
Buy touch of broken neckline
Wait and buy on break above last peak at 3,300.
But - as always - that’s just how the team and I are seeing things, what do you think?
Share your ideas OR send us a request!
Cheers,
Jasper
Disclaimer:
The communication does not constitute investment or trading advice, nor does it include any recommendations. Additionally, it does not serve as an offer or solicitation to engage in transactions involving financial instruments. WeTrade does not take responsibility for any actions taken based on the information provided, nor for any outcomes that may occur as a result of the actions taken.

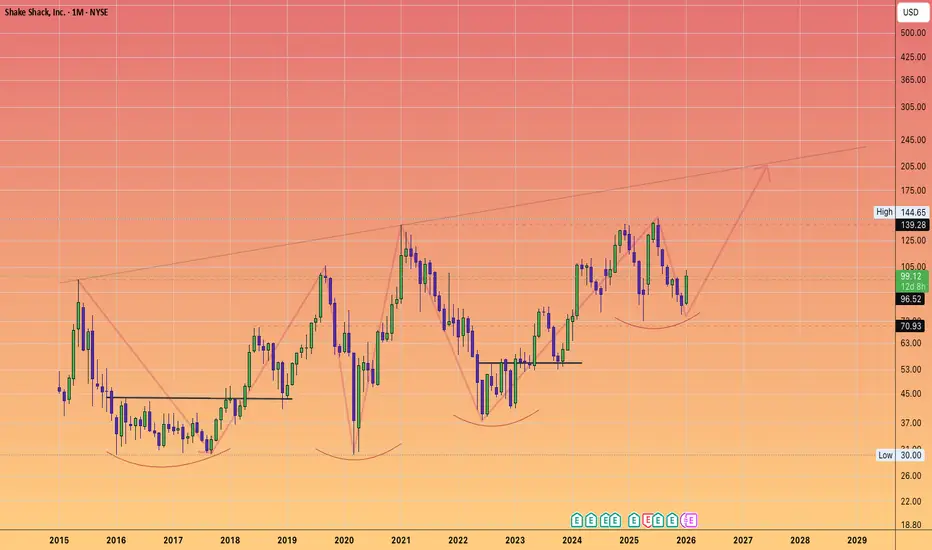
$SHAK: Shakeout to Breakout — Grilling Up a New All-Time High🍔🍔🍔🍔🍔
Looking for a retest of the $142 high by summer, on towards $200+
What looked like a topping Head and shoulders, it is my belief that is just another higher level to sustain a push towards another new ATH.
Expansion Supercycle: Management just announced its largest pipeline of new store openings in company history.
For 2026, they are targeting 55–60 new company-operated locations and up to 45 licensed Shacks.
TAM Leap: Shake Shack significantly raised its long-term total addressable market (TAM) forecast from 450 to 1,500 company-operated locations.
Margin Magic: Despite beef inflation, restaurant-level profit margins are projected to expand to 23.0%–23.5% in 2026 through operational efficiencies and supply chain savings.
Institutional Backing: Deutsche Bank recently upgraded the stock to Buy (Target: $105), and Raymond James reiterated a Strong Buy with a much more aggressive target of $140.
#SHAK #GrowthStocks #RetailRecovery #TechnicalAnalysis
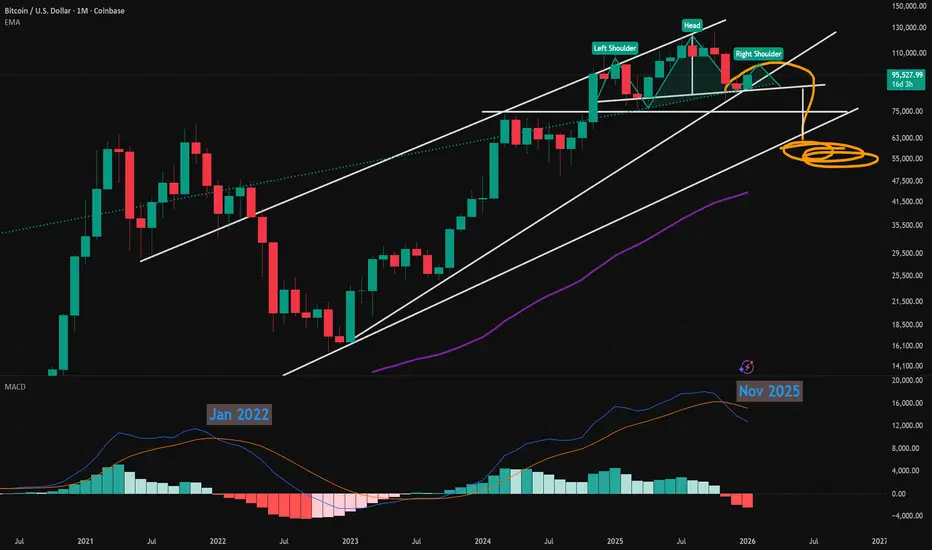
Bitcoin Macro Head & Shoulders - Right Shoulder Then DropIn similar fashion to the 2021 H&S that preceded the BEAR Market...
Bitcoin is now forming the Right Shoulder of a new Head & Shoulders pattern as we can see in this Monthly chart.
Also in this chart down below, the monthly MACD has crossed over and into Bearish territory, just like we used to confirm the last market cycle cop in January 2021.
On the daily chart, Bitcoin has been forming a Bear Flag pattern, so this recent push up to test the $98k - $100k range, is likely the final push, before heading lower.
Using any 'order block detector' you can also see heavy seller pressure (limit orders) there.
So the most likely near-term scenario is for Bitcoin to hang around this zone, while select altcoins rally a bit, then drop down into the Bear Flag channel, and ultimely fail.
The measured move for the Bear Flag is right at $74k-$75k, which is a likely strong support.
Or we could see a deeper drop, based on the measured move from the H&S pattern which is pointing to around $62k which many others are calling for.
Remembering past Bull markets, Bitcoin has retraced 50% which would be $62k from the recent ATH of $126k.
Today also, Coinbase withdrew from the Clarity Act, signalling that may not be signed in 2026.
War Fears, Economic Fears, Credit Fears, Currency Devaluation, and Liquidity issues all point to a recessionary deflationary period before markets likely recover later this year.
ATH is still possible by Q3 / Q4 once regulatory clarity, liquidity, and QE start in earnest.
Should be an interesting year!
Head and shoulder pattern ( + strong support )This chart 📉 📈 is a head and shoulder pattern, it has broken the neckline and retests, so we ride the wave 🌊 in obedience to BTC💪

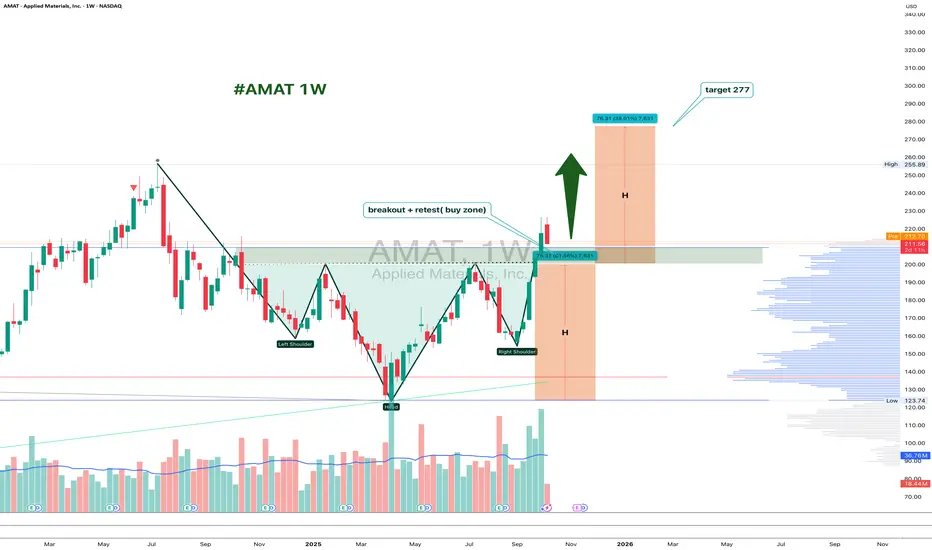
AMAT 1W: Retesting the Neckline Before the Next Move?On the weekly chart, Applied Materials (AMAT) has completed a clean inverted head and shoulders breakout around $226, and is now pulling back to retest the neckline zone near $200–211.
This area acts as strong support. If buyers defend it, the bullish pattern stays valid, with a projected target around $277, matching the 1.618 Fibonacci extension.
From a fundamental perspective, AMAT remains a key semiconductor player, benefiting from ongoing demand for chip-making equipment. The pullback looks more like a healthy pause than weakness - a classic chance for latecomers to re-enter.
Funny enough, the “head and shoulders” pattern, known for signaling tops, is doing the exact opposite here - apparently, even the market likes a good plot twist.
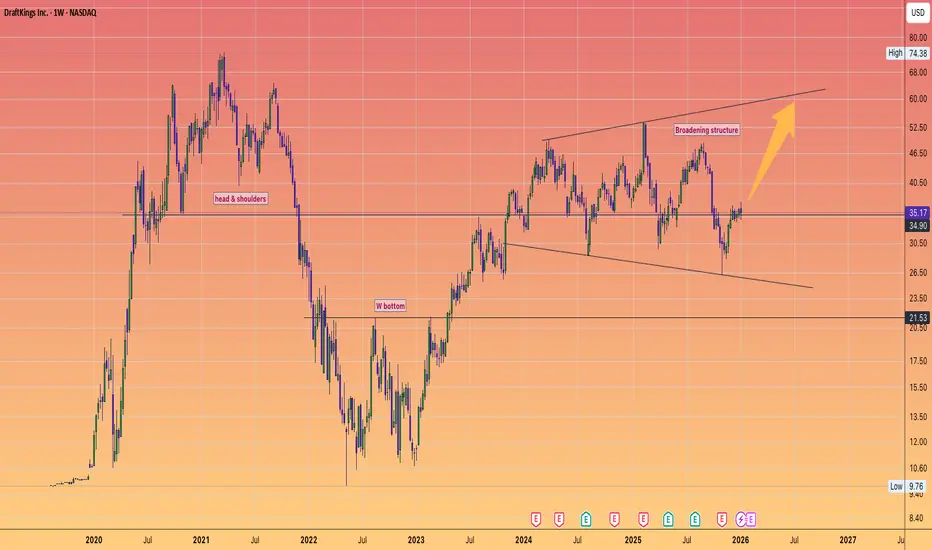
DraftKings Super Bowl ReboundThe Super Bowl is typically the largest customer acquisition event of the year for sportsbooks, and DraftKings is currently positioning itself to capture massive volume for Super Bowl LX
Customer Acquisition Spike: DraftKings is currently running aggressive "Bet $5, Get $300" promos to lock in new users ahead of the playoffs. This surge in downloads and active users often translates into bullish sentiment in the weeks leading up to the big game.
Handle Growth: Management recently reported that sportsbook wagering was up 17% year-over-year as of late 2025, providing a strong baseline of momentum heading into the peak betting season of Q1 2026.
Revenue Projection: For the current quarter, analysts are projecting massive revenue of $1.94 billion, a 38.95% increase from the previous year, driven largely by the heavy NFL postseason and Super Bowl slate.
2. The New 2026 Catalyst: "DraftKings Predictions"
A unique factor for this year's "Super Bowl madness" is the launch of DraftKings Predictions.
This new platform allows DraftKings to enter states that do not yet have legal online sports betting, significantly expanding their addressable market for the Super Bowl.
Analysts expect this "event contract" model to have higher margins and lower promotional costs than traditional betting, which could be the "X-factor" that drives a breakout.
3. Technical Analysis ($35.17 as of Jan 9)
Your TradingView chart likely shows NASDAQ:DKNG testing a key structural pivot:
Resistance: The stock is currently fighting the $36.00 level. A high-volume break above this would be a "Strong Buy" signal, potentially targeting the $50.00 range seen in early 2025.
Broadening Structure: As of January 9, 2026, the stock is trading in a horizontal trend channel. The "Super Bowl run" usually provides the volume needed to break out of such a range.
Short-term head&shoulder in VOLTAS Head&Shoulders pattern (bearish bias) in Voltas 15min.
This gives a downside target of 1441 from the breakdown of neckline.
Aggressive entry can be taken for 1500PE near the CMP as there is liquidity zone here which can push prices down. In this kind of entry the risk is more as there are chances that pattern is not completed and it will break the high of head, invalidating this pattern and making new high for the day.
Safer entry is on completion of pattern and break of neckline at around 1475.
It is always advised to finish the pattern first

GOLD, XAUUSD | H&S | Bearish Path | [RCOTradingHelpline]📉 GOLD (XAUUSD) – Bearish Scenario Explained
This chart highlights a clean Head & Shoulders formation on the 15-minute timeframe, forming after a strong bullish leg.
🔴 Key observations:
Clear Left Shoulder – Head – Right Shoulder
Strong rejection from a major supply zone
Weak bullish follow-through → signs of distribution
Expectation: Breakdown → Pullback → Continuation lower
📍 Trade idea (educational):
Conservative approach: wait for confirmed neckline break
Aggressive approach: sell rejection from the right shoulder zone
Potential targets marked based on previous liquidity & demand zones
⚠️ This is a scenario, not a signal.
Always wait for confirmation and manage risk properly.
If the neckline holds, the idea is invalidated.
💬 Let me know in the comments how you see GOLD from here.

GBPNZD higher bearish expecting
OANDA:GBPNZD we are have break of PA, later and break of H&S pattern, today we are have RBA from which expecting impact on this trade.
Here having strong bearish expectations.
SUP zone: 2.31100
RES zone: 2.28500, 2.27900

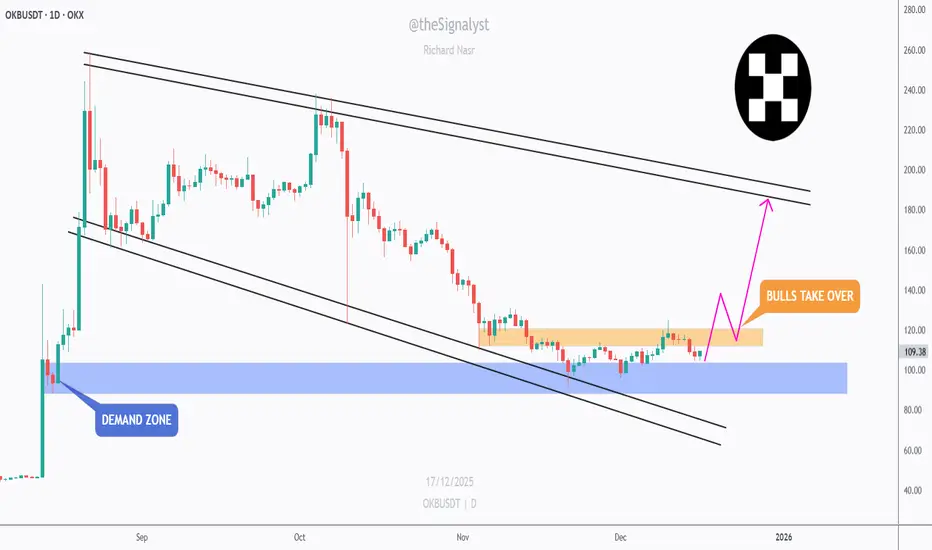
OKB - Are Bulls About to Flip the Script?📉After a prolonged corrective phase, OKB is starting to show early signs of structural stabilization. Price has respected the major demand zone, where selling pressure slowed down and downside momentum clearly weakened.
⚔️What stands out now is the tight consolidation above demand, combined with a gradual reclaim of higher levels. This type of behavior often signals a shift from distribution to accumulation, especially after a long bearish channel.
📍The key focus is the orange resistance band. A clean break and hold above this area would be a strong confirmation that bulls are taking control, opening the door for a larger recovery move toward the upper bounds of the broader structure.🏹
Until that breakout happens, patience is key. Let price prove strength before committing aggressively. But structurally, this is one of those zones where risk starts favoring the upside, not the downside.
Is this the quiet phase before expansion? 🤔
⚠️ Disclaimer: This is not financial advice. Always do your own research and manage risk properly.
📚 Stick to your trading plan regarding entries, risk, and management.
Good luck! 🍀
All Strategies Are Good; If Managed Properly!
~Richard Nasr
Bloom Energy. Is it a memestock and is it about to blow up in spectacular fashion?!
Granted it's not a pure meme with no real Business; it has real tech, revenue and a credible long term-value theme.
But the stock is trading with meme like valuation, with flow driven volatility, and sentiment.
That is why this Head and shoulders demands respecting (until invalidated ofc)
I believe risk/reward is more speculative than fundamental.

Sequent Scientific Approaching a Major Reversal LevelThis is the weekly timeframe chart of Sequent Scientific.
The stock is currently trading near the key support zone of 180–190 and is moving within a well-defined structure.
If this support zone holds, we may see a potential upside move towards the 280 and 300 levels.
Thank you.

H&S Scenario on 4H | Jobless Claims could decideFX_IDC:XAUUSD H&S SCENARIO
Until Thursday morning, trader sentiment about another rate cut was around 80%-90% in favor, but the sentiment on the Gold price since the beginning of the week has been highly undecided 🤔 due to several economic data releases which were not strong enough to give Gold a clear direction.
Data: ( Actual | Forcasted | Previous)
Monday, December 1, 2025 🗓️
S&P Global Manufacturing PMI (Nov) 52.2 | 51.9 | 52.5 ⬆️
ISM Manufacturing PMI (Nov) 48.2 | 49.0 |48.7 ⬇️
ISM Manufacturing Prices (Nov) 58.5 | 59.5 | 58.0 ⬇️
Fed Chair Powell's speech omitted any important mentions of economic conditions or the rate cut process, focusing instead on the political processes surrounding the selection of a new Chair. 🏛️
Tuesday, December 2, 2025
CPI (YoY) (Nov) 2.2% | 2.1% |2.1% ⬆️
Wednesday, December 3, 2025
ADP Nonfarm Employment Change (Nov) -32K | 5K | 47K ⬆️
S&P Global Services PMI (Nov) 54.1 | 55.0 | 54.8 ⬇️
ISM Non-Manufacturing PMI (Nov) 52.6 | 52.0 |52.4 ⬆️
ISM Non-Manufacturing Prices (Nov) 65.4 | 68.0 | 70.0 ⬇️
U.S. President Trump Spokes about drugs and car costs mostly 🗣️
If the Gold price continues to decline past $4225 and reaches the Neckline support at around $4174 - $4179, then a further drop could send the price breaking through the Neckline and Gold could drop primarily to $4110, and secondarily down to the $4070 to $4020 mark. 📉
The Initial Jobless Claims announcement at 8:30 AM ET on Thursday, December 4, is expected to determine the next step for Gold and potentially provide a clear direction. 📰
If the actual Initial Jobless Claims figure is higher than expected, this could push Gold back toward the $4250 resistance level. ⬆️ Conversely, if the figure is lower, I anticipate the price will either fall or continue to trade sideways in the $4186 - $4225 range. ⬇️ ⚖️
The Initial Jobless Claims data may be ineffective in driving Gold's price due to the significant economic data releases scheduled for Friday, December 5. ⚠️
Core PCE Price Index (MoM) (Sep)
Core PCE Price Index (YoY) (Sep)
The technical analysis regarding the Head and Shoulders (H&S) pattern is primarily a trader-driven sentiment result. While it typically acts as a reversal signal following a recent uptrend, the pattern on higher time frames (such as the 4-hour chart) does not always offer a clear direction, and the price does not consistently follow its implications. Keep this in mind and monitor economic data releases closely.
My bias remains bearish until a clear market shift occurs.
Buy for Sell: $4200 - $4215
Late entry could be $4179 when Initial Jobless Claims look good.
Stop Loss: $4230
TP 1: $4167
TP 2: $4153
TP 2: $4116
TP 3: $4070
-------------------------------------------------------------------------
This is just my personal market idea and not financial advice! 📢 Trading gold and other financial instruments carries risks – only invest what you can afford to lose. Always do your own analysis, use solid risk management, and trade responsibly.
Good luck and safe trading! 🚀📊

BTCUSD can crash to 24k if ABC correction occurs BTC experiencing the effect of Dead cross at 110000 USD ,which can drag upto 74500 and a support can take place due to price convergence and RSI divergence setup.
If price bounce backed from 74500 around ,then it can reach 0.386/0.618 around 106000 and 108000 USD.
A third try to breach 74500 can break the support and can take leap towards 24k making it drag down of 82% which BTC achieved back in 2017- 2018 .
Disclaimer: this is purely based on previous trends study and speculations according to price moments .i recommend to make your own study before investing or consult your financial advisor .
