Ethereum - Forming A Base Like So Many Times Before ?#ETH
Ethereum is forming higher lows and a higher high while bouncing off support ATM
This bottoming structure has been formed similarly many times in this pair.
All while sentiment is a like a funeral procession & ETH ETFs are loading in the background
Probably Nothing...
Higherhigh

Krispy Cream Donut Weekly God Candle Has me lookingHi guys. Always on the lookout for major changes/shifts or Macro signals. Yesterdays 40% increase in Krispy Cream Donuts, has me taking a look into this one.
This analysis is on the 1 week. Note, the current candle is not yet confirmed. Weekly close is obviously on fridays.
I have highlighted 2 zones. COnsolidation range and a Supply zone. We do need to pay attention to these 2 ranges.
BEcause atleast from previous history the supply zone is a resistance zone and thus a sell area. We would need decisive candle closes ABOVE for multi weeks for me to gain confidence that it has flipped to Demand or Support.
Same goes for breaking out of the consolidation range. More info is needed such as confirmation.
But nevertheless, What had me looking DNUT's way, was candle moving past the major resistance trendline that has haunted us since the stock being traded publically.
I would like to note on the weekly timeframe, confirmations have not come in yet, and until proven otherwise it can be a fakeout and can always come back into the consolidation zone. AGAIN, End of week will give us better information.
But it does not take away the fact that DNUT is moving. And atleast for now, DEMAND exists.
VOLUME needs to follow with continued increase.
Things to note in our indicators:
RSI, breaking a major trend by signaling a higher high. But again end of week will clarify this. If it prints, i see it as a positive sign.
STOCH RSI - crossing bullish with is almost above 20 lvl. This indicates possibility of momentum coming in to support an uptrend.
MACD - Has Bullish cross, however we need to see whether or not we can get ABOVE 0 lvl. This would indicate a high probability for a sustainable uptrend.
Being that this weeks candle has not yet closed. It is absolutely important to continue to observe. But DNUT has made it to my watchlist for sure.
Is Krispy Cream Donuts, the Donut for me and you? Well time will tell. LOL.
__________________________________________________________________________________
Thank you for taking the time to read my analysis. Hope it helped keep you informed. Please do support my ideas by boosting, following me and commenting. Thanks again.
Stay tuned for more updates on MINAUSD in the near future.
If you have any questions, do reach out. Thank you again.
DISCLAIMER: This is not financial advice, i am not a financial advisor. The thoughts expressed in the posts are my opinion and for educational purposes. Do not use my ideas for the basis of your trading strategy, make sure to work out your own strategy and when trading always spend majority of your time on risk management strategy.

GBP-USDThe price of gbpusd at 1.26700. and it creates a higher high and higher chance of creating lower low mention in chart.

NIFTY DAILY - 19/3/2024Nifty open with huge gap down and bear took control of it and made low of the day that is 21793 level.
Index has broke consolidation line and higher high higher low pattern.
Nifty has formed a big red body candle with upper and lower shadows.
Nifty has given closing below 22831 level which was its support level so, 21667 level will work as next support level and 21906 will work as resistance level.
Today’s Advance Decline ratio of NIFTY50
Advance - 9
Decline - 41
FII Buy + 1421.48 crore
DII Buy + 7449.48 crore.
⚠️ Important: Always maintain your Risk & Reward Ratio.
✅Like and follow to never miss a new idea!✅
Disclaimer: I am not SEBI Registered Advisor. My posts are purely for training and educational purposes.
Eat🍜 Sleep😴 TradingView📈 Repeat 🔁
Happy learning with trading. Cheers!🥂

HIGH NEW VOLUME INCREASEHIGH shows new interest in volume trends.
We will see if HIGH can become HIGH in the next time frame.

AUDNZD: Bullish Divergence Sparks Reversal Potential📈 Overview:
AUDNZD, previously bearish, now displays bullish divergence with the formation of the first higher low and higher high on the 1-hour timeframe. Market sentiment at 94% long adds strength to the reversal signal.
📊 Technical Analysis:
Bullish divergence, coupled with higher lows and higher highs, indicates a potential trend reversal.
📉 Market Sentiment:
With 94% long sentiment, there is strong support for the anticipated bullish reversal.
📉 Trade Strategy:
Consider long positions, aligning with the bullish signals, and anticipate further upward movement.
🛑 Risk Management:
Mitigate risks with effective stop-loss orders to protect capital.
📈 Conclusion:
AUDNZD offers a concise opportunity for a bullish trend reversal, supported by bullish divergence and strong market sentiment. Monitor for confirmation and adjust positions accordingly.

USDCAD potential buyusdcad is making higher highs and higher lows on higher time frames and on the 4hr intraday time frame price is respecting support so i decided to get in at a one hour engulfing i also gave an update on AUDCAD.While AUDCAD is moving in a downward direction showing selling pressure at the moment i am waitin fot it to play out as planned.

Higher High Higher Lows - VARDHMAN ACRYLICS📊 Script: VARDHACRLC
📊 Sector: Textiles
📊 Industry: Textiles - Manmade
Key highlights: 💡⚡
📈 Script is trading at upper band of BB and giving breakout of it.
📈 MACD is giving crossover .
📈 Double Moving Averages giving crossover.
📈 Right now RSI is around 67.
📈 Script is making Higher High Higher Lows as shown in chart.
📈 One can go for Swing Trade.
⏱️ C.M.P 📑💰- 72
🟢 Target 🎯🏆 - 80
⚠️ Stoploss ☠️🚫 - 68
⚠️ Important: Always maintain your Risk & Reward Ratio.
✅Like and follow to never miss a new idea!✅
Disclaimer: I am not SEBI Registered Advisor. My posts are purely for training and educational purposes.
Eat🍜 Sleep😴 TradingView📈 Repeat 🔁
Happy learning with trading. Cheers!🥂

Trading a midday Reversal on NIFTYUsing PIVOTs, DIY Indicators and Price action to seek confluence and trade.
Step1) COnfirmed Reversal from PIVOT point (Daily Pivot)
Step2) Observed Higher High, Higher Low
Step3) Move above 200EMA confirmed Bullishness
Step4) Use Matrix Series and Ehlers to combine with above view and trade the trend.
Step5) Use the Support and Resistance Levels on DIY indicator for key levels to trail and exit the trade.
Achieved R:R of 1:6 on 21800 CE today

The Phoenix Rising - Reliance CapitalWhat goes Up will come down, What goes down will Rise Up - This is Universal Law
Abiding by this law - Reliance Capital - The once sunken stock - declared bankrupt - Resurrected by Hinduja Group (IndusInd International Holdings) which bought Reliance Capital for approx. 9,600 Crore.
The effects of these actions are seen on the Charts clearly - The Phoenix Rising from the deep. Recently the stock was removed from ESM Phase II - relieving it from restriction of being traded only on Mondays. From the New year - the stock is hitting 5% UC each day
Here are the confirmation of Bullish Reversal
The classic HH-HL structure indicating Bullish Reversal on Monthly
HH-HL formed at 0.786 FIB Retracement which is a very reliable bounce level
A Beautiful Rounding Bottom Structure on Monthly
Symmetrical Triangle formation
BO is pending both on Rounding Bottom & Symmetrical Triangle - BO above 15 WCB will take to targets of 42, 52, 78
Word of Caution: This is still a Risky bet - The above suggestions are for those beaten down souls already holding the stock for quite long. Hold your breath - Keep up your hope and Patience - good times are ahead. New Entrants - better to stay away from this script until stronger bullish structures are formed
Disclaimer:
Stocks-n-Trends is NOT a SEBI registered company. We do not provide Buy / Sell recommendations - rather we provide detailed analysis of how to review a chart, explain multi--timeframe views purely for Educational Purposes. We strongly suggest our followers to "Learn to Ride the Tide" and consult your Financial Advisors before taking any positions.
If you like our detailed analysis, please do rate us with your Likes, Boost and share your comments
-Team Stocks-n-Trends

NQ Power Range Report with FIB Ext - 12/20/2023 SessionCME_MINI:NQH2024
- PR High: 17034.25
- PR Low: 17020.00
- NZ Spread: 37.75
Key economic calendar events
10:00 | CB Consumer Confidence
Existing Home Sales
10:30 | Crude Oil Inventories
Continuing to lift supply
- Trading slightly above prev session high
Evening Stats (As of 12:25 AM)
- Weekend Gap: N/A
- Gap 10/30 +0.47% (open < 14272)
- Session Open ATR: 203.18
- Volume: 20K
- Open Int: 276K
- Trend Grade: Bull
- From ATH: -4.4% (Rounded)
Key Levels (Rounded - Think of these as ranges)
- Long: 17700
- Mid: 16391
- Short: 15819
Keep in mind this is not speculation or a prediction. Only a report of the Power Range with Fib extensions for target hunting. Do your DD! You determine your risk tolerance. You are fully capable of making your own decisions.

USD/JPY - What would be the next direction for the pair We can observe that the USD/JPY pair has been on a bullish trend since January, reaching a retest of a 33-year high at 152.073 this month. There has been a moderate pullback to the supply zone, trendline and the EMA200. The current scenario presents possibilities for both a downside break and an upside push, with the potential to surpass the 152.073 level. The market is currently establishing higher highs, maintaining its overall bullish trajectory.

When Madras Fertilizer is set to be a quick Riser.Madras Fertilizers Limited is engaged in the manufacturing of Urea and Complex Fertilizers. It is also involved in manufacturing Bio-fertilizers and trading eco-friendly Agro Chemicals, Organic Manure, and City Compost under the brand name ‘Vijay’
The Co has proposed to set up a 20 MW gas-based power plant with Gas turbine along with Heat recovery by steam generation. It is expected to be funded through the sale of vacant Land in Guindy and Manali and the rest through internal accruals
The Co has changed feedstock from Naptha to RLNG which has resulted in reduction in the cost of production of urea.
The Co is concentrating on product diversification under which two new projects have emerged which are under the study of technical feasibility and financial viability.
Market Cap 1,216 Cr.
Stock P/E 6.56
Industry P/E 10.2
ROCE 26.8 %
EPS 11.5
EPS preceding year 10.1

📈 Analysis of AARTIPHARM: A Bullish Opportunity Awaits? 📈Hello, fellow traders! 👋
Today's spotlight is on AARTIPHARM . After closely observing its four-hour time frame, here's what caught my attention:
1️⃣ Major Trend: The stock is confidently striding in an upward direction. Each stride it takes, it glances back at its support, reassuring itself before surging upwards again.
2️⃣ Pattern Recognition: The recurring 'higher high' formation suggests a consistent bullish behavior.
3️⃣ Support Check: It's gearing up to greet its support level once again. A friendly wave or a hug? Let's find out!
4️⃣ Moving Average: The 200-day moving average is waving right at its entry price. A potential bullish beacon?
5️⃣ Upward Direction: This can be the wind beneath our trading wings, providing additional strength for our strategies.
🚀 Takeaway: All these factors hint towards a trade opportunity that we might not want to miss. But as always, tread with caution and ensure your research backs your moves.
❓ Your Thoughts: Have you been tracking AARTIPHARM? What's your take on its current position? Drop your insights below!
🔔 Stay Tuned: I'll be back with more insights and analyses. Don't forget to follow for timely updates.
Until the next trade, keep those charts ringing and strategies sharp! 📊
Warm regards,
Alpha Trading Station

CADCHF - Break of Structure 📉Hello Traders!
On The Daily Time Frame, The CADCHF Price Reached A Strong Resistance Level (0.68135 - 0.68320).
Currently, The Price Failed To Create a New Higher High.
The Last Higher High is Broken (Break of Structure).
The Support Line is Broken.
So, I Expect a Bearish Move📉.
i'm waiting for retest...
-----------
TARGET: 0.66300🎯
___________
if you agreed with this IDEA, please leave a LIKE, SUBSCRIBE or COMMENT!

AUDCHF - Break of Structure 📉Hello Traders!
On 29 Friday September, The AUDCHF Price Reached A Resistance Level (0.59166 - 0.59294).
Currently, The Price Failed To Create a New Higher High.
The Last Higher High is Broken (Break of Structure).
The Support Line is Broken.
So, I Expect a Bearish Move📉.
i'm waiting for retest...
-----------
TARGET: 0.56750🎯
___________
if you agreed with this IDEA, please leave a LIKE, SUBSCRIBE or COMMENT!

EURJPYSELL IDEANext trade where i will look for an opportunity for sell,we see a change in structure,making lh an a retest,waiting for a confirmation and break below 156.390
Happy trading everyone!

GBPJPY SHORT IDEASo this would be my next setup for this pair,going short if it breaks the low,chasing 650 pips profit,but take your own decision how long do u want to keep trade going because on daily we can spot a big rejection half move down,where price could possibly reverse,take partials or keep your sl above last hi.Happy trading everyone,september was extremly choppy,lets see how will october be.

EURUSD IDEAMy next trade will be eurusd,we see large bearish candles so sellers are in control,as pullback occurs it should show small bull candles,wait for a confirmation beafore entry.
We can se price before rejected the blue line,so bearish candles broke the lowest point.
Happy trading everyone! As always risk menagment is the key to sucess!

USDJPY IDEASo after a long time,i wanted to publish this trading idea,we see clear uptrend on a 1hr chart,but didnt manage to break hh,made hl,so now we wait for a break and retest,and of course a confirmation candle to enter a short position for around 100pips

NQ1! 100 E-mini Futures 1HNQ1! 100 E-mini Futures 1H
Signals:
1. Market structure : Higher High, Higher Low.
2. Mommentum channel PULLISH.
3. Indicator: RSI - hidden divergence RSI
4. Gap

📈 Exciting Trading Opportunity Alert! USDJPY: bull flag🚀✨Delving into the intricacies of USDJPY on the 4H TF
Take a step back and witness the grand narrative of the chart—an unwavering uptrend punctuated by calculated retracements.
Recently, a significant consolidation occurred at the pivotal 145.000 level, a strategic move accompanied by the emergence of a promising bull flag pattern. This pattern speaks volumes, reinforcing the notion of an ongoing trend.
But the real excitement? Brace yourself for the breakout! 🚀📈 The trajectory is set for a huge leg up, mirroring the upward momentum.
🌟 Now, aligning with the persistent bullish sentiment, I'm pinpointing two juicy targets: 148.000 and 150.000. 🎯
In this intriguing juncture, let's seize the opportunity to navigate the market waves, buoyed by the prevailing trend's tide.📈🌊

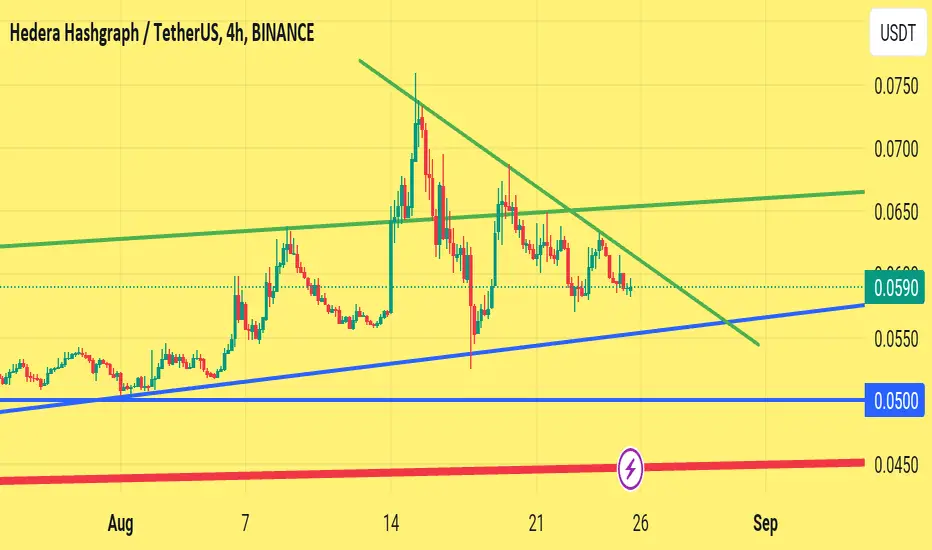
Hbar Decision time#Hbar, if it breaks any green trendline then it pump.
If it breaks any blue trendline then it will dump because a trend of higher high higher low will breakdown.
Decision time is coming soon.