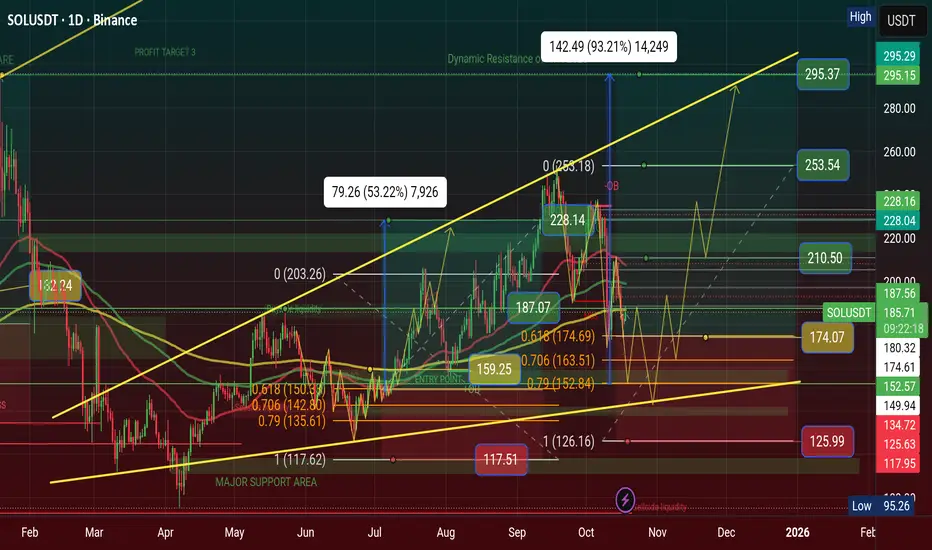
$SOL Showing Inverse Descending Triangle Pattern, $333 in 2026 CRYPTOCAP:SOL Showing Inverse Descending Triangle Pattern, $333 in 2026
💹 Inverse Descending Triangle Pattern
When This pattern will showing a chart than Price is waveing Descending Triangle Range of areas. Price will showing inverse and price moved too. we can make a trade plan to High area and low area. I'm using my Golden Fibonacci Tool, there are 3 point area of Buy position.
💲Position Setup: Open Long Position have 3 point areas, $152, $163, $174 and stoploss below area is $117. The Major Support Area is $101—$111 and Dynamic Resistance of ATH area is $293. My Long Position Target areas $210, $253, $293 and Incredible Price Target $333 areas in 2026
My Previous Long Setup will Hit $228 and complete my Trades. you can see my Previous analysis on this chart and now Waiting for confirmation of golden zone of Golden Fibonacci tool areas.
#Write2Earn #BinanceSquareFamily #Binance #SOL #SUBROOFFICIAL
Disclaimer: This article is for informational purposes only and does not constitute financial advice. Always conduct your own research before making any investment decisions. Digital asset prices are subject to high market risk and price volatility. The value of your investment may go down or up, and you may not get back the amount invested. You are solely responsible for your investment decisions and Binance is not available for any losses you may incur. Past performance is not a reliable predictor of future performance. You should only invest in products you are familiar with and where you understand the risks. You should carefully consider your investment experience, financial situation, investment objectives and risk tolerance and consult an independent financial adviser prior to making any investment.
Highlights
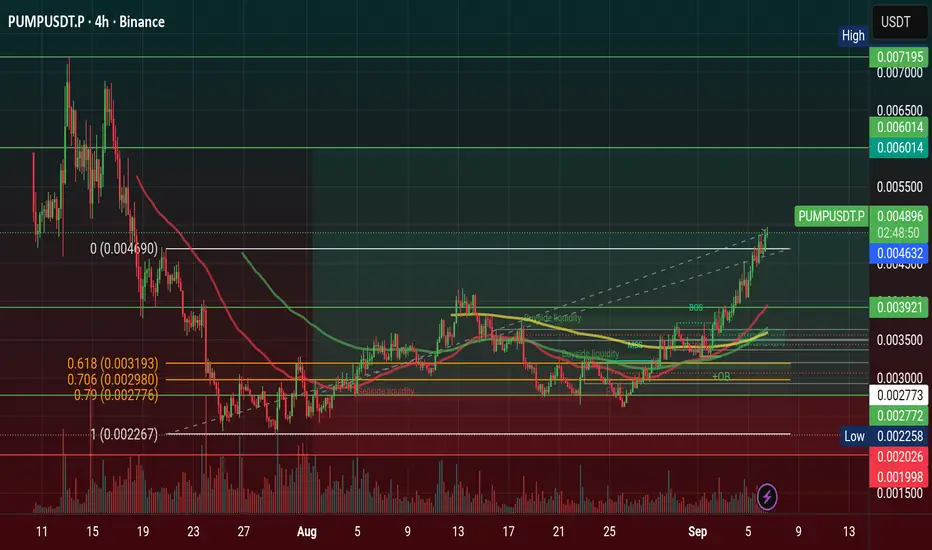
$PUMP Parabolic Starting & if Break ATH price hit $0.011 in 2026🚀 NYSE:PUMP Parabolic Starting & if Break ATH price hit $0.011 in 2026
IN 2026 PUMP will be happened break ATH and my Prediction $0.006 price area will be breaks after Price will stay accumulation in previous ATH areas. In 2026 price could hit $0.011 and 0.008 areas.
Pump.fun Executes $62M Token Buyback as Class-Action Lawsuit Looms
The platform generated more than $775 million in revenue since launch, according to DefiLlama, though income briefly slumped in late July, when weekly revenue fell to $1.72 million- its lowest lev el since March 2024. At its peak in May, weekly revenue topped $56 million, coinciding with a surge of Solana memecoins that briefly pushed SOL itself above $200, its highest level since late 2021.
Market Impact and User Growth
The buybacks appear to be lifting sentiment. PUMP has gained 12% in the past month and 9% in the past week, trading at $0.003522 — up 54% from an August low of $0.002282. The number of unique PUMP holders has climbed to more than 70,800, with smaller accounts holding under 10,000 tokens now making up nearly half of distribution, pointing to stronger retail participation. Blockchain explorer Solscan shows wallet activity on Pump.fun has nearly doubled since May, with daily active users averaging 48,000 compared with 25,000 earlier in the year.
#Write2Earn #PUMP #TrumpTariffs #highlight #SUBROOFFICIAL
Disclaimer: This article is for informational purposes only and does not constitute financial advice. Always conduct your own research before making any investment decisions. Digital asset prices are subject to high market risk and price volatility. The value of your investment may go down or up, and you may not get back the amount invested. You are solely responsible for your investment decisions and Binance is not available for any losses you may incur. Past performance is not a reliable predictor of future performance.
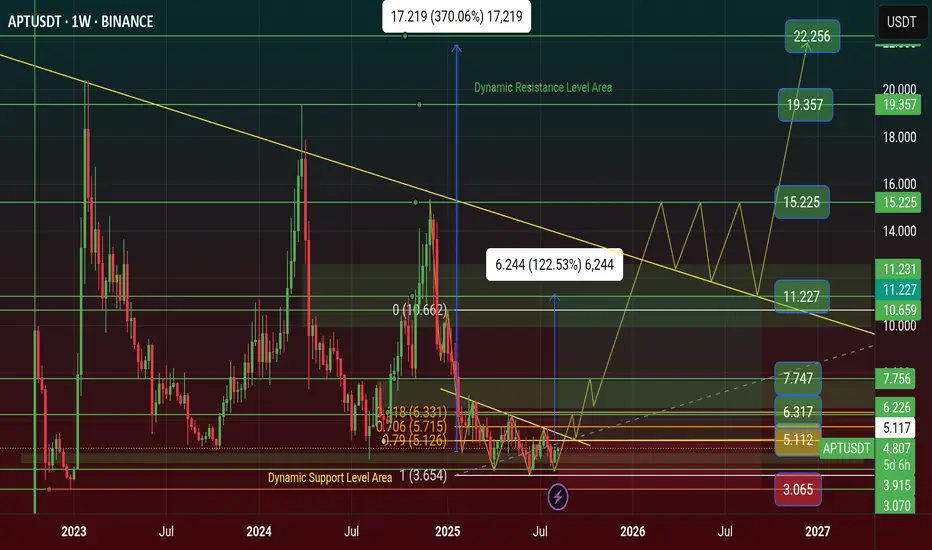
$APT Price Prediction will be reach $22 this Year 2025APT price is Showing Triple Bottom Pattern on Chart. it's a Reversal Pattern for APT price Manipulation. Time for Bull Run on APT and 12 aug unlocked 11.31M APT token and 2.20% of released supply $51.35M Dollar.
APT Price now Bottom area of Major Support Level area. At first the price will Hit $7 and if it's touch $11 price and if it's Breakout this Resistance it will be happened APT $22 Price.
🚦Aptos (APT) - 11.31M Token Unlocked worth of $51.35M - 12 Aug 2025
On 12 August 2025, Aptos will unlock 11.31 million new tokens. This event adds more APT tokens into the market supply at one time. Many traders watch token unlocks because more supply can bring price down if holders decide to sell quickly. Also, if most tokens go to teams or early backers, there might be more selling.
However, if unlocks are well planned and market demand is high, the price may not fall much. This event could be a catalyst for price change based on how the market reacts.
🚦 Aptos’ DEX trading volume reached $9 billion in the first half of the year, and the market value of stablecoins increased to $1.2 billion
PANews reported on August 12th that a Messari report showed that Aptos made significant progress in on-chain performance, DeFi ecosystem, and technological innovation in the first half of 2025. Transaction fees dropped to $0.00052, DEX trading volume reached $9 billion, and the stablecoin market capitalization increased to $1.2 billion.
On the technical side, projects such as Shelby and Decibel were launched to improve network performance. The Aptos Foundation invested $200 million to promote ecosystem development and consolidate its position as a global transaction engine.
🚦 UPCOMING EVENTS APT 11 SEPTEMBER
Total 11.31M APT Token Unlock worth of $54.51M and 2.15% of released supply
#Write2Earn #BinanceSquareFamily #BinanceAlphaAlert #APT #SUBROOFFICIAL
Disclaimer: This article is for informational purposes only and does not constitute financial advice. Always conduct your own research before making any investment decisions. Digital asset prices are subject to high market risk and price volatility. The value of your investment may go down or up, and you may not get back the amount invested. You are solely responsible for your investment decisions and Binance is not available for any losses you may incur. Past performance is not a reliable predictor of future performance. You should only invest in products you are familiar with and where you understand the risks.
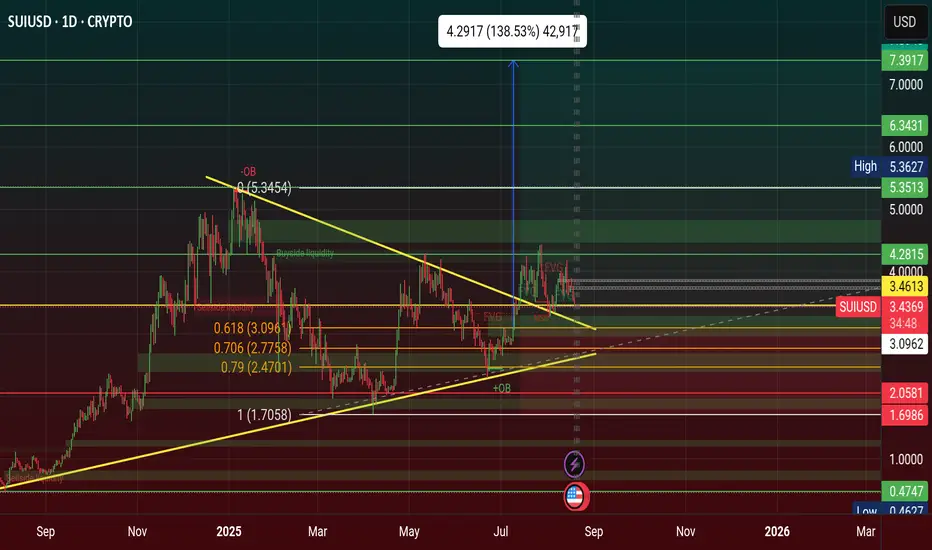
$SUI showing Bullish Symmetrical Triangle Pattern & Price hit $7CRYPTOCAP:SUI showing Bullish Symmetrical Triangle Pattern & Price hit $7 in 2025? SUI Price Prediction- Will Robinhood Listing Fuel a Breakout To $5.5?
SUI price trades at $3.49, consolidating in a bullish triangle as Robinhood listing and sentiment hint at a potential $5.5 breakout. Price Retest again and Waiting for Breakout the Last High in this weeks.
🚦Highlights of SUI Coin Prediction 2025-2026
• SUI price consolidates in an ascending triangle with resistance at $4.50.
• Robinhood listing expands access to millions of U.S. retail investors.
• Weighted sentiment rebounds to +0.533, signaling renewed market optimism.
At press time, SUI price saw a decrease of 3.09% to $3.49 in 24 hours, testing the ascending trendline support. Regardless of the retracement, the price structure is bullish and a breakout pattern is still in force. The most recent Robinhood listing could open up more demand, and sentiment indicators are showing increasing optimism.
Symmetrical Triangle Formation Sets SUI Price on a Bullish Course
The SUI price remains in a clear ascending triangle pattern, with a rising support and a flat resistance band between $4.46 and $4.50. This trend, which has been in place since June, shows great accumulation at higher lows with numerous rejections at the ceiling.
The price is trading above the key trendline at around $3.49, indicating that buyers are still defending the bullish structure. Breaking above $4.50 may lead to a steep up-move of 57.52% to the target of $5.5.
Conversely, a breakdown below $3.40 would nullify this bullish setup. At the moment, the structure holds and the long term SUI price outlook depends on its performance at $4.50. SUI Market Cap $12.16B, Max Supply 10B.
The 14-day Money Flow Index (MFI) is at 48.75, which is in the neutral range. This level implies an equilibrium between inflows and outflows, and there is much space to a bullish blow in case buyers step in.
In case the MFI exceeds 60 and breaks out, it would support the inflow of new capital. Furthermore, the previous bounce in the indicator off of sub-40 levels indicates a decline in selling pressure over the recent days.
The shift along with the technical compression implies a possibility of energy accumulation under the surface. Should bulls reclaim resistance, this accumulation period might blow up into a full breakout. Therefore, the SUI price is technically supported and awaits a catalyst to unlock upside.
Robinhood Listing and Sentiment Shift Strengthen the Bullish Outlook
The launch of SUI on Robinhood, on August 19, will be a major step toward retail access. The new listing enables millions of users in the U.S. to instantly trade SUI using the Robinhood app, making it easier to onboard and eliminate friction to retail investors.
This listing is crucial, as it comes at a time when a bullish ascending triangle pattern is being formed on the SUI price chart. It adds accessibility and narrative fuel, two of the most important driving factors that may underpin an upside breakout.
Besides the listing, the weighted sentiment data provided by Santiment shows that the crowd psychology has changed. The metric, which had plunged into negative territory in the middle of August, has now recovered to a +0.533.
This indicates that investors are feeling optimistic once again. Such sentiment spikes can be followed by price rallies when supported by positive structural backdrops.
With both chart dynamics and on-chain mood aligned, the SUI price could be primed for its next major move, further supported by ETF filings from Canary and 21Shares that highlight growing institutional interest.
In summary, there is no doubt that the signals are all pointing to a breakout. The structure of the ascending triangle is still in place, sentiment is on the upside, and the listing of Robinhood provides a new surge of demand. A clean flip above $4.50 would probably drive the SUI price to the $5.5 target. Therefore, SUI is on the verge of a bullish breakout.
#Trendingideas #highlights #Binance #SUI #SUBROOFFICIAL
Disclaimer: This article is for informational purposes only and does not constitute financial advice. Always conduct your own research before making any investment decisions. Digital asset prices are subject to high market risk and price volatility. The value of your investment may go down or up, and you may not get back the amount invested. You are solely responsible for your investment decisions and Binance is not available for any losses you may incur. Past performance is not a reliable predictor of future performance. You should only invest in products you are familiar with and where you understand the risks. You should carefully consider your investment experience, financial situation, investment objectives and risk tolerance and consult an independent financial adviser prior to making any investment.
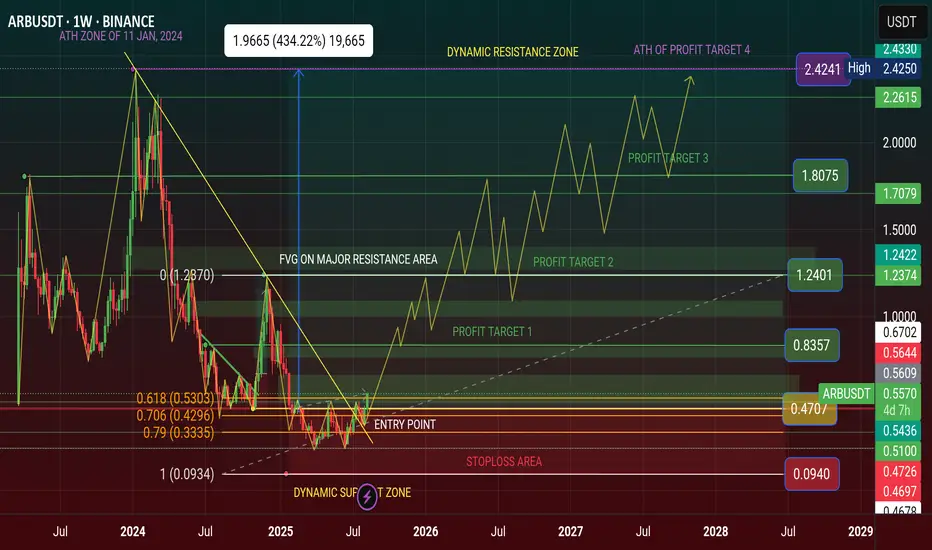
$ARB Finally Breakout $0.50 and going to +$1 This August 2025✨ AMEX:ARB Finally Breakout $0.50 and it's going to Rocket +$1 This August 2025 and +$2 in 2026
I was Share my Prediction on TradingView and Binance Square. Lastly, i was telling the ARB price is Showing a Bullish Reversal Pattern and this is Last hope in Bottom Price of Dynamic Support Level Area.
Now Price is showing Bullish Reversal of Double Bottom Pattern in Weekly Chart. Price Breakout The Neckline. My Premium Followers was Entered Long Trade or Buy Spot Trade of ARB Coin. They are now profitable in their ARB Coin investment.
🚦From News: Arbitrum (ARB) To Soar Further? Key Harmonic Pattern Signals Potential Upside Move
The cryptocurrency market is in bullish mode as Ethereum (ETH) broke above the $4,200 level for the first time since 2021. This surge has sparked a broad rally, with major altcoins including Arbitrum (ARB) riding the wave higher. ARB has posted an impressive 20% weekly gain, but more importantly, its price chart is now flashing a harmonic pattern that may reveal its next move.
Harmonic Pattern Hints at Potential Bounce
On the daily timeframe, ARB is shaping up a Bearish ABCD harmonic pattern — a formation that, despite its “bearish” name, often includes a bullish CD leg before the price reaches its Potential Reversal Zone (PRZ).
The structure began with a strong rally from point A around $0.3237 to point B near $0.5090, followed by a retracement to point C at $0.3702, where buyers stepped back in. Since then, ARB has rebounded and is now trading around $0.4680, signaling that the CD leg is firmly underway.
Harmonic projections suggest the CD leg could extend toward the 1.236 Fibonacci extension of the BC leg, putting the PRZ around $0.5456. If achieved, this would mark an approximate 18% upside from current levels.
What’s Next for ARB?
Momentum remains tilted toward the bulls. A sustained push toward $0.5456 would complete the ABCD pattern, but that zone could also act as significant resistance, prompting some traders to secure profits.
On the downside, ARB must hold above its 25-day moving average, currently near $0.4315. A breakdown below this level could weaken the bullish case and potentially lead to a deeper consolidation phase.
#Highlights #everyone #BinanceSquareFamily #Binance #ARB #SUBROOFFICIAL
Disclaimer: This article is for informational purposes only and does not constitute financial advice. Always conduct your own research before making any investment decisions. Digital asset prices are subject to high market risk and price volatility. The value of your investment may go down or up, and you may not get back the amount invested. You are solely responsible for your investment decisions and Binance is not available for any losses you may incur. Past performance is not a reliable predictor of future performance. You should only invest in products you are familiar with and where you understand the risks. You should carefully consider your investment experience, financial situation, investment objectives and risk tolerance and consult an independent financial adviser prior to making any investment.
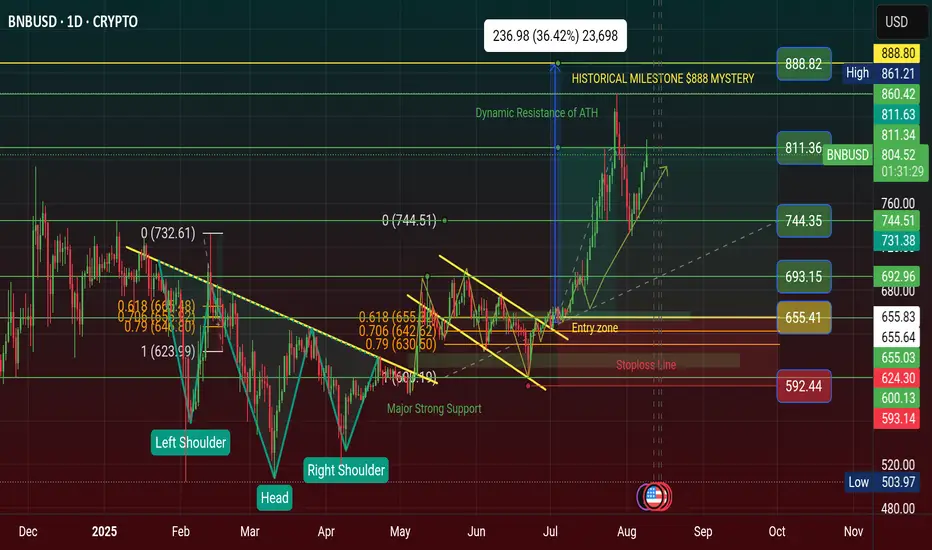
$BNB Finally Profit Done $811 & Road to $888-$1K Mystery in 2025CRYPTOCAP:BNB Finally Profit Done $811 & Road to $888-$1K in 2025. BNB price now Dynamic Resistance Area. Price will hit $888 - $1K if Breakout ATH of this month it will be happened. BNB price now Resistance area $863 of ATH and Weekly Time Fream Breakouts to $888 Mystery of Historical Milestone.
Breaking: Binance Taps Spain’s BBVA Bank to Custody Crypto, BNB Price Soars
BNB Price Rises 3%
BNB price jumped nearly 3% in the past 24 hours, with the price trading at $790 during writing. The 24-hour low and high were $765.52 and $790.98, respectively.
Furthermore, the trading volume saw a more than 25% increase in the last 24 hours, indicating a significant rise in interest among traders. It happened amid a broader crypto market recovery.
Popular analyst Ali Martinez, in an X post, predicted BNB price to move higher as it is in the discovery phase after hitting a new ATH. It also has one of the strongest year-to-date performances.
Traders’ confidence in BNB remained high as it resisted market volatility, while other crypto assets were down 20-40% after hitting ATH this year.
In the daily timeframe, the price was moving comfortably above the 50-SMA, 100-SMA, and 200-SMA at the time of writing.
Whereas, the Relative Strength Index (RSI) climbed to 58.08, signaling potential for a further upside move to $900.
CoinGlass data showed mixed trading activity in the derivatives market. At the time of writing, the total BNB futures open interest jumped more than 1.30% to $585.69 million in the last 24 hours.
However, 4-hour BNB futures open interest on Binance and OKX were down 0.02, 0.30%, but increased by 0.72% on Bybit.
This signals that derivatives traders remain cautious over a sudden rally in BNB price.
#highlight #everyone #BinanceSquareFamily #Binance #ETH #SUBROOFFICIAL
Disclaimer: This article is for informational purposes only and does not constitute financial advice. Always conduct your own research before making any investment decisions. Digital asset prices are subject to high market risk and price volatility. The value of your investment may go down or up, and you may not get back the amount invested. You are solely responsible for your investment decisions and Binance is not available for any losses you may incur. Past performance is not a reliable predictor of future performance. You should only invest in products you are familiar with and where you understand the risks. You should carefully consider your investment experience, financial situation, investment objectives and risk tolerance and consult an independent financial adviser prior to making any investment.
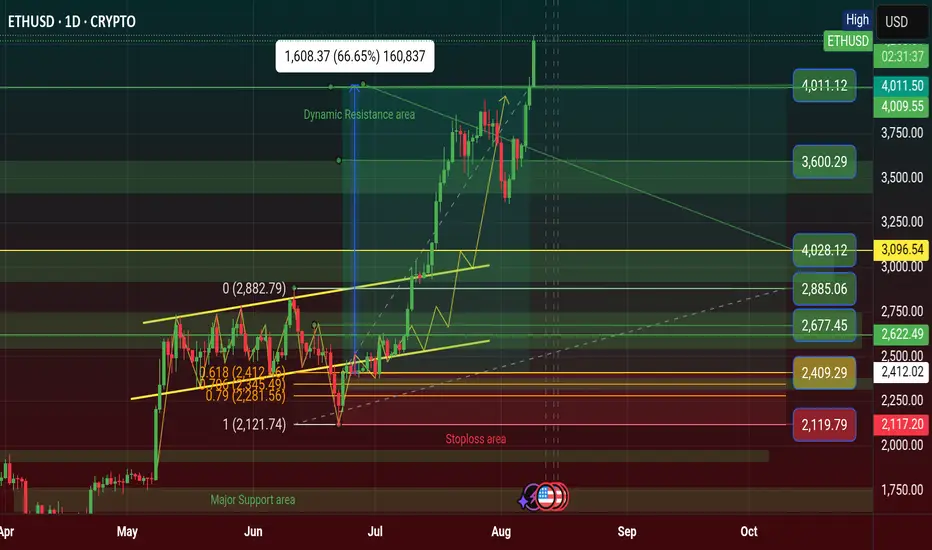
$ETH Finally $4,011 Profit Done Again, Breakout $4K price areaIf CRYPTOCAP:ETH price will be touch $4.5K and it's Breakout it will be happened $5K of new historical ATH.
Ethereum Price Target $4K as Trader Plans Partial Exit
Ethereum Maintains Market Leadership
The Ethereum Price Target $4K narrative is gaining traction as ETH continues to outperform the broader crypto market. Despite volatility, Ethereum’s resilience and strong fundamentals have kept it at the forefront of investor attention.
One experienced trader noted that ETH is “still the strongest asset in the crypto market,” following their lower time frame (LTF) plan closely. They believe the market could be nearing a local top, potentially with a brief spike — or deviation — above the $4,000 level.
Planned Exit Strategy Between $4K and $4.3K
The trader shared a specific strategy: selling 50% of their spot Ethereum holdings between $4,000 and $4,300. This position has been held for nearly two years, with an average entry price of around $2,400, meaning the planned sale would lock in substantial profits.
Such an approach reflects disciplined risk management — capturing gains after a strong rally while maintaining exposure in case the trend continues higher.
What This Means for the Market
If Ethereum does approach the $4K–$4.3K range, several scenarios are possible:
A deviation above $4K followed by a retracement could confirm a local top.
Sustained momentum beyond $4.3K could signal a stronger-than-expected breakout.
Broader crypto market sentiment will likely play a major role in price direction.
With ETH’s fundamentals stronger than ever and network upgrades continuing, the medium- to long-term outlook remains bullish — even if short-term corrections occur.
#highlights #BinanceSquareFamily #Binance #ETH #SUBROOFFICIAL
Disclaimer: This article is for informational purposes only and does not constitute financial advice. Always conduct your own research before making any investment decisions. Digital asset prices are subject to high market risk and price volatility. The value of your investment may go down or up, and you may not get back the amount invested. You are solely responsible for your investment decisions and Binance is not available for any losses you may incur. Past performance is not a reliable predictor of future performance. You should only invest in products you are familiar with and where you understand the risks. You should carefully consider your investment experience, financial situation, investment objectives and risk tolerance and consult an independent financial adviser prior to making any investment.
$BTC Finally Historical Profit Done at $122K & Now $123K of ATH CRYPTOCAP:BTC tying to push price upward movement and if it's Breakout the $120K-$122K Price Level area than it could be reached $128K - $136K price level area.
I'm guess it will be happened. Always Pattern indicate and say price movement of Bitcoin. I was many Prediction of popular coin and i will succeed in 2025. I'm long term analyst of long term investment of Traders.
🚦From News: Bitcoin Holds Firm Above $115K Support as Charts Point Toward $150K Target
Bitcoin holds above $115K support with charts pointing to a potential $150K Elliott Wave target.
Hashrate hits all-time high as energy value model places BTC valuation 45% above current price.
U.S. policy shift enables 401(k) crypto access, opening a $9 trillion market for Bitcoin adoption.
Bitcoin has held firm above the $115,000 support and is now showing signs of a large move on the charts. Price patterns and rising adoption trends are aligning as BTC prepares for a possible rally. At the time of writing, BTC was trading at $116,620, showing steady upward momentum.
Technical Structure Points Toward Upside Continuation
According to an analysis prepared by Lau, Bitcoin has taken the $115,000 support and may be preparing to break its all-time high. On Binance, the BTC/USDT daily chart displays a breakout from resistance near $116,438.79. The price reached a new high before retracing to $111,917.37, where it found support.
BTC’s price structure continues to show higher lows, aligning with the Elliott Wave pattern that targets $150,000. Key support levels remain at $98,385.45 and $89,326.51, confirming a strong technical base. According to Daan Crypto Trades, Bitcoin is steadily rising toward the $120,000 zone, where a cluster of stop losses and liquidation points may fuel further upside.
The current bullish flag formation is still intact, supported by the 50-day SMA at $113,154. The RSI has moved to 54, indicating recovering momentum without being overbought. Analysts view a break above $117,350 as a key signal for another upward push.
On-Chain Metrics and Market Drivers Support Growth
Bitcoin’s energy value stands at $167,800, which is around 45% above the current market price. According to Charles Edwards, founder of Capriole Investments, “Hash rates are flying and Bitcoin Energy Value just hit $145K.”
This model links BTC’s value to miner energy inputs and network security. Bitcoin’s hashrate reached an all-time high of 1.031 ZH/s on August 4, based on data from Glassnode. Alongside this, adoption is growing in the U.S. market.
President Trump’s policy allowing 401(k) crypto inclusion has opened a $9 trillion market. Crypto-linked equities and ETFs have also seen strong inflows, supporting long-term price action.
#highlights #everyone #premium #BinanceSquareFamily #Binance #BTC☀ #SUBROOFFICIAL
Disclaimer: This article is for informational purposes only and does not constitute financial advice. Always conduct your own research before making any investment decisions. Digital asset prices are subject to high market risk and price volatility. The value of your investment may go down or up, and you may not get back the amount invested. You are solely responsible for your investment decisions and Binance is not available for any losses you may incur. Past performance is not a reliable predictor of future performance. You should only invest in products you are familiar with and where you understand the risks. You should carefully consider your investment experience, financial situation, investment objectives and risk tolerance and consult an independent financial adviser prior to making any investment.

$BTC Finally Historical Profit Done at $123K Price of ATH CRYPTOCAP:BTC tying to push price upward movement and if it's Breakout the $120K-$122K Price Level area than it could be reached $128K - $136K price level area.
I'm guess it will be happened. Always Pattern indicate and say price movement of Bitcoin. I was many Prediction of popular coin and i will succeed in 2025. I'm long term analyst of long term investment of Traders.
🚦From News: Bitcoin Holds Firm Above $115K Support as Charts Point Toward $150K Target
Bitcoin holds above $115K support with charts pointing to a potential $150K Elliott Wave target.
Hashrate hits all-time high as energy value model places BTC valuation 45% above current price.
U.S. policy shift enables 401(k) crypto access, opening a $9 trillion market for Bitcoin adoption.
Bitcoin has held firm above the $115,000 support and is now showing signs of a large move on the charts. Price patterns and rising adoption trends are aligning as BTC prepares for a possible rally. At the time of writing, BTC was trading at $116,620, showing steady upward momentum.
Technical Structure Points Toward Upside Continuation
According to an analysis prepared by Lau, Bitcoin has taken the $115,000 support and may be preparing to break its all-time high. On Binance, the BTC/USDT daily chart displays a breakout from resistance near $116,438.79. The price reached a new high before retracing to $111,917.37, where it found support.
BTC’s price structure continues to show higher lows, aligning with the Elliott Wave pattern that targets $150,000. Key support levels remain at $98,385.45 and $89,326.51, confirming a strong technical base. According to Daan Crypto Trades, Bitcoin is steadily rising toward the $120,000 zone, where a cluster of stop losses and liquidation points may fuel further upside.
The current bullish flag formation is still intact, supported by the 50-day SMA at $113,154. The RSI has moved to 54, indicating recovering momentum without being overbought. Analysts view a break above $117,350 as a key signal for another upward push.
On-Chain Metrics and Market Drivers Support Growth
Bitcoin’s energy value stands at $167,800, which is around 45% above the current market price. According to Charles Edwards, founder of Capriole Investments, “Hash rates are flying and Bitcoin Energy Value just hit $145K.”
This model links BTC’s value to miner energy inputs and network security. Bitcoin’s hashrate reached an all-time high of 1.031 ZH/s on August 4, based on data from Glassnode. Alongside this, adoption is growing in the U.S. market.
President Trump’s policy allowing 401(k) crypto inclusion has opened a $9 trillion market. Crypto-linked equities and ETFs have also seen strong inflows, supporting long-term price action.
#highlights #everyone #premium #BinanceSquareFamily #Binance #BTC☀ #SUBROOFFICIAL
Disclaimer: This article is for informational purposes only and does not constitute financial advice. Always conduct your own research before making any investment decisions. Digital asset prices are subject to high market risk and price volatility. The value of your investment may go down or up, and you may not get back the amount invested. You are solely responsible for your investment decisions and Binance is not available for any losses you may incur. Past performance is not a reliable predictor of future performance. You should only invest in products you are familiar with and where you understand the risks. You should carefully consider your investment experience, financial situation, investment objectives and risk tolerance and consult an independent financial adviser prior to making any investment.

The TradingView Digest - April 8thHey everyone! Welcome back to the TradingView Weekly Digest. In today’s edition, we’re highlighting the top ideas from our community, which includes a write-up on Tesla, an informative post about Keltner channels and Bollinger bands, a hot script on trailing stop management, and all the latest headlines, earnings, and economic events.
We hope you find this week's edition exciting and engaging. Let's dive in! 😀
💡 Tesla Stock Down 30% This Year. What Happened to the EV King? - by TradingView
The electric-car maker is in dire need of charging after losing more than $260 billion this year and turning Elon Musk into the biggest loser among the world’s wealthiest. Tesla stepped into 2024 as the world’s largest EV seller with a valuation of more than $780 billion. None of that is true today.
💡 Keltner Channels vs Bollinger Bands - by FXOpen
If you're a trader, you likely know that indicators are valuable tools for identifying trends and determining entry and exit points. Two popular indicators are Keltner Channels and Bollinger Bands. Both help measure volatility, but which one is better? In this article, we'll delve into the differences between the two, explain their components, and discuss which one is best.
🔝 Top Stories
📰 U.S. March Nonfarm Payrolls +303K; Unemployment Rate 3.8%
📰 Johnson & Johnson to Buy Shockwave Medical in $13.1 Billion Deal
📰 Gold Shines Above $2,300, Ends Another Week At Record High
📰 Solar Eclipse On April 8 Could Give Whopping $1.5 Billion Boost To Businesses
📰 New users flock to Ethereum while long-term holders are less active than ever
💵 Earnings highlights from the previous week:
💲 Levi Strauss (LEVI) Q1 Earnings and Revenues Surpass Estimates
💲 BlackBerry reports surprise profit on demand for cybersecurity services
💲 Conagra (CAG) Q3 Earnings Beat, Organic Sales Decline Y/Y
💲 Lamb Weston (LW) Q3 Earnings Lag Estimates, Guidance Lowered
💲 Greenbrier 2Q Revenue Declines But Beats Wall Street's Forecast
💡 Nvidia - Entering a Bear Phase! - by basictradingtv
For more than 6 years, Nvidia stock has been trading in a long-term rising channel formation. The last retest of support occurred in 2021, followed by a +650% rally to the upside. As of now, Nvidia stock is retesting the upper resistance of the channel, and we might see a short-term correction towards the downside to retest the previous all-time high.
💡 Don't Get Duped by the RSI - by ParabolicP
The Relative Strength Index (RSI) is a common technical analysis tool used by traders to gauge whether an asset is overbought (priced too high) or oversold (priced too low). It analyzes price movements over a specific period (often 14 days) and displays a score between 0 and 100. Generally, an RSI above 70 suggests an overbought condition, while an RSI below 30 suggests an oversold condition.
📆 Economic Calendar
⚡️ April 10th (United States) — Core Inflation Rate YoY
⚡️ April 10th (United States) — Inflation Rate YoY
⚡️ April 10th (United States) — FOMC Minutes
⚡️ April 12th (United States) — Michigan Consumer Sentiment Prel
⚡️ April 16th (China) — GDP Growth Rate YoY
🔥 What's New?
✅ New chart type — Volume candles
🌟 Script of the Week
📜 Trailing Management - by Zeiierman
This tool provides an automated and visual approach to trailing stop management, aiding in systematic decision-making for trade entries and exits based on risk-reward metrics.
💭 Our Weekly Thought:
“The trend is your friend.”
We hope you found this helpful. Please share your feedback, remarks, or suggestions with us in the comments below.
💖 TradingView Team
📣 Want to be among the first to know all the news? Give us a follow !

The TradingView Digest - April 3rdHey there! Welcome back to the TradingView Weekly Digest. We are thrilled to announce the successful conclusion of our first-ever paper trading competition - The Leap ! With immense joy, we share that over 90,000 traders enthusiastically participated, executing a staggering 2,700,000 trades and securing an impressive $119 million in profits. Heartiest congratulations to all the winners, and our sincere gratitude to every participant for their overwhelming love and support.
In this edition, we’re excited to spotlight the top posts and ideas from our community. This includes an informative post on using stop-loss orders , a write-up on trading symmetrical triangle patterns , a hot script on volumes , and all the latest headlines , earnings , and economic events .
We hope you find this week's edition exciting and engaging. And don't forget to participate in our Bitcoin halving contest for a chance to win our exclusive T-shirt. Without further ado, let's dive right in! 😀
💡 How to Use Stop Loss Orders in Trading? - by TradingView
In trading, reducing risks is oftentimes all that matters to achieving success. One of the essential tools to protect your investments from steep or unexpected losses is the stop loss order. Understanding how to use stop loss orders can unlock your path to profitability by allowing you to balance your risk and reward ratio.
💡 A Comprehensive Guide to Fibonacci Retracements - by XForceGlobal
Fibonacci Retracements are a set of ratios defined by the mathematically important Fibonacci sequence. This allows traders to identify key levels of support and resistance for price action. The Fibonacci retracement tool, although widely used by many traders, is almost always not correctly used by new traders.
💡 Bitcoin Halving Contest: Time’s Ticking, But When’s It Kicking? - by TradingView
Buckle up, crypto enthusiasts! The Bitcoin Halving is on the horizon, and the countdown has begun. But here’s the twist - every Bitcoin clock out there is telling a different time for when block 840,000 will hit the scene. It’s like they’re all watching different episodes of the same thrilling show. 🍿
🔝 Top Stories
📰 Japan Manufacturers Sentiment Deteriorated for First Time in Four Quarters
📰 AMC Shares Drop 14% to Hover Near Record Lows After Filing to Sell $250M of Stock
📰 Reddit Stock Can’t Get Off the Volatility Train After Another Double-Digit Drop
📰 Bitcoin Halving Countdown: BTC Skyrockets to $71,000 Amidst Market Anticipation
📰 SEC May Delay Ethereum ETF Until December: Bitwise
💵 Earnings highlights from the previous week:
💲 McCormick (MKC) Q1 Earnings & Sales Top Estimates, Grow Y/Y
💲 GameStop Q4 Earnings Highlights: Retail Favorite Stock Plunges After Revenue, EPS Miss
💲 Compared to Estimates, Carnival (CCL) Q1 Earnings: A Look at Key Metrics
💲 Jefferies Financial Group Fiscal Q1 Earnings, Revenue Rise; Dividend Maintained
💲 Walgreens Sees Steep Loss After Major Write-Down of Clinic Operator VillageMD
💡 How To Trade A Symmetrical Triangle Break-Out - by TVM_MENA
A symmetrical triangle is a geometric formation found in technical analysis, often appearing during periods of market consolidation. It's characterized by converging trendlines, typically drawn by connecting a series of lower highs and higher lows. This pattern reflects a balance between buyers and sellers, signaling indecision in the market regarding the future price direction.
💡 Bitcoin Heading Below 20K is A Good Thing! - by WicktatorFX/
This one is a bit of a hack but follows on from my video on how to set 'Stop Losses' on TradingView for Connected Brokers. To set a trailing stop loss, you need to open your broker account, place the trade there, and it will then be reflected on the TradingView interface.
📆 Economic Calendar
⚡️ April 3rd (United States) — Fed Chair Powell Speech
⚡️ April 5th (Canada) — Unemployment Rate
⚡️ April 5th (United States) — Non Farm Payrolls
⚡️ April 5th (United States) — Unemployment Rate
🔥 What's New
✅ New launch: predict market activity with unerring accuracy
✅ Scan your watchlists in Stock, ETF, and Crypto Coins screeners
🌟 Script of the Week
📜 Periodic Activity Tracker - by LuxAlgo
This tool visualizes cumulative buy and sell volume for user-defined periods, offering insights into volume dynamics with customizable options.
💭 Our Weekly Thought:
“ Weak traders focus on results - Strong traders focus on process. ”
We hope you found this helpful. Please share your feedback, remarks, or suggestions with us in the comments below.
💖 TradingView Team
📣 Want to be among the first to know all the news? Give us a follow!

HOW-TO: Trade-o-Scope Highlight IntervalsThis is a short HOW-TO on using the Trade-o-Scope "Highlight Intervals" indicator

The TradingView Digest - March 25thHey everyone! Welcome back to the TradingView Weekly Digest. In today’s edition, we’re highlighting the top ideas from our community, which includes a video tutorial on customizing TradingView charts, an informative post about Reddit, a hot script on price gaps, and all the latest headlines, earnings, and economic events.
We hope you find this week's edition exciting and engaging. Let's dive in! 😀
💡🎥 TradingView Masterclass: Create your perfect chart - by TradingView
Dive into this video for a hands-on masterclass on TradingView's chart settings, created just for you! From the general themes to the smallest details, you'll learn how to fully customize your charts to match your unique trading style and preferences. Discover how to access and adjust every aspect of your charts, making sure they look, present data, and integrate trading features exactly how you want.
💡 Reddit Braves Wall Street with 48% Pop in Debut. When Growth? - by TradingView
Reddit stepped into the public-market space this week with a flashy and splashy IPO in New York that chalked up a 48% gain on its debut day. The listing was met with lots of cheer from Wall Street as it was the biggest one for a social media company since Pinterest hit exchanges in 2019.
🔝 Top Stories
📰 Federal Reserve Holds Interest Rates Steady but Projects Three Cuts This Year
📰 Sterling Tumbles 2% to $1.2580 After Bank of England Keeps Rates Steady
📰 Apple Stock Wipes Out Over $100 Billion in Value After US Files iPhone Monopoly Lawsuit
📰 Reddit Stock Pops 38% Out of the Gate to Trade at $47 a Share at $9 Billion Valuation
📰 Bitcoin Powers Up by 12% to $68K After Jay Powell Upholds Rate-Cut Timeline
💵 Earnings highlights from the previous week:
💲 PDD Holdings soars on Q4 results beat
💲 Micron Posts Surprise 2Q Profit as Recovery Continues
💲 Accenture Q2 Earnings Surpass Estimates, Revenues Miss
💲 NIKE Q3 Earnings Surpass Estimates, Revenues Up Y/Y
💲 FedEx Posts Strong Quarterly Results
💡 Options Blueprint Series: Strangles vs. Straddles - by traddictiv
Among the plethora of strategies, the Strangle holds a unique position, offering flexibility in unclear market conditions without the upfront costs associated with more conventional approaches like the Straddle. This article delves into the intricacies of the Strangle strategy, emphasizing its application in trading Gold Futures.
💡🎥 How to Set a Trailing Stop Loss on TradingView - by zAngus
This one is a bit of a hack but follows on from my video on how to set 'Stop Losses' on TradingView for Connected Brokers. To set a trailing stop loss, you need to open your broker account, place the trade there, and it will then be reflected on the TradingView interface.
📆 Economic Calendar
⚡️ March 26th (United States) — Durable Goods Orders MoM
⚡️ March 28th (United Kingdom) — GDP Growth Rate YoY Final (Q4)
⚡️ March 28th (United States) — GDP Growth Rate QoQ Final (Q4)
⚡️ March 29th (United States) — Core PCE Price Index YoY
⚡️ March 29th (United States) — Fed Chair Powell Speech
⚡️ March 31st (China) — NBS Manufacturing PMI
🔥 What's New
Just a few minor tweaks last week, but fear not ... We continue working hard 👷🏽 to make the platform even better.
🌟 Script of the Week
📜 Gaps Profile - by vnhilton
The script displays remaining unclosed gaps on the chart, helping you recognize shifts in market sentiment and pinpoint potential supply/demand zones.
💭 Our Weekly Thought:
“ Sometimes the best trades are the ones you did not take. ”
We hope you found this helpful. Please share your feedback, remarks, or suggestions with us in the comments below.
💖, TradingView Team
📣 Want to be among the first to know all the news? Give us a follow!

The TradingView Digest - March 19thHello everyone! Welcome back to the TradingView Weekly Digest. We’re thrilled to bring you even more reasons to stay connected with the TradingView account. As part of our commitment to constantly evolve and improve our offerings for you, our dedicated users, this edition includes a special “What’s New “ section. In it, we explore the latest enhancements and additions to our platform, ensuring you're always up-to-date with our most recent advancements.
In today’s roundup, we’re excited to showcase the top posts from our vibrant community. Highlights include an insightful article on the history of Bitcoin, a trading strategy based on the Fibonacci tool, a new script for visualizing your equity curve, along with all the latest headlines, earnings reports, and economic events.
We hope you find this week's edition informative and engaging. Let's dive in! 😀
💡 History of Bitcoin: The Underdog That Rewired Finance - by TradingView
Bitcoin, a phenomenon that emerged at the onset of the 2008 financial crisis, has changed the way we think about money. To celebrate the token’s $73,000 milestone, we trace its origin story and look ahead into the future. To infinity… and beyond?
💡 Fibonacci Trading Strategy For Beginners - by VasilyTrader
I am excited to reveal a powerful Fibonacci trading strategy that I learned many years ago. It integrates structural analysis, Fibonacci retracement and extension levels, and candlestick analysis. When applied correctly, this strategy has the potential to yield a winning rate of over 60%.
📰 Top Stories
Adobe Stock Crashes 12% on Weak Guidance, Net Income Slashed in Half to $620M
China's Central Bank Keeps Key Policy Rates Steady
SOL, BOME Trend on Social Media as Ether, Bitcoin Lag
Nissan, Honda Shares Rise Sharply After EV Tie-Up Plan
Apple in talks to let Google's Gemini power iPhone AI features, Bloomberg News says
💵 Earnings highlights from the previous week:
Dollar Tree's Fiscal Q4 Adjusted Earnings, Revenue Rise
Williams-Sonoma's (WSM) Stock Up on Q4 Earnings & Revenue Beat
UiPath (PATH) Q4 Earnings and Revenues Beat Estimates
KT reports record-high earnings in 2023
MorphoSys AG reports results for the quarter ended in December
💡 When will Bitcoin Reach the Cycle Top - by FieryTrading
In this analysis, I am providing an educated estimation for the timeframe within which Bitcoin may reach its peak during this cycle. You can observe Bitcoin's price movements spanning the past 13 years depicted on a 2-week chart. Essentially, it typically takes between 17 to 24 bars (equivalent to 34 to 48 weeks) before Bitcoin reaches its cycle peak, with an average duration of 20 bars.
💡 Help Shape the Future of TradingView Content - by TradingView
Hello, TradingView community! As we continue to grow and evolve, our commitment to providing value to our users remains paramount. At TradingView, we understand that our users are at the heart of everything we do. This is why we constantly strive to offer content that enriches your trading experience, empowers your decisions, and nurtures your growth as a trader.
📆 Economic Calendar
⚡️ 19th March (Japan) — BoJ Interest Rate Decision
⚡️ 19th March (Canada) — Inflation Rate YoY
⚡️ 20th March (United States) — Fed Interest Rate Decision
⚡️ 20th March (United States) — FOMC Economic Projections
⚡️ 21th March (United Kingdom) — BoE Interest Rate Decision
⚡️ 22nd March (Japan) — Inflation Rate YoY
🔥 What's New?
✅ JFX forex data — now accessible on TradingView
✅ Enhancing DeFi trading: TradingView partners with QuickSwap
✅ Improved data of BIST futures: make use of settlement prices, back-adjustment, and Open interest
✅ Chart view in Stock, ETF, and Crypto coins screeners
🌟 Script of the Week
📜 Risk Management Chart - by NoveltyTrade
This script simulates multiple equity curves based on user-defined win-loss and risk-reward parameters, allowing visualization and analysis of risk management strategies.
💭 Our Weekly Thought:
“ Plan the trade, see the trade, feel the trade. ”
We hope you found this helpful. Please share your feedback, thoughts, or suggestions with us in the comments below.
With 💖, TradingView Team
📣 Want to be among the first to know all the news? Give us a follow!

The TradingView Digest - March 12thHey everyone! Welcome back to the TradingView Weekly Digest. In today’s edition, we’re highlighting the top posts from our community, which includes a video tutorial on our newly revamped screener tool, an informative post about portfolio diversification, a hot script on tick data, and all the latest headlines, earnings, and economic events.
💡 Diversification: What It Is, Why It Matters & How to Do It - by TradingView
Portfolio diversification is the strategy of spreading your money across diverse investments in order to mitigate risk, hedge and balance your exposure in pursuit of uncorrelated returns. While it may sound complex at first, portfolio diversification could be your greatest strength when you set out to trade and invest in the financial markets.
💡🎥 TradingView Screener 2.0 - by zAngus
The TradingView Screener was what initially led me to use TradingView. It allows me to quickly and easily filter thousands of stocks down to just a handful that meet my criteria. No matter your preferred trading style - whether it's based on technicals, fundamentals, indicators, price action, RSI, MACD, volume, etc. - the TradingView Screener can quickly help you narrow down any stocks that meet your criteria.
📰 Top Stories
U.S. Feb Nonfarm Payrolls +275K; Unemployment Rate 3.9%
SMCI: Super Micro Stock Jumps 3% on Upgrade. Here’s Why Shares are Up 10X in One Year.
XAU/USD: Gold Shines Bright to Record High of $2,160 as Central Banks Stack Up
BTC/USD: Bitcoin Cools Off After Knocking Out Fresh All-Time High Above $69,000, Smashing 2021 Record
CPI, Rates and Other Key Things to Watch This Week
💵 Earnings highlights from the previous week:
America's Car-Mart (CRMT) Reports Q3 Loss, Misses Revenue Estimates
Silvercrest Asset Management Group Inc. Reports Q4 and Year-End 2023 Results
Amplify Energy (AMPY) Q4 Earnings and Revenues Surpass Estimates
Algonquin Powers Up In Q4 But Skips Guidance On Uncertainty Over Renewables Sale
Paysafe Shares Slip 14% on Surprise 4Q Loss
💡 A Simplified Model for Bubbles - by holeyprofit
Understanding the phases of a bubble and crash is not as grandiose a claim as it's made out to be. My idea that bubbles and pops can be understood is based on my opinion that various TA methods do a good job of explaining trend development. When major bubbles and pops are viewed in hindsight, they exhibit obvious fingerprints of bull/bear trend development.
💡 Bitcoin is Still Behaving like a Risk Asset - by Tradersweekly
After reaching a new all-time high last week, Bitcoin underwent a mini flash crash, erasing more than 14% within a few hours but soon recovered. The number of Bitcoin addresses with balances exceeding 1,000 BTC slightly increased, while those with balances exceeding 100 BTC dropped slightly.
🌟 Script of the Week
📜 Order Chain - by Kioseff Trading
This indicator utilizes live tick data to visualize volume dynamics in real-time.
💭 Our Weekly Thought:
“ The trend is your friend. ”
We hope you found this helpful. Please share your feedback, comments, or suggestions with us in the comments below.
TradingView Team
📣 Want to be among the first to know all the news? Give us a follow!

The TradingView Digest - March 5thHey everyone! Welcome back to the TradingView Weekly Digest. In today’s edition, we’re highlighting the top posts from our community, which includes a video tutorial on “The Leap” - our first ever paper trading competition, an informative post about Nvidia’s euphoric rise, and all the latest headlines, earnings, and economic events.
💡🎥 The Leap - Win up to $10,000 - by TradingView/
We’re spinning up the first-of-its-kind trading competition and you’re all welcome to join! Traders, speculators, active investors and even the FX gurus on Instagram and the “live like me” trading influencers — this one’s for you all. Show us what you’re made of in our first-ever paper trading competition, The Leap. The Top 5 get to walk away with real cash. From first to fifth, prizes are as follows: $10,000, $5,000, $3,000, $2,000 and $1,000.
💡🎥 Why Central Banks are Buying Gold - by konhow
While many of us celebrate the stock markets reaching new highs, central banks worldwide are actively purchasing gold and institutions are hedging into treasuries to secure yields. It's important to note that interest rates are determined by central banks, while yields are determined by investors.
📰 Top Stories
Elon Musk vs. Everyone: The New Fight in AI
How the U.S. economy could slide into a Japan-like 'lost decade'
Nvidia Stock Soars on Meta AI Deal
Lockheed Martin Gets $663.1 Million Contract Modification from U.S. Department of Defense
Breaking: BlackRock Bitcoin ETF Overtakes the Largest Silver Trust with MUN:10B AuM
💵 Earnings highlights from the previous week:
Dell Stock Pops 20% on Earnings Beat, Strong Guidance & Hot AI Servers Demand
Tidewater Q4 Earnings, Revenue Rise; Full-Year Revenue Guidance Reiterated
MasTec Q4 Adjusted Earnings Fall, Revenue Rises
Pactiv Evergreen Q4 Adjusted EPS Increases, Revenue Drops
FuboTV Reports Q4 Loss, Tops Revenue Estimates
💡 Nvidia’s Formidable Rise - by TradingView
Intense demand for Nvidia's AI chips increased the company's value to $2 trillion, with half of this growth occurring in less than four months. This demand significantly boosted Nvidia's stock price, making it one of the top three largest companies in America, right behind Apple and Microsoft.
💡 How to Trade Gaps - by ShaneBlankenship
There are several ways to trade gaps, but first, there should be a solid understanding of what gaps are and how they manifest. Markets aren't difficult to read if we have some simple methods to observe them that adhere to the principles of movement. A gap is the sudden supply/demand imbalance that arises from contraction and manifests as expansion.
🌟 Script of the Week
📜 Daily Chess Puzzles - by Lux Algo
This script delivers a new one-move chess puzzle to the chart every day.
💭 Our Weekly Thought:
“Not being stressed from a loss is the real flex.”
We hope you found this helpful. Please share your feedback, comments, or suggestions with us in the comments below.
TradingView Team
📣 Want to be among the first to know all the news? Give us a follow!

The TradingView Digest - February 27thThe TradingView Digest - February 27th
Hey everyone! Welcome back to the TradingView Weekly Digest. In today’s edition, we’re highlighting the top posts from our community, which includes a video tutorial on TradingView’s paper trading feature, an informative post about Bitcoin halving, a post on finding trade setups, and all the latest headlines, earnings, and economic events.
💡🎥 How-To: Use the TradingView Paper Trading feature - by TradingView
TradingView's Paper Trading isn't just for practice; it's a detailed educational platform that closely simulates the real trading environment, all without the risk of losing money. This feature is carefully crafted to mimic actual market scenarios, offering users a realistic preview of how their trading plans might fare.📖🧾
💡🎥 Understanding Momentum to find the Best Setups - by TradeTheStructure
In the video, I discuss how I analyze momentum using MACDs and 5-minute/1-minute charts for day trading. This approach helps me filter out the best setups, positioning myself strategically in the market and within the right trading zones. The key concepts covered in this video include momentum, price action, candle analysis, and multi-timeframe analysis.
📰 Top Stories
Nvidia Market Cap Hits $2 Trillion During Post-Earnings Rally
Google Halts Gemini's Image-Generation Over Bias
Does Bitcoin Halving Still Matter in 2024?
Home Buyers Are Back in the Market. They're Shrugging Off Higher Prices and Mortgage Rates
Riot Platforms boosted BTC output by 19% in 2023, mines 6,626 Bitcoin
💵 Earnings highlights from the previous week:
Warner Bros. Discovery's Q4 Net Loss Narrows, Revenue Declines
Berkshire Hathaway reports record cash as earnings pop in Q4
Block's Q4 Earnings Surge
American Software (AMSWA) Q3 Earnings and Revenues Beat Estimates
Mercedes' (MBGAF) Q4 Results, Buyback & EV Strategy in Focus
💡 What Is Bitcoin Halving? Here's All You Need to Know - by TradingView
Halving, a milestone event in the crypto space, occurs approximately every four years, reducing Bitcoin's mining rewards every 210,000 blocks. Satoshi Nakamoto, the individual or group that created Bitcoin, set a fixed limit of 21 million coins, ensuring that the total amount of Bitcoin can never go above that number.
💡 Bad News for USD Longs? - by FPMarkets
According to the US Dollar Index, dollar longs are under pressure. Despite technically still exhibiting an uptrend, there are signs of emerging technical weakness. Since topping at 104.97 in mid-February, just shy of the resistance at 105.04, price action has tunneled through support at 104.15 (now marked as resistance), in addition to channel support extended from the low of 100.62.
🌟 Script of the Week
📜 Percent Rank Histogram - by VanHe1sing
This script visually displays the percentage of historical data points that are less than or equal to the current value for multiple financial instruments.
💭 Our Weekly Thought:
“Good traders try to avoid losing money. Great traders accept they will lose money.”
We hope you found this helpful. Please share your feedback, comments, or suggestions with us in the comments below.
TradingView Team
📣 Want to be among the first to know all the news? Give us a follow!

Ethereum (ETH) falls below the important $2800 support zone – hoAt the start of February, we saw the entire crypto market rebound sharply. Ethereum (ETH) was one of the key performers and at one point, even got closer to $4000. But it has been a sharp fall ever since. More importantly, ETH has fallen below the crucial support zone of $2800. So, how far can bears take this? Here are some highlights:
ETH was trading at $ 2734 at press time, down about 5% in the last 24 hours
ETH has also fallen below the crucial 20-day exponential moving average
It is likely that the coin will fall to its next support of $2400 in the coming days.

$DCTH Mid Term Goals could put this over $1+ In Weeks - Repost -Reposting as it didn't post properly the first time
$DCTH Highlights for the first quarter of 2017 and the recent weeks include:
First quarter 2017 revenue of $0.74 million, an increase of 100% compared with revenue of $0.37 million in prior year quarter.
CHEMOSAT treatment milestone set by SPIRE Southampton Hospital in the U.K. with more than 100 CHEMOSAT treatments performed, including eight treatments on a single patient.
Announced a Special Protocol Assessment (SPA) agreement with the U.S. Food and Drug Administration (FDA) for the design of a pivotal trial of Melphalan/HDS to treat patients with intrahepatic cholangiocarcinoma (ICC).
The American Journal of Clinical Oncology published a single-center retrospective review finding that the Company’s investigational percutaneous hepatic perfusion (PHP) with Melphalan/HDS offered promising results with a doubling of overall survival (OS), significantly longer progression-free survival (PFS) and hepatic progression-free survival (hPFS) compared with other targeted therapies.
Favorable data from two institutions were presented at the Regional Cancer Therapies Symposium and showed strong tumor response and overall survival with the Company’s investigational PHP therapy in patients with ocular melanoma that metastasized to the liver.
“During the first three months of 2017 we continued to advance our clinical development programs in ocular melanoma liver metastases and intrahepatic cholangiocarcinoma, while making steady progress with commercialization of CHEMOSAT in Europe,” said Jennifer K. Simpson, Ph.D., MSN, CRNP President and CEO of Delcath."
“As we announced recently, we have concluded a new SPA agreement with the FDA for the initiation of a pivotal trial for the use of Melphalan/HDS in patients with ICC. This new trial will enroll approximately 295 ICC patients at about 40 clinical sites in the U.S. and Europe, with the primary endpoint of overall survival and with secondary and exploratory endpoints that include safety, progression-free survival, objective response rate and quality-of-life measures. The trial is designed to be cost-effective and conducted in a financially prudent manner, with modest investment in this fiscal year. In conjunction with the FOCUS Trial in ocular melanoma liver metastases, our clinical development programs now include two paths toward potential U.S. market approvals.
“In Europe, we continue to make steady progress with the commercialization of CHEMOSAT. Our first quarter revenue of more than $0.7 million was double the prior year period’s sales, driven primarily by national reimbursement in Germany under the ZE system. With coverage under the ZE system now in place, we expect product sales growth from this market for the remainder of 2017."
"Elsewhere in Europe, we continue to focus on building the clinical and pharmacoeconomic data to support reimbursement applications in other key markets. We expect that positive negotiations for coverage in Germany will support our efforts for payment levels in other markets such as the U.K. and the Netherlands. Securing reimbursement coverage in additional European markets remains critical to future revenue growth for CHEMOSAT,” concluded Dr. Simpson.
As of March 31, 2017, Delcath had cash and cash equivalents of $6.4 million, compared with $4.4 million as of December 31, 2016. During the first quarter of 2017, the Company used $3.8 million of cash to fund operating activities. Delcath believes it has sufficient capital and access to committed capital to fund its operating activities through the end of 2017.
Also check out this article, pretty good read:
insiderfinancial.com
