Gold (XAUUSD) May Repeat Recent Bullish Pattern of 12 Dec 2025Gold OANDA:XAUUSD May Repeat Recent Bullish Pattern 🔄
What Happened Before (Dec 12, 2025 - 5:41 AM PKT):
Gold formed a very specific pattern that caught my attention. After consolidating in a tight range, it exploded upward with strong momentum, rallying approximately 770 pips from 4,276 to 4,353
The price action showed clear accumulation before the breakout, with bulls stepping in decisively.
What's Happening Now:
Previous:
Here's where it gets interesting - Gold is forming an almost identical pattern at the current price level of 4,341.
The similarities are striking:
- Similar consolidation structure
- Comparable price compression
- Volume patterns showing accumulation
- Technical indicators aligning in the same way
My Expectation:
Based on this pattern repetition, I'm watching for a potential bullish move from 4,339 to 4,416 - roughly 770+ pips of upside.
Invalidation: A break below the consolidation zone would negate this setup
---
*Remember: Past patterns don't guarantee future results. Always use proper risk management and trade with a plan.*
History

LINK - Same Base, Same Question: Is Another Impulse Loading?📊LINK has been respecting a very clean long-term structure.
Each major sell-off has found support around the rising blue trendline, followed by a strong impulsive move higher. This behavior has repeated multiple times, creating a clear rhythm:
correction → base → impulse.🔁
Right now, price is once again sitting on that same structural support, right above the horizontal support zone. The market has slowed down, volatility has compressed, and sellers are losing momentum, conditions that often precede expansion.
The big question now is simple 🤔
Will LINK deliver another impulse from the same base?
⚔️As long as price holds above the trendline and support, the focus remains on trend-following bullish continuation. A clean reaction here keeps the structure intact. A decisive break below would invalidate the setup and change the narrative.
Patience matters here. Let price confirm its intent.
⚠️ Disclaimer: This is not financial advice. Always do your own research and manage risk properly.
📚 Stick to your trading plan regarding entries, risk, and management.
Good luck! 🍀
All Strategies Are Good; If Managed Properly!
~Richard Nasr

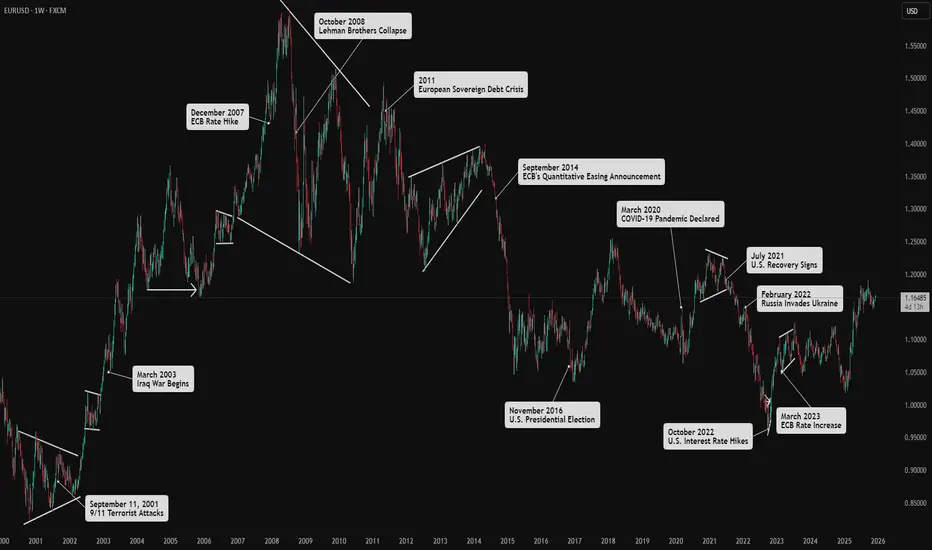
How Market Drivers Influence Forex PhasesI examined the key drivers and major players in the Forex market. Price patterns are a direct reflection of human psychology responding to significant events and the subsequent flow of institutional money. Therefore, understanding what influences overall market direction is crucial.
Above, you'll find a few historical events on the EUR/USD chart to analyze their effects on price movements.
Below is a brief overview of the four main drivers and the role of speculation in the Forex market.
******************
Key Triggers for Market Shifts
Market shifts in Forex are influenced by several key drivers. Grasping these drivers enables better identification of market phases and the price patterns that emerge within them.
Economic Health
Refers to consumers' financial stability and purchasing power.
A healthy consumer sector boosts economic growth and strengthens a country's currency.
Positive consumer sentiment leads to bullish currency trends, while negative sentiment results in bearish trends.
Monetary Policy
Central banks influence currency rates through interest rate policies.
Decisions regarding interest rates are high-impact news in Forex.
Central banks aim for maximum employment and inflation control, affecting currency value through their policies.
Fiscal Policy
Government expenditure on services and infrastructure impacts aggregate demand and GDP.
Increased spending can stimulate the economy, leading to currency appreciation.
However, if spending is funded by borrowing, it may lead to a higher budget deficit, causing loss of investor confidence and currency depreciation.
Political Stability
Refers to the reliability of a country's government and policies.
Stability encourages foreign investment and capital inflow, leading to currency appreciation.
Political unpredictability can deter investment and negatively impact currency value.
******************
Role of Speculation
Speculation from investors, based on perceived outcomes of these market drivers, creates volatility.
Major Market Players:
Investment Banks: The largest players in the Forex market, trading significant volumes between themselves and on behalf of clients like hedge funds and governments.
Hedge Funds: The third-largest players, trading pooled capital with long-term strategies.
Retail Traders: Although they contribute a high volume of transactions, their collective impact is smaller compared to institutional investors.
Speculation fuels volatility and price fluctuations.
Understanding these components helps identify patterns in the Forex market, leading to better trading strategies.
Bitcoin - Will History Repeat Itself Again?📈Bitcoin continues to follow a remarkably similar path to its previous market cycles. Each major bullish impulse has been followed by a controlled correction, a fakeout towards the lower trendline, and then a strong rebound toward new highs.
Looking closely at the current structure, BTC seems to be retesting the lower bound of its long-term rising channel, a pattern that played out multiple times before every major leg up.
⚔️If history repeats itself, this fakeout could mark the final shakeout before the next macro rally, with a potential reversal forming between late November and early January.
🏹From there, the next impulsive wave could push price toward the upper boundary of the channel, around the $150,000–$160,000 zone, aligning perfectly with Bitcoin’s long-term cyclical rhythm.
The big question remains: will history rhyme once again, or is this time different?
⚠️ Disclaimer: This is not financial advice. Always do your own research and manage risk properly.
📊All Strategies Are Good; If Managed Properly!
~Richard Nasr

SPY 2010 Flash CrashJust for peoples reference, on May 6, 2010 there was a flash crash. The dynamics may be helpful for today.

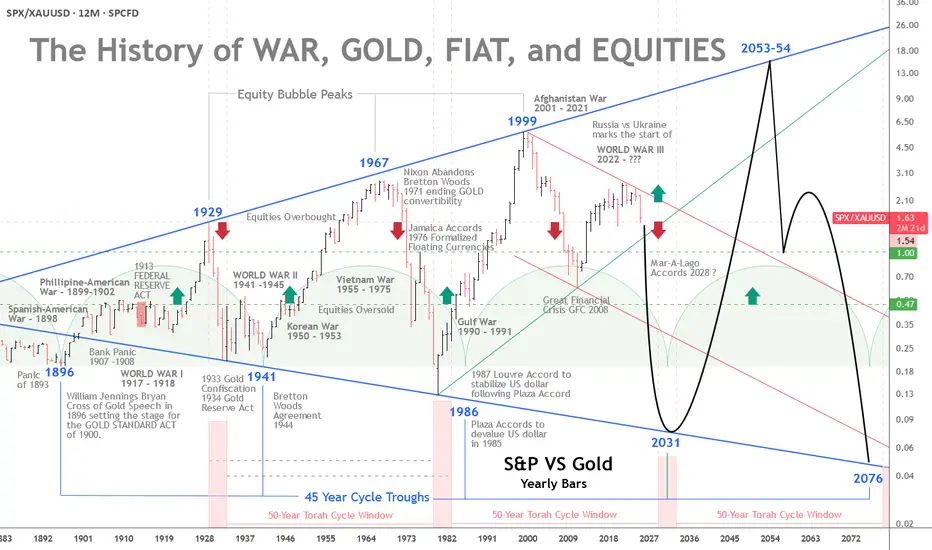
The History of War, Gold, Fiat, and EquitiesGold vs. Equities — The 45-Year Cycle and a Pending Monetary Reset
The interplay of war, gold, fiat money, and equities has long been a barometer of real wealth and economic stability. A recurring pattern emerges across modern history: approximately 45-year intervals when gold strengthens relative to equities.
From the Panic of 1893 to the present, these cycles have coincided with major monetary shifts and geopolitical shocks.
With a broadening 100-year pattern, rising geopolitical tension, and roughly $300 trillion in global debt, a monetary reset by the early 2030s is plausibly on the horizon.
The 45-Year Cycle — Gold’s Strength at Equity Troughs
The pattern’s first trough is traced to 1896, when William Jennings Bryan’s “Cross of Gold” speech preceded the Gold Standard Act of 1900. Equities were weak after the Panic of 1893, and gold gained prominence. Thirteen years later, the Federal Reserve would be created. More on the 45-year cycle later.
The 50-Year Jubilee Cycle
The Torah’s 50-year Jubilee cycle, as outlined in Leviticus 25:8–12, is a profound economic and social reset that follows seven 7-year Shemitah cycles, totaling 49 years, with the 50th year designated as the Jubilee.
Each Shemitah cycle concludes with a sabbatical year (year 7, 14, 21, 28, 35, 42, 49), during which the land rests, debts are released, and economic imbalances are addressed (Leviticus 25:1–7).
The Jubilee, occurring in the 50th year, amplifies this reset by mandating the return of ancestral lands, freeing of slaves, and further debt forgiveness, symbolizing a divine restoration of societal equity.
While built on the 49-year framework of seven Shemitahs, the 50th year stands distinct, marking a transformative culmination rather than a simple extension of the Shemitah cycle.
The five-year Jubilee windows highlighted at the base of the chart compliment the 45-year cycles previously noted. The 4 year Jubilee windows are projected from the roaring 20s peak in 1929 and the 1932 bear market low four years later.
The next Jubilee window is scheduled to occur some time between 2029 and 2031.
Returning to History and the 45-Year Cycles:
The Panic of 1907 and the Fed
The Panic of 1907 was a severe crisis, with bank runs, failing trust companies, and a liquidity crunch centered in New York. The collapse of copper speculators (F. Augustus Heinze and Charles W. Morse) triggered runs on institutions like the Knickerbocker Trust.
Private bankers led by J.P. Morgan injected liquidity (over $25 million) to stabilize the system. The shock exposed the absence of a lender of last resort and precipitated reforms.
Congress responded with the Aldrich–Vreeland Act (1908) and the National Monetary Commission, whose 1911 report recommended a central bank to supply “elastic currency.”
After debate and hearings, President Woodrow Wilson signed the Federal Reserve Act on December 23, 1913, creating a decentralized central bank with 12 regional banks.
Some alternative accounts (e.g., The Creature from Jekyll Island) argue that the panic was exploited to centralize financial control. Mainstream history, however, treats the panic as the genuine catalyst for reform.
Whatever the intent, the Fed’s creation shifted the tools available to manage crises—and, over time, central banks have played an instrumental role in financing wars and expanding Fiat currency.
The Fed and World War I
World War I began in Europe in 1914 (U.S. entry in 1917). The Fed began operations in November 1914 and later supported wartime financing by:
Marketing Liberty Bonds (~$21.5 billion raised, 1917–1919).
Providing low-interest loans to banks buying Treasury securities (via 1916-era amendments).
Expanding the money supply, which contributed to wartime inflation.
Although the Fed was created primarily to prevent panics and stabilize banking, its early role in war finance shifted expectations about central banking’s functions.
From Confiscation to Bretton Woods to the Nixon Shock
In 1933, during the Great Depression, the U.S. effectively nationalized gold—private ownership was outlawed, and the official price was later reset at $35/oz by the Gold Reserve Act of 1934. Private ownership remained restricted until President Ford legalized it again in 1974.
World War II and the Bretton Woods Agreement (1944) cemented gold’s role: the dollar became the anchor of the system, and other currencies pegged to it.
That status persisted until August 15, 1971, when President Nixon suspended dollar-gold convertibility—the “Nixon Shock”—moving the world toward fiat currencies.
The Petrodollar and Post-1971 Arrangements
After 1971, the U.S. worked to preserve dollar demand. The petrodollar system emerged in the early 1970s: following the 1973 oil shock, a U.S.–Saudi understanding (1974) helped ensure oil continued to be priced in dollars and that oil revenues were recycled into U.S. Treasuries—supporting the dollar’s global role despite its fiat status.
Devaluations, Floating Rates, and the End of Bretton Woods
Two formal “devaluations” followed the Nixon Shock:
Smithsonian Agreement (Dec 18, 1971): Raised the official gold price from $35 to $38/oz (an 8.57% change) as a stopgap attempt to stabilize fixed rates without restoring convertibility. It widened exchange banding but proved unsustainable.
On February 12, 1973, the official gold price was revalued to $42.22/oz (roughly a 10% change), a symbolic acknowledgment that Bretton Woods was collapsing. By March 1973, major economies had effectively moved to floating exchange rates, and market gold prices surged.
These moves were reactive attempts to adjust the dollar’s value amid trade deficits, inflation, and speculative pressures. They ultimately ushered in a fiat era, where market forces, not official pegs, set the price of gold.
Triffin’s Dilemma — Then and Now
Triffin’s Dilemma describes the structural tension faced by a reserve currency issuer: it must supply enough currency to ensure global liquidity (running deficits) while risking domestic instability and a loss of confidence.
Britain faced this under the gold standard; the U.S. faced it under Bretton Woods and again after 1971, albeit in a different form.
Modern manifestations include inflation, persistent fiscal and external deficits, and mounting debt. International policy coordination (e.g., the Plaza and Louvre Accords) repeatedly tried—and only partially succeeded—to manage these tensions.
The Plaza (1985) and Louvre (1987) Accords
Plaza Accord (Sept 22, 1985): G5 nations coordinated to depreciate the dollar (it had appreciated ~50% since 1980). The goal was to ease U.S. trade imbalances. The dollar fell substantially vs. the yen and mark by 1987.
Louvre Accord (Feb 22, 1987): G6 sought to stabilize the dollar after its rapid decline following the Plaza Accord, setting informal target zones and coordinating intervention. It temporarily checked volatility but did not solve underlying imbalances.
Both accords illustrate the extreme difficulty in balancing global liquidity needs with domestic economic health in a fiat system.
De-industrialization, Bubbles, and the Broadening Pattern
Orthodox history would argue that U.S. de-industrialization in the 1990s was rational at the time. Globalization and cost arbitrage provided short-term benefits, but they increased trade deficits, foreign dependency, and robbed the middle class of high-paying jobs. That loss of capacity heightens vulnerability to dollar shocks and complicates any re-industrialization efforts today.
Measured in gold, equities have experienced expanding ranges:
Equity peaks (1929, 1967, 1999) were followed by troughs where gold outperformed (1896, 1941, 1980/86).
Gold peaked in 1980, even though the cyclical trough in the broader pattern was nearer 1986—showing that cycles can shift.
The dot-com peak (1999) marked a secular low for gold relative to equities. The ensuing crashes, 9/11, and the War in Afghanistan, followed by the 2008–2009 Financial Crisis (GFC), moved markets profoundly—both nominally and in terms of gold.
From 1999, relative equity values fell until a trough around 2011 (coinciding with the European debt crisis). Quantitative easing and policy responses (2010 onward) restored growth, but frailties remained (e.g., repo market stress in 2018).
COVID produced another shock; aggressive fiscal and monetary responses engineered a V-shaped asset recovery but also higher inflation.
Relative to gold, equities peaked in 1999 and have trended lower since. As nominal stock prices register all-time-highs in dollars—fueled by AI and other themes—equities are historically overvalued. When priced against gold, the apparent bubble in nominal terms looks more like an extended bear market ready for its next down-leg.
The Broadening Pattern and the Next Trough
A broadening pattern illustrates the gold equity ratio range expanding with each major peak and trough. If we accept a roughly 45-year rhythm from the 1980/86 period, the next cyclical trough may fall between 2025 and 2031, with 2031 a focal point. Whether this manifests as a runaway gold price, a sharp equity collapse, or both remains uncertain.
If a sovereign-debt crisis or major war escalates, changes could accelerate—some scenarios even speculate about a negotiated new monetary framework (e.g., “Mar-A-Lago Accords”) in the next 5–15 years.
Geopolitics and the $300 Trillion Debt
Geopolitical tension compounds financial stress. The Russia-Ukraine war, plausibly the start of World War III, NATO involvement, and nuclear saber-rattling evoke systemic risk. Global debt—estimated at around $300 trillion (over 300% of GDP per the Institute of International Finance)—is unsustainable.
U.S. public debt (~$38 trillion) now carries interest costs comparable to defense spending.
Central bank money creation to service debt erodes confidence in fiat currencies and boosts demand for gold. Historical monetary resets (Bretton Woods, Nixon Shock) followed similar pressures of debt and conflict.
A modern reset could push gold well beyond current records—potentially into the high thousands or five-figure territory if confidence collapses.
Implications of a Pending Monetary Reset
A reset might take various forms:
A partial return to a gold-linked standard, perhaps supplemented by tokenized/digital assets.
Forced debt restructuring or coordinated global defaults.
Rapid adoption of digital currencies (including state-issued tokens—CBDCs) as part of a new settlement architecture.
Given Triffin’s Dilemma, inflated financial assets, and interconnected global linkages, a modern reset could be far larger in scale and speed than past adjustments. Assets, trade, and supply chains are far larger and more intertwined than in 1971, increasing contagion risk.
Practical takeaway: investors should consider gold’s role in portfolios; policymakers must confront debt sustainability or risk a market-driven reckoning that could disrupt global finance.
Conclusion
The Torah's 50-year Jubilee, the 45-year cycle and the century-long broadening pattern suggest we are approaching a structural turning point.
Triffin’s Dilemma, decades of accumulated imbalances, de-industrialization, and escalating geopolitical risk suggest a monetary reset is plausible between 2030 and 2035—possibly sooner under severe stress.
A modern reset would be more disruptive than past episodes because today’s global economy is larger, more integrated, and technologically complex. The question is not only whether such a reset will occur, but how policymakers and markets will manage it.
The stakes—global financial stability and the relative value of fiat versus real assets—could not be higher.
BTC - Are You Ready?Hello TradingView Family / Fellow Traders. This is Richard, also known as theSignalyst.
📈BTC has been overall bullish trading within the rising wedge pattern marked in red.
This week, BTC has been retesting the lower bound of the channel.
Moreover, the orange zone is a strong strong and previous all-time high.
🏹 Thus, the highlighted blue circle is a strong area to look for buy setups as it is the intersection of the lower red trendline and previous ATH.
📚 As per my trading style:
As #BTC is around the blue circle zone, I will be looking for trend-following bullish reversal setups (like a double bottom pattern, trendline break , and so on...)
📚 Always follow your trading plan regarding entry, risk management, and trade management.
Good luck!
All Strategies Are Good; If Managed Properly!
~Richard Nasr

Czech Republic: A Dividend HeavenThe Prague Stock Exchange (PSE) PSECZ:PX is characterized by a concentration of mature, dividend-paying companies, particularly in sectors such as energy, banking, and heavy industry. Unlike growth-focused exchanges in the U.S. or Asia, the Czech market offers relatively few stocks with high reinvestment or expansion trajectories.
Preference for Payouts
Over the past two decades, Czech listed companies have consistently distributed a significant share of profits as dividends. This reflects both limited reinvestment opportunities in a relatively saturated domestic market and a shareholder preference for cash returns. For example, CEZ and Komercni banka have maintained payout ratios above 70% in most years.
Structural Support & Tax environment
The Czech Republic provides a structurally supportive environment for dividend-oriented investors. One key advantage is the tax framework. Czech residents are exempt from capital gains tax if they hold an investment for more than three years. This strongly favors long-term investing.
For non-residents, a 15% withholding tax on dividends applies—unless the investor resides in a country outside the EU/EEA that does not have a tax treaty or tax information exchange agreement with the Czech Republic.
Key Dividend-Paying Companies
CEZ (CEZ) PSECZ:CEZ
Industry: Energy (Electricity generation and distribution)
Dividend History (Gross per Share) / Dividend Yield (%)
2020: CZK 34 10.1%
2021: CZK 52 5.8%
2022: CZK 48 18.83%
2023: CZK 145 5.43%
2024: CZK 52 5.9%
Dividend Growth:
2020 to 2021: +52.9%
2021 to 2022: -7.7%
2022 to 2023: +202%
2023 to 2024: -64.1%
Komercni banka (KOMB) PSECZ:KOMB
Industry: Banking and financial services
Dividend History (Gross per Share) / Dividend Yield (%)
2020: CZK 23.9 3.63%
2021: CZK 99.3 10.62%
2022: CZK 60.42 9.22%
2023: CZK 82.7 11.41%
2024: CZK 91.3 10.76%
Dividend Growth:
2020 to 2021: +315.6%
2021 to 2022: -39.2%
2022 to 2023: +36.9%
2023 to 2024: +10.4%
Moneta Money Bank (MONET) PSECZ:MONET
Industry: Banking and financial services
Dividend History (Gross per Share) / Dividend Yield (%)
2020: CZK 0 (dividend suspended)
2021: CZK 3 10.67%
2022: CZK 7 10.53%
2023: CZK 8 12.82%
2024: CZK 9 8.08%
Dividend Growth:
2020 to 2021: N/A
2021 to 2022: +133.3%
2022 to 2023: +14.3%
2023 to 2024: +12.5%

XAUGold is really have not time for wait ... why it should .. there are some kind of long teram pressing price down buyin buyin & buyin .. when they want to sell it ? Or it is already was sold ? who knows ... but ,its insane, how many ways there are to scam people :D

BTC - 4 Cycles Repeating Itself!Hello TradingView Family / Fellow Traders! This is Richard, also known as theSignalyst.
The picture says it all!
🔄Is history about to repeat itself?
If so, we are currently in Phase 2. 📈
What’s next? A dip toward the $75,000 zone is expected before the next impulsive move begins. 📉🚀
📚 Reminder:
Always stick to your trading plan — entry, risk management, and trade management are key.
Good luck, and happy trading!
All Strategies Are Good, If Managed Properly!
~Rich

(ETH) ethereum "years - phases"The phase of the Ethereum chart in years using colors to represent each year and to visually show what happened during those years. So far this year is cold and losing. Will Ethereum recover and create a new pattern never before seen or will this entire year be in vain while wishing and hoping and believing that the price will turn itself around? The year of 2025 the year of AI.

(xlm) STELLAR "LOOP"This chart looks like there is no real volume and only someone very rich controlling the price of XLM. If I missed the top to sell and the price of XLM never went higher than previous ATH the price of most cryptocurrency is what would otherwise be stuck in a loop with very little interest from real investors. How is it possible for the chart to be like this?

(BTC) bitcoin "history"bitcoin compared to the 9 weeks down of jasmy. The last time Bitcoin went down for 9 weeks straight was during April-May 2022.

(JASMY) jasmy {9 weeks of down for Jasmy} that certainly was not expected based on the previous performance.

The History of Forex Trading: How It All Began Ever wondered how forex trading became the massive, 24/5 global market we know today? Here’s a quick look at its fascinating journey:
1️⃣ The Gold Standard Era (1870s–1930s)
Forex trading originated when countries began linking their currencies to gold. This system created fixed exchange rates but collapsed during the Great Depression due to economic instability.
2️⃣ Bretton Woods Agreement (1944–1971)
After World War II, nations agreed to peg their currencies to the US Dollar, which was backed by gold. This made the USD the world’s reserve currency and gave rise to modern foreign exchange systems.
3️⃣ Floating Exchange Rates (1971–Present)
When the Bretton Woods system ended, currencies began to "float," meaning their values were determined by supply and demand in the market. This shift created today’s forex market, where traders speculate on fluctuating currency prices.
4️⃣ The Rise of Retail Forex (1990s–2000s)
The advent of the internet and trading platforms like MetaTrader brought forex to individual traders. What was once reserved for banks and institutions became accessible to anyone with an internet connection.
5️⃣ Today’s $7.5 Trillion Market (2020s)
Now, forex is the largest financial market in the world, with $7.5 trillion traded daily. Traders from every corner of the globe participate, using advanced tools and strategies to navigate this dynamic market.
Forex has come a long way, and we’re part of its exciting evolution. What do you think the future holds for forex trading? AI tools? Crypto integration? Let me know in the comments!

SPX is history gonna repeat?Hello Birdies,
Seems like we are in a repeating pattern and the worst part is the pattern is of 2007 crash.
OMG, the tops and dates are so aligned it cant be a coincidence.
We have a top in July
Fed rates cuts in Sep
Now if it tops in Oct
We are doomed.

Election Year Cycle & Stock Market Returns - VisualisedIn this chart, we're analysing the open value of the week the US election took place and comparing it to the open of the following election, showing the gain (or loss) in value between each election cycle.
Historically we can see prices in the Dow Jones Industrials Index tend to appreciate the week the election is held. Only twice has the return between the cycles produced a negative return.
Buying stocks on election day, 8 out of 10 times has yielded a profitable return between the election cycles. 80% of the time in the past 40 years returning a profit, has so far been a good strategy to take.
The typical cycle starts with the election results, an immediate positive movement and continued growth before finishing positive.
The Outliers
2000-2004 was the only year which ended negative without prices going higher than the election day.
2004-2008 increased 41.84% before ending negative.
2008-2012 began the cycle falling 30.62% before finishing positive.
The names of presidents who won their respective elections is to visualise who had the presidential term during that specific cycle.

Mid To long term projection of the SPYGiven Donald Trump's recent victory, the market has felt an optimistic boost. This excitement, could be enough to overcome the current economical warnings that have been prevalent in the previous months. It's impossible to know if these excitements will be enough to send the market into a new and strong rally into overextended territories, or if the market will continue to complain about unaffordable housing, and sustenance.
The future is always an unknown variable, however random variables do tend to follow their own distributions to a certain degree. It is always possible for exceptions to occur which prompt price action to get excited at already expensive prices. However, it is intelligent to always take a degree of caution when purchasing expensive securities which are still increasing in price. In these scenarios I suggest waiting for price corrections before purchasing and purchase in small amounts as price decreases to be able to purchase more at lower prices aka cost average.
Given Trumps popularity, it's possible that people will become optimistic about the near future, however Trump still has a lot of rivals, which will stop at nothing to fulfill their agenda. The president will be faces with many new challenges these coming 4 years. I wish him the best of luck as he writes history once more.
May God bless the future of America, its allies and it people. It's time to see the world change once more.

APT ANALYSIS🚀#APT Analysis :
🔮As we can see in the chart of #APT that there is a formation of "Falling Wedge Pattern". Some time ago the same structure was made and it performed well and this time also the same is happening with a perfect breakout
🔰Current Price: $8.69
🎯 Target Price: $13.15
⚡️What to do ?
👀Keep an eye on #APT price action. We can trade according to the chart and make some profits⚡️⚡️
#APT #Cryptocurrency #TechnicalAnalysis #DYOR

[USD/JPY] Decades of relationship: A historyOne of the thing that I love about trading is how we can look at the price history. Since this week the TVC:DXY seems gaining momentum (at least in short term), I just think it would be interesting to see the history of relationship between FX:USDJPY as this pair currently possibly pivoting its trend.
This is FX:USDJPY weekly chart, goes back to 2001.
Since 2001, there are 2 major eras: the era where JPY is strong & the era where USD is strong. Both eras share similar timespan, a decade (10 years or so). If the history rhyme, we might now seeing the change of an era, possibly towards the JPY era. For next 10 years ? I don't really know as today's market is much more complex than even 3 years ago.
Nevertheless, current trend is indeed changing. If we look at the current chart, we can see the MACD divergence happened just before the drop in USD value. It's interesting to see how this setup have happened many times in the past 20 years: 2 peaks, MACD divergence, then USD drop. The drop are varied off course, so interesting to see how this time it will played out.
There is a sensible explanation for this though & it's quite simple: FED is cutting rates, while BOJ ends its negative rate regime, hence narrowing yield between JPY & USD, make keeping the JPY in Japan more attractive, or at least less risky.
Cherio...

#Bitcoin chart and historical eventsHere's proof that there's a reason for all these ups and downs in the #Bitcoin chart from past to present.
I always think that news and geopolitical events have a reason and that charts don't just happen, they serve a purpose.
All notes on the chart are valuable.

#Bitcoin grafiği ve tarihsel olaylarGeçmişten günümüze #Bitcoin grafiğindeki tüm bu inişlerin ve çıkışların bir nedeni olduğunun işte kanıtı.
Her zaman haberlerin ve jeopolitik olayların bir nedeni olduğunu ve grafiklerin öylesine oluşmadığını, bir amaca hizmet ettiğini düşünürüm.
Grafikteki tüm notlar değerlidir.

LAURUS LAB - HISTORY REPEATHELLO EVERYONE,
I am here with a new powerpack price action that we can see in LAURUS LABS.
KEY POINTS
-- The stock is continuously following the pattern of HIGHER HIGH and HIGHER LOWS Giving a look of RALLY and PULLBACK.
-- Now the stock is again looking for RALLY i.e HIGHER HIGH.
-- Stock has given a small breakout of downward sloping Trendline.
-- stock might give close above 50 EMA (in daily TF) today which will help this stock move upward.
-- There seems increasing volume in this stock.
Exceptional key point-
--Its a fundamentally good company and it has purchased some building and machinery in last quarter, This might helps to give good results in upcoming quarters.
Trade Plan
-- One can enter at Current Market Price as it is above 50 EMA
-- Targets will be 450-465-480
-- Stop Loss will be at 419 (previous swing low)
Disclaimer
I am not SEBI REGISTERED. consult your financial advisor before any kind of investment. I am not responsible for any kind of your profits and losses.
Thank you
KARANN DINGRA
