Gold - Search for Patterns Finding Patterns in Charts is critical to help analyze the next move based off of history.
Of course this does not work every, but it is a helpful tool to add to our trading skills.
History

XRP Price Zone HistoryXRP has seen couple of wild rallies in the past, the RSI Indicator has always been a giveaway during these times. When ever the RSI index has crossed 85+ XRP has corrected. At the time of this analysis the RSI indicator was hovering round 90. The holiday season which is coming up will probably add more fuel to its price and we could see some highs still.
The other reason why the alt coins are seeing a major price rally is because profits from Bitcoin is being pushed into the other cryptos.
That is also a major reason why we are seeing such huge rallies in ALT coins.
I feel XRP is highly bullish at this point and will see another spike because of FOMO gripping traders. But its also a territory where traders have to be cautious since BTC price has been stagnating around the 18k-19k levels and many people are wary of the 20k levels.

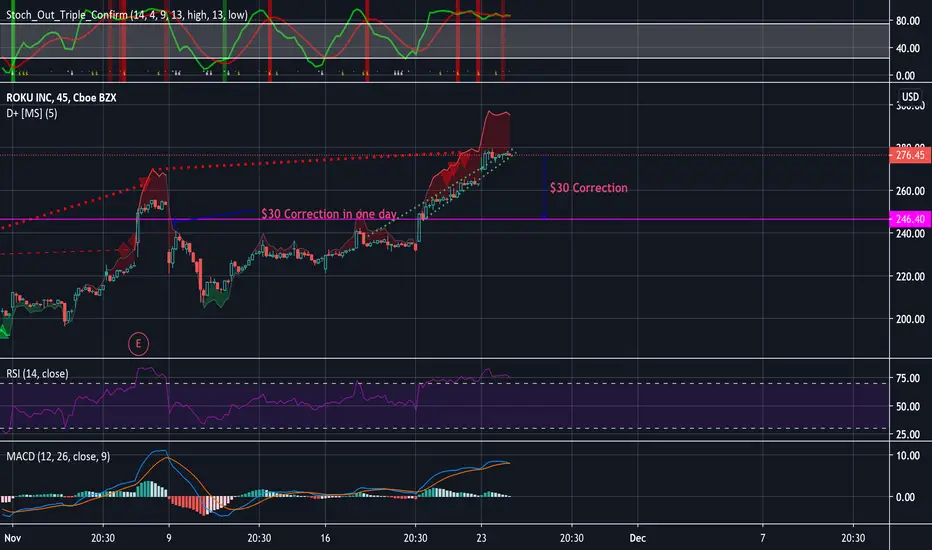
$30 Correction PossibleA lot of popularity around ROKU, the stock has been on a bull run for quite some time. Having an RSI over 70 for such a long period of time, and sell signals are popping up like crazy. The last 45min segment of todays trading period can be the start of a correction. A downward bear crawl to $246 in a very short period of time. A $30 correction has happened in the past and can happen again. With growing bearish divergence and weakening buying strength, we can expect a correction to happen soon.
Comment your thoughts below if you are a ROKU bull or bear and what your prediction is. Would love to hear from all of you!
Tesla To Rise Thursday Every indicator, every candle, and every piece of history shows Tesla going up in value this Thursday 11/12
I am going to deep dive this chart and explain my full analysis.
1. History repeats itself! If you look at the bullish divergence on 10/20 and 11/10 you can see they are identical set ups and on 10/20 the stock skyrocketed past resistance.
2. Bollinger Bands!! Show room for growth as the green line and red line have not crossed yet! Also a recent buy signal on 11/10
3. MACD: Blue and orange line just crossed at a low point curving upward showing growing bull momentum
4. Low RSI of 48.04 where TSLA usually runs around a RSI of 55.
5. Kurutoga Cloud: TSLA already started to break through resistance and could soar to $440 if resistance broken.
Wish me luck on my options call! I have 5 contracts for $420 by 11/20, I plan on selling during tomorrows surge and shorting AMZN

$4 Decrease In Share Value In A Single DayAs you can see in the price history, Uber has made some big day over day gains. $2-$4 gains at a time. This means that it could easily fall $2-$4 day over day back to a normal RSI. Uber just launched out of control and is on its way back down. I would not be surprised if we saw a single drop up to $4 in a single day.

SELLER IN THE GAME, GOLD CHANNELS IDENTIFIED | GC1! DAILY#goldtradingidea #tradingidea #gc1! #comex #futuretrading #gold #election #chartpattern #trendanalysis
We have seen very strong sellers entering in the market of GC1! Gold Comex Future. The gold has broken the red line to trend in a new channel.
The new horizontal #trending #range of the gold probably follow a logic pattern, as you can see when we do some extensions to the top, we perfectly arrive to the maximum price reached this year.
The green top line is where the gold could probably go, same for the bottom middle black line.
The Gold is at the moment in a very #importantzone. Follow up on this red line which is a super #strongresistance right now. Above $1927 there is a strong probability to see the #goldrise from there.
For the moment be careful at sellers tricky moves on the GC1!. The are sqeezing down and disappearing.
Hope my chart helps you have another vision on the Gold. Thanks you for the shared and the interest shown. See under some extra information on the lines.
Green Top Line: The sky for the Gold Future Price, not reached yet. Beware everything is possible with the Gold.
Black Lines: Very strong points in the recent history of the Gold GC1! Comex Future. At the moment it is the strongest nearest bottom point.
Red Line: The strongest point of the GC1! Gold Future at the moment.
Dotted Lines: Channels in which the gold has been evolving and potential future channels
Green Circles: Critical moments for the #GC1! #Gold #Comex #Future

Sideways until the end of October?Hello, traders.
Today's question is pretty simple, does the history repeats itself?
Because if they do, we can predict the price more certainly about the next movement, see this example on BITCOIN:
After an almost 50% raise, the BTC started an accumulation pattern which took approximately 90 days to begin a new impulsive wave, which made the price rise almost 40%, and after that, the price started a new accumulation phase that is happening right now.
So if the history repeats itself, we can expect another big sideways movement until the end of October.
And another 40% - 50% rise is expected.
Best Regards.

Every trader MUST have a trading journal!1. What is a trade journal?
A trade journal is a method which allows you to describe all the relevant details of every trade that you take.
2. Should I have a trade journal?
Every single trader MUST have a trading journal.
Without having a clear picture for each of your trades, it will be very hard to become a successful trader.
3. How does a trade journal help me?
A trade journal is like a time machine: it allows you at any time to review your trades and their outcome,
reflecting your strategy, state of mind and the market conditions before, during and after the trade.
4. What is the purpose of the trade journal?
Reviewing all the relevant details of your trades will help you understand how successful you are as a trader,
what you are doing right and wrong, when and why you take winning or loosing trades, what and how should be improved.
5. How to keep a trade journal?
The sole purpose of a trade journal is to provide you at any time with a clear picture for every trade you take.
It should contain relevant details, such as:
- What, when and why have you traded?
- What was the entry price, stop loss and take profit?
- How much of your account balance did you put into that trade? What were the potential risk and profit?
- How did the market looked before and after the trade closed?
- How do you feel before and after the trade?
To make it easier for you, there is a link to a template that you can download and START USING TODAY!.
Template Link: Click HERE

My charts are too crazy !!!I know they are "chart cancer" to some people. Trust me... I know this... so you can move on if you feel that way. For those of you that power through my charts or follow me, you know I am big on using multiple concepts at the same time to bring confluence. I use my own charts for this instead of asking people and/or waiting for signals provided by others. My thought is : there is no such thing as having too much data available. I also repeat the fact that there is useful data in just about anything right or wrong. The chart you are looking at is from Feb 23, 2019 when BTC was in the bottom range. You can hit play on the link below the full version play out. You don't have to love the way a chart looks to use it. Tradingview has a great feature to replay your data from any point of time. I use often , only sharing a small percentage of my charts because I know they look like a mess to people wanting a simple read. I understand why they would want that. I want that too but this is the only way to cram as much data onto a chart at one time. As you can see, you can always take away drawings but you cant go back and get the same view on an asset that at that very moment. Having the price respect the lines only builds more trust and pattern understanding so why not make your own charts full of data ? I prefer making money over optics apparently. For those of you that stick around , thank you for your time and attention. I hope to make the process of reading my charts easier in the future.

AUDUSD BULLS BROKE RESISTANCE ZONE AT 0.7002 MARK - AnalysisAussie just broke the 0.7000 marks strongly gives a confirmation of consolidation provided support for the further jump. USD 3 Trillion support is about to end and we are expecting another package which means more inflated USD. Currencies and Equities are enjoying their buy streak to record highs. The next resistance is at 0.72150 points.
We have posted a historical support resistance point to support your trade setups. Copy it.

GOLD at a key levelHere featured we have a weekly chart with gold currently sitting around the 10 year high mark. Historically we can see strong resistance in this area with a large reversal. However with the current economic state and trading, no currency is considered a real safe haven, perhaps investors will cone to flock to gold and we see a rally through this zone. Either way, a keen pair to watch over the coming weeks, and as it tests these levels we will certainly be trading them. GOOD LUCK

Gold is clearly to buy! Before any trade, it is necessary to see the behavior of the market. The gold here (daily) is clearly not to sell , the line which tells us the story of it is ascendant.

SFET 155% Revenue IncreaseHistory says SFET will spike and retrace roughly 50% of the original move. I like the $1.50 area to load up and wait for the move backup to PT1 $1.69. Not much to say about this ticker. It's more or less an easy 10% based solely on previous moves with small volume from the increase in revenue.

S&P500 - Looking back to 2001. This is a pretty short vid. I'm looking back to 2001 to see what happened, to cautiously draw some ideas about what may happen in the 2020 bear market. The present picture is very different, of course.
2020 is showing a faster deeper dive. The SPX has recovered to a 61.8 fib. It could go higher.
If it heads south, it's impossible to say how far south.

Is the history repeat himself can we see 4.5 K again ? Is the history repeat himself can we see 4.5 K again ?

The fascinating history of derivatives!I do not know how many people are interested in this. I know I am.
I am not a historian, I am exposing here what I know, some of it might be inaccurate.
For those that do not know a derivative is a financial product derived from an underlying asset or reliant on it.
So in other words currencies, indices, bonds, interest rates, commodities, stocks.
65 million years ago or more: Primates
25 million years ago: First hominoids (apes). Bipedalism & loss of body hair speculated to happen 5-7 million years ago.
4 million years ago: First Australopithecus. Said to be as smart as modern chimps (I don't know if other apes 4 million years ago were smarter or not).
2.5 million years ago: Homo genus. Homo habilis. Not the first to use stone tools, but they are more advanced. Start of the paleolithic (old stone age).
2 to 0.5 million years ago: different human species. Not sure if sapiens descends from habilis or erectus or both. First known use of fire by Homo Erectus.
1.2 million years ago skin pigmentation appears, probably because of a megadrought. Sweating is older than this I think. I don't know much about the evolution of speech, stamina, opposable thumbs etc. I know the world temperature is in a downtrend for the past 50 million years. I don't really know all the ice ages and everything. Alot of very big very strong mammals with low intelligence disappeared. CO2 levels started being really very low. It is likely in my opinion that with the glacial periods, the droughts, the low CO2, apes had to get smarter, as well as start hunting meat (homo species have the digestive system of herbivores but consume meat) at some point using the help of dogs (not sure when that first started, but at least 15 thousand years ago). Human species might have started to save food for harsh times that I don't know.
Eating meat (eating everything even bone marrow and potatoes perhaps) allowed humans to make evolutionary leaps because they spent less time looking for food and eating.
Tribes might have traded with each other I don't know.
0.8-0.3 million years ago: Neanderthal, Denisovan
0.5 million years ago: H. Sapiens, a champion, is born. The species starts its path to absolute world domination and Super Apex predator, dominating all biomes, land, sky, upper ocean, the depths too, and even the bacteria living deep down in earth crust.
300,000 BC: Earliest evidence of long distance trade network. It is highly likely I think, that short distance trade networks precede that.
From wikipedia: "The use of barter-like methods may date back to at least 100,000 years ago. There is no evidence, historical or contemporary, of a society in which barter is the main mode of exchange; instead, non-monetary societies operated largely along the principles of gift economy and debt. When barter did in fact occur, it was usually between either complete strangers or potential enemies."
Yes, debt is pretty old. Everything that was invented was for a reason, because it made sense, and was necessary.
Buying cheap to sell low might be very very old...
Possible more than 100,000 BC: Brace yourselves... Some people think money evolved as a convenient way to replace barter (I have rice I want apples he has apples but wants something other than rice...) but this has not much evidence, and a theory that makes more sense is since it all started with IOUs which can be hard to keep track of (plus there's no proof) then money was first a debt and later became a medium of exchange and (lol) a store of value (I guess we devolved).
10,000 BC: With CO2 levels going up and the climate improving, agriculture appears (probably for the first time).
8000 BC: Oldest evidence of derivatives.
Clay tokens used in Sumer (Iraq) as forwards or futures. Climate was not constant, yields would fluctuate. So it makes sense that they needed a way to hedge against fluctuations in supply.
5400 BC: Earliest "City", Eridu, in the Iraq region, not a city by our standards but they considered it so.
~3000 BC: Mathematics history begins in the region of Iraq/Egypt/Syria/Turkey.
3000 BC: The mesopotamian may be the first to develop a large-scale economy using commodity money.
The shekel, a specific weight of barley. They had an advanced economic system with rules on debt, credit, contracts, private property, full blown capitalism...
Urban Revolution: When rural villages turned into urban societies. It all began back then...
Long distance (between different cities with different "kings") trade is regular.
Obviously, writting was required.
Iraq 3500 BC
Egypt 3100 BC
India/Pakistan 3000 BC
China 2500 BC
"The civilized life that emerged at Sumer was shaped by two conflicting factors: the unpredictability of the Tigris and Euphrates rivers, which at any time could unleash devastating floods that wiped out entire peoples, and the extreme fecundity of the river valleys, caused by centuries-old deposits of soil. Thus, while the river valleys of southern Mesopotamia attracted migrations of neighboring peoples and made possible, for the first time in history, the growing of surplus food, the volatility of the rivers necessitated a form of collective management to protect the marshy, low-lying land from flooding. As surplus production increased and as collective management became more advanced, a process of urbanization evolved and Sumerian civilization took root".
1750 BC: Code of Hammurabi , the first lawyer book. It set rules on contracts & on trading including "finance". We still have copies!
Who knows how many traders profitted off spreads arbitrage speculation and more back then.
First derivative exchanges (in Babylon temples), very likeky to have lasted 1000 years or more.
3000BC-300BC: Evidences of derivatives used in other areas than Iraq but no market/exchange that we know of.
500 BC: Thales said to have made a fortune with a put option on oil back then. He speculated on options over the counter, as there were no known exchange (Greece).
330 BC: Alexander army/followers notice derivatives and see their advantage, the concept makes its way to Greece & Rome.
Which is why it is very likely Babylon exchanges lasted more than 1000 years (1750BC to 330BC at least).
300 BC - 500 AC: Evidence of derivative trades, but I don't know if there were markets, all was probably OTC.
476 AC - 1492 AC: The dark ages in Europe. The Arab world have their age of enlightement but I don't know about finance there. The rest of the world doesn't make any progress in that area as far as I know. CO2 levels dropped and times were tough. Hunger and scapegoating is common (middle aged and old women with no husband were seen as useless mouths to feed and often ended being called a witch then burned or drowned, the arab world developped polygamy to adapt to high male mortality so afaik they didn't burn their women). The church before the tough times of low CO2 used to say about people that accused someone of witchcraft that they were supersticious uncivilised pagans.
The church sees derivatives & interests as "gambling" and "evil", so it becomes clandestine.
Not a very interesting period prone to advancements, not much in science, not much in standard of living, maths, finance...
Some exceptions: Late 1200s Monty Shares, 1300-1800 Loggia in the Piazza dei Banchi.
1 big exceptions: There was a gigantic futures operation. Ran by the Church. Give them money against a sacred contract for eternal life. It is a form of futures contract.
1530: Charles V of the Netherlands helps bring back a derivatives market.
1531: Antwerp Stock exchange (Hurray).
1571: Ancestor of the London Metal Exchange.
1637: Tulip Bubble
1730: Dojima Rice Exchange (and first known use of Technical Analysis)
1789: French revolution. Followed by terror, Napoleon etc.
1800: CO2 level pops off. Time to accelerate progress.
~1800: Industrial Revolution, emergence of labor (arguably "wageslaving").
Shortly followed by Karl Marx, and the 20th century will be the century of socialism & communism & fascism.
In particular the terror communism following the russian revolution, similarly to France.
First time in history where capitalism is questionned?
Early 1800s: The UK bans regular slavery (wage labor or wageslavery means this is not required anymore...)
At the time labor was compared to slavery, there was no argument against private property or capitalism thought.
1848: CME CBOT. Not sure when stocks only had their exchange and when commodity futures did. FX never did until recently but most of the trading is still OTC I think, with a lot of swap trading thought.
1945: Gold standard, following the great depression and WW2 result of high inequality and the Reichbank money printing.
1971: Gold standard abandonned, back to FIAT money printing and inequality uptrend.
1990s: Trading makes its way to the internet
2000: I am not sure but I think this is when "macro trading" (Oil, world economy, FX) got big. Retail trading from home develops. Everything got more and more correlated as a result.
2010s: As an answer to wild money printing, in particular after 2009 bank bailout, new improved crypto currencies are created, in particular Bitcoin.
Still FIAT currencies, and not meant to be store of values if I remember Satoshi whitepaper correctly, but with a limited supply as well as no central control to prevent what happened in Zimbabwe & Germany. Exchanges (crypto ones) are completely online and anyone can be a market maker, money transactions are (well depends on the crypto) quick simple fast.
Crypto exchanges are open 24/7!

My investment historyListen to my super boring investment life history, if you like. From the dot com bubble and financial crisis, to the everything bubble crash we are in right now. Where I made huge mistakes, and where I dodged a bullet or two.

(Modern Economic History) The Crash before the Crash? There are several types of "Crashes before the Crash"
Types of "Crashes before the Crash" Include:
1. "Fundamental Collapse" A foundational collapse where everyone is suppose to learn an important economic or philosophical "lesson". An entire Era and "economic school" collapses and "students (traders)" never return to class for at least a semester? Considered an "essentially" collapse where everyone knows something was going wrong and yet they still allow the collapse!?
2. "Popular Crash" or "Sudden and Quick Collapse". (which also includes sudden computer or mathematical algorithms high frequency collapses)
3. Controlled Crash (slow economic collapse)
4. Euphoric Collapse (blips and glitches) "Economic Echos" and "general taps and reminders from god"
All of these types of Crashes or Collapses can be very painful over a long period of time. Sometimes for 20 to 30+ years like the "Great Depression" that lasted into the middle 1955's (and all grandparents still remember). These types of crashes can also be about "food" and "all life on earth". Simple Controlled Crashes can also last 2 or 3 years like in ones that started in 2000 and 2008.
"crash before the crash"?
:(

Watch Out BitcoinWatch Out Bitcoin
10 APR 20
With so many people watching Bitcoin I begin to wonder what it is they’re watching for. Are they only watching today for tomorrow or are they reviewing the past to keep other views open for observation.
While action is slow I like to go back and verify previous signals like the gravestone doji we were left with at the end of August 2019.
If you’re asking yourself what a gravestone doji is it is a bearish reversal candlestick pattern that is formed when the top stem of the candle is greater than 60% of the candle height and the stem below the body is less than 5% of the body height. The color of the doji candle is irrelevant; it can be either red or green. It is a stronger signal if the gravestone doji is red and at the top of the trend. The opposite of a gravestone doji is a dragonfly doji and often has the opposite effect. We’ll cover that later in more detail another time I’m sure but I’ll add this reminder. It is also a reversal signal.
So after seeing the August 2019 gravestone I knew to be aware of the possibility that Bitcoin price could go lower. Then when I saw the next gravestone doji on the weekly ending March 8 I knew I should let up on some of my Bitcoin holding and expect a possible lower entry point. I let go around 7300. We all know what happened next.
With the climb Bitcoin has made since then it is easy to gain doubt and want to buy back in before the price really rockets. Did I jump back in around 4k? No. It was no longer a falling knife but it was still spinning and the following direction was in direct contrast to the study. That’s another reason all the other tools I use are so helpful and allow me to take it one day at a time with a clear and open mind concerning the facts I have before me.
So which will we see first on the daily chart? Will today’s candle turn into a dragonfly doji or will another gravestone doji confirm the course we are on? I’m keeping my powder dry. If Bitcoin has reversed and heading to $100K it will make little difference if I get in at 4K or 9K as long as I’m not losing either.
Happy Trading Everyone.
Thank you for letting me shares my Bitcoin Study. I hope it helps you see the path forward in all your trades.
Remember. This is not trading advice. It is for Educational Purposes only. Follow me if you wish. I do not use Twitter or Face Book. Please engage the like button and add your comments below.

Is it SDT for Bitcoin?Could Bitcoin pull above the 21 EMA and perhaps spring to a new ATH? Considering the 21 EMA has been very supportive in the past there is no reason to believe it couldn’t happen. Especially this close to the halving, Right? Of course from where we are right now in the area of 6800 we would have to see a rise of just over 190% to reach a new ATH. That's not a bad return!
Staying with the trend however we can see we would only need to drop off about 43% to see a new phase low or; about 54% to see a new low in this Elliott Wave correction cycle that began in December 2017. At a 60% drop we should see support from the 100 EMA and hopefully it will be off to the races once we get that support.
What is the ADX trying to say? It would appear that the breadth line (W) continues changing from holding steady to just a small pick-up meaning more people are becoming interested. Unfortunately the divergence (B) indicates the support of that interest in the sense of investment strength is waning. Les cash coming to the table. Also waning is the bullish sentiment (G) while the bearish strength (R) is certainly picking up strength, perhaps to take us to our soon to be told destiny.
Remember. This is not trading advice. Follow with me if you like, engage the like button and please add your comments below.

What will the chart look like next week?I looking at things up close enough I can see whats going on on a day to day basis with most things.
Here I have to wonder will Bitcoin head higher or will it head higher.
As always I like to keep my mind open for the possibility of any outcomes. We can only do that with the data in hand and not our feelings or our girlfriends advice unless she's a unicorn and they just don't exist.

Where does the Wave go from Here?February ended with that gravestone doji and was the first indicator of what has recently played out for Bitcoin. Where or where do we go from here? Well, tried and true is what the Elliot Wave is a standard.
I'm just sharing a look at where my trajectory is when this is posted. Part of work I started back in Aug 19. It'd not final and it should not be taken as advice nor prediction. It's for educational purpose, is material and that's all.

BTCUSD LONG History repeats itself and thats just how it goes !
If btc survives and doesn't break 3500$ support then we are on a big uptrend and the target will be 100,000-150,000 before 2024 so 2-3 years from now.
