STRONG 5x !!!!!Very soon falling will be break and STRONG could fly to 100...buy small amount and HODL...
Hodl

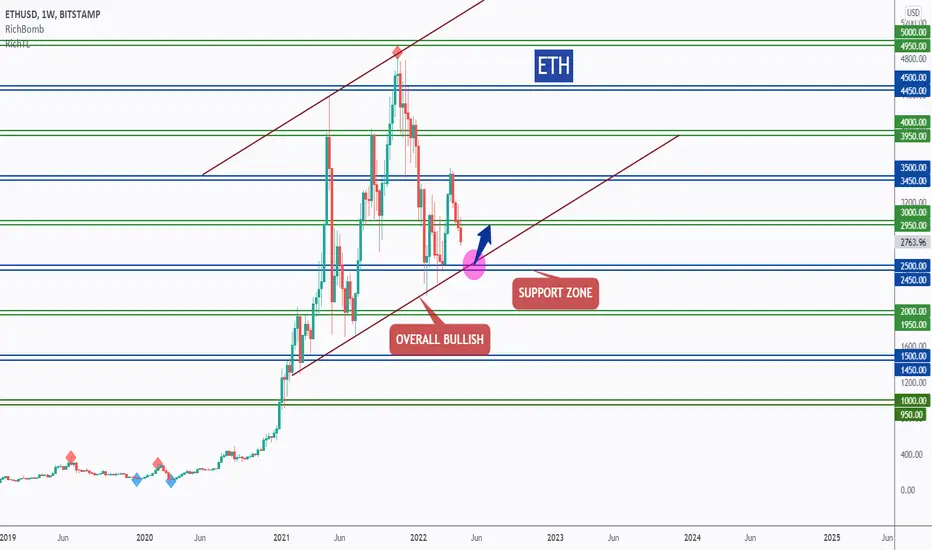
ETH - One More CheckPoint To Go!Hello TradingView Family / Fellow Traders. This is Richard, as known as theSignalyst.
ETH is overall bullish from a long-term perspective trading inside our brown channel and now approaching the lower bound / brown trendline, we will be looking for Trend-Following Buy setups.
Moreover, the area 2450-2500 is strong support and demand zone.
So the highlighted purple circle is a strong area to look for buy setups as it is the intersection of a horizontal support in blue and non-horizontal support in brown.
As per my trading style:
I will be waiting for it to approach the highlighted purple circle area to look for buy setups (like a double bottom , trendline break , and so on...)
Always follow your trading plan regarding entry, risk management, and trade management.
Good luck!
All Strategies Are Good; If Managed Properly!
~Rich
BNB Buy & Hold Monthly Returns in April, 2022In this idea we want to show our operation as a long term trader - another definition for the term "Investors" - in which we select - doing also fundamental analysis - assets with long term bullish Bias.
During the selection process it is important to evaluate the performance of the assets and - once in the portfolio - to monitor how the situation evolves.
How did BNB perform in April 2022? -21.11%
As Quant Traders and Investors, we have developed a tool to help us decide if the asset has a long-term bullish bias and - even more important - to evaluate not only the profits but also the drawdowns at least on a monthly level - as investors portfolio monitoring is not that frequent - that we can expect.
What do you think about the trend of BNB? Other assets to analyse?

BTC Buy & Hold Monthly Returns in April, 2022In this idea we want to show our operation as a long term trader - another definition for the term "Investors" - in which we select - doing also fundamental analysis - assets with long term bullish Bias.
During the selection process it is important to evaluate the performance of the assets and - once in the portfolio - to monitor how the situation evolves.
How did BTC perform in April 2022? -18.72%
As Quant Traders and Investors, we have developed a tool to help us decide if the asset has a long-term bullish bias and - even more important - to evaluate not only the profits but also the drawdowns at least on a monthly level - as investors portfolio monitoring is not that frequent - that we can expect.
What do you think about the trend of BTC? Other assets to analyse?

⭕️BUY crypto FANTOM ; Now is the best time to Buy ❗️🧐🔰You see the analysis of the crypto FANTOM in four hours ( FTMUSDT , 4H) ❗️🔎
🔰BUY FTMUSDT at 1.0300
✅TP ; 2.0600 (+10300 pips)
❌SL ; 0.9180 (-1120 pips)
📊R/R ; 0.1 (This number is derived from the division of Risk to Reward and must always be less than one, and the less it is, the better🧐)
🔰BUY FTMUSDT at 1.0300
✅TP ; 3.1000 (+20700 pips)
❌SL ; 0.9180 (-1120 pips)
📊R/R ; 0.05 (This number is derived from the division of Risk to Reward and must always be less than one, and the less it is, the better🧐) 🔥🔥
🔰Due to the price in the demand area and the fatigue that is evident in the price movement, if the price breaks the white downtrend line. Buying in this area seems low risk. The first target is located in the nearest supply area and the second target is located in the main supply area, which was previously the highest price for this crypto.💰👌
⚠️⚠️🔥Take a look at Phantom Analysis step by step on YouTube🔥⚠️⚠️
⚠️⚠️Please observe capital management and open a low volume transaction❗️❗️
I hope this analysis is useful for you🙏🏻🌹
📌Please introduce the "TRADER STREET" to your friends 🙏🏻
_______________________📈TRADER STREET📉________________________

Bitcoin Rejects $40K... Again 😒As mentioned yesterday, Bitcoin has met resistance just under $40K. We saw a brief pivot from $37.7K, which likely got bulls all hot and bothered, but the fervor quickly fizzled and was not able to sustain a recovery to the $40K's. The Kovach OBV picked up sharply with that rally, but has quickly leveled off. We have stabilized just above $39K, and are likely to remain in the range between $37.7K and $40K unless we see a nice buying wave come through. Keep your eyes on stocks, as the correlation between BTC and stocks seems to be increasing in reliability.

KCS - Are You Ready?Hello TradingView Family / Fellow Traders. This is Richard, as known as theSignalyst.
KCS is overall bullish trading inside our brown trendlines and now approaching the lower bound / trendline.
Moreover, the area in red is a strong support zone.
Before we buy, as usual, we need the bulls to prove to us that they are strong enough to take over.
As per my trading style:
I will be waiting for a third swing high to form around the upper red trendline to consider it valid then buy on its break upward. Then I will be adding more longs after a break above the upper green zone.
Meanwhile, until the buy is activated, KCS can still dive inside the red zone before trading higher.
Always follow your trading plan regarding entry, risk management, and trade management.
Good luck!
All Strategies Are Good; If Managed Properly!
~Rich

Bitcoin Testing $40KBitcoin appears to be finding support at $37.7K and $38.2K. We are currently making a run for $40K, but this seems to be a barrier for now, as we identified in yesterday's report. We are seeing several red triangles on the KRI to suggest resistance. The Kovach momentum indicators suggesting that momentum is edging up, but it remains to be seen if it will be sufficient to break $40K. It seems to depend on what stocks do today. If there is another selloff, we expect $37.7K to hold as a floor. If we are able to break $40K, then we will surely face resistance around $42K.

ETH - Building Block!Hello TradingView Family / Fellow Traders. This is Richard, as known as theSignalyst.
The picture is self-explanatory.
ETH is still technically overall bullish trading inside the brown channel. and it is currently sitting around the blue floor 3000 and lower brown trendline, so we will be expecting a bullish reversal from here. (of course we need to zoom in to lower timeframes and look for buy setups to confirm the shift in momentum)
Unless the blue floor / support is broken downward, then our green zone 2500 would be the next floor and so on...
Which scenario do you think is more likely to happen? Which floor is more likely to hold?
Always follow your trading plan regarding entry, risk management, and trade management.
Good luck!
All Strategies Are Good; If Managed Properly!
~Rich

ICP, What Next? ICP has had a dismal debut in the crypto markets. A listing dump, a long downtrend, and a dwindling market cap; ICP now sits roughly 98% below value of Coinbase listing.
Internet Computer is a Web 3.0 blockchain project that has a lot of potential. I believe positive news and a growing user base is coming. It's only a matter of time. It is the world's first blockchain that runs at web speed with unbounded capacity.
ICP is ranked #37 on CMC with a market cap of 4.3B at the time of writing.
I am following price action to determine if a bottom and accumulation will be formed and a new uptrend born. Recently, I am happy to see no massive moves have been made as other cryptos have experienced sharp bounces from recent lows. Slow and steady will form the foundation for a lasting rise.
IF ICP can make it back into the top 10 cryptos it has potential to offer 10x+ gains from current prices.
--For example ADA has a market cap currently of 38.4B, ranking #7 ahead of SOL with a market cap of 34B. (BNB and ETH 70B and 365B respectively.)
Compare to ICP current 4B market cap I'm sure you can see the potential.
I have begun to make some small purchases with the intent of a long hold.
ATL currently $18.11 - It is yet to be seen if we have found the bottom.
Thank You for reading my post.
No Guarantees
DYOR
Trade Safe, Trade Happy

Can Bitcoin Regain $40K??Bitcoin has rejected the $40K's yet again, feeling the weakness from stocks, and strength in the US dollar. The Kovach OBV is registering the selloff, but does appear to be bottoming out, suggesting Bitcoin may be finding support at current levels. We did see support from $37.7K, one of the exact levels we identified here. However, we are not seeing much momentum come through, and are facing immediate resistance from the next level above at $39.2K, confirmed by a red triangle on the KRI. If we are able to break through, then we will likely face extreme resistance in the low $40K's. If we break through $37.7K, then $36.7K is our next target for support.

NEO - My Trading Plan in a picture!Hello TradingView Family / Fellow Traders. This is Richard, as known as theSignalyst.
NEO is overall bullish trading inside the red channel and now approaching the lower trendline acting as non-horizontal support.
Moreover, the green area is a horizontal Support.
So the highlighted purple circle is a very strong area to look for buy setups as it is the intersection of support in green and the red trendline.
As per my trading style:
I will be looking for potential bullish reversal setups on lower timeframes (like a double bottom , trendline break , and so on...)
And for the bulls to take over from a long-term perspective, we will need a break above the gray area covering the entire range / structure.
Unless NEO breaks the green zone downward aggressively, t hen it will become resistance again and a movement till the lower support would be expected (12.5 - 15.0)
Always follow your trading plan regarding entry, risk management, and trade management.
Good luck!
All Strategies Are Good; If Managed Properly!
~Rich

Best Trading Strategy for Bitcoin!! Read More for Details!!Bitcoin has pivoted from lows completely in tandem with the bounce we saw in stocks. We have regained the $40K handle, as we anticipated here yesterday. However, we are seeing great resistance just below $40.8K, suggesting bulls still are not incentivized to buy it back higher. Range trading seems like the best option here. Be patient and scoop up some BTC in the $30K's, sell it in the low/mid $40K's. If we have enough momentum to break out, we will next face great resistance from the $42K's. If we give up the $40K's again, then we will likely test $38.2K again.


BTC - Detailed Video Analysis!Hello TradingView Family / Fellow Traders. This is Richard, as known as theSignalyst.
Here is a detailed update top-down analysis for BTC .
Which scenario do you think is more likely to happen? and Why?
Always follow your trading plan regarding entry, risk management, and trade management.
Good Luck!
All Strategies Are Good; If Managed Properly!
~Rich

Bitcoin Gives Up $40K!!Bitcoin plummeted off global recession fears and a strong selloff in stocks. We have completely given up the $40K handle for now, but are finding support at $38.2K. The Kovach OBV is abysmally low, and hugging a lower bound, after turning sharply south with the selloff. We do appear to be getting good support from current levels, but if we are able to break through, then $36.7K is the next level where we anticipate support. BTC does appear to be oversold, so a short trade would be FOMO. If we pivot, expect resistance from $40K.

HBAR - Two Possible Entries!Hello TradingView Family / Fellow Traders. This is Richard, as known as theSignalyst.
DAILY: Left Chart
HBAR is sitting around a strong support in green so we will be looking for buy setups.
HBAR formed a wedge pattern in red but it is not ready to go yet.
Long-Term Trigger => For the bulls to take over, we need a momentum candle close above the last high in gray.
Meanwhile, since it is sitting around the lower gray zone, we will be looking for buy setups on lower timeframes too.
H4: Right Chart
HBAR is forming a double bottom pattern but it is not ready to go yet.
Short-Term Trigger => Waiting for a momentum candle close above the blue neckline to buy.
Meanwhile, until the buy is activated, HBAR can still trade lower inside the green support zone.
Always follow your trading plan regarding entry, risk management, and trade management.
Good luck!
All Strategies Are Good; If Managed Properly!
~Rich

XRP - Trend-Following Setup!Hello everyone, if you like the idea, do not forget to support with a like and follow.
XRP is overall bullish trading inside the red channel, and it is currently approaching the lower bound / red trendline acting as non-horizontal support.
As per my trading style:
As XRP approaches the lower red trendline, I will be looking for bullish reversal setups (like a double bottom pattern, trendline break , and so on...)
Unless it is broken downward, then our next support would be around 0.5-0.6 where we will be looking for new buy setups
Always follow your trading plan regarding entry, risk management, and trade management.
Good luck!
All Strategies Are Good; If Managed Properly!
~Rich

Hard Rejection in Bitcoin!!As discussed here, Bitcoin was able to break through $42K, but $43.1K provided prohibitive resistance. We rejected this level hard and fell through the $42K's where we anticipated at least some support, back to the base of the $40K handle. A wick even tested the high $39K's. We have since recovered $40K, just barely. We are making an attempt to test $40.8K, with a red triangle on the KRI confirming some resistance here. We should see further resistance from the $41K to $42K range, and support from $39.2K if we breakdown further.

ETH - Detailed Video Top-Down Analysis!Hello TradingView Family / Fellow Traders. This is Richard, as known as theSignalyst.
Here is a detailed update top-down analysis for ETH.
Which scenario do you think is more likely to happen? and Why?
Always follow your trading plan regarding entry, risk management, and trade management.
Good Luck!
All Strategies Are Good; If Managed Properly!
~Rich

SAND - Wait For The Trigger!Hello TradingView Family / Fellow Traders. This is Richard, as known as theSignalyst.
SAND is sitting around a strong demand zone in green so we will be looking for buy setups.
on DAILY: SAND formed a valid symmetrical triangle but it is not ready to go yet.
Trigger => Waiting for a momentum candle close above the last high in gray to buy.
Meanwhile, until the buy is activated, SAND would be overall bearish and can still trade lower inside or even break the green demand downward.
In this case, we will be looking for buy setups around the blue demand zone.
Good luck!
All Strategies Are Good; If Managed Properly!
~Rich


TheKing updatethis is a small and fast update.
this a 2W timeframes.
Nothing much to say but a move will come sooner or later.
- Notice bounce on EMA50 2W TF.
- Notice BB getting thinner
Feel free to comments wisely
Stay Safe
Happy Tr4Ding !
