Hodl

Bitcoin Volatile as Investors Digest RussiaBitcoin tested lows as the market panic sold with the Russia/Ukraine conflict. But things leveled out quickly, and it subsequently recovered all of its losses. We are currently safely back to the $38K's, hovering just above support at $38.2K. The Kovach OBV has picked up notably, but not enough to give us confidence in any real bull momentum. The value area between $38K and $40K seems reasonable for BTC for now, but if we are able to break $40K, then we should face resistance from two levels in the $41K's. If we retrace further, then we should have support from lows at $34.9K.

MATIC - Top-Down Analysis!Hello everyone, if you like the idea, do not forget to support with a like and follow.
WEEKLY: Right Chart
MATIC is overall bullish and now approaching the lower brown trendline so we will be looking for buy setups on lower timeframes.
DAILY: Left Chart
MATIC is forming a channel in red but the upper trendline is not valid yet, so we are waiting for a new swing high to form around it to consider it our trigger swing.
Trigger => Waiting for that swing to form and then buy after a momentum candle close above it (gray zone)
Meanwhile, until the buy is activated, MATIC would be overall bearish can still trade lower inside the green support.
Good luck!
All Strategies Are Good; If Managed Properly!
~Rich

XRP Ranging With A Pending RetestXRP has great potential although it has been ranging for sometime but analysis shows alike likely retest and potential positions to go long.

Bitcoin Tumbles Off the Russian Invasion of UkraineBitcoin has plummeted after the Russian invasion on the Ukraine. We were personally hoping that Bitcoin would become another safehaven asset, but with institutional holdings on balance sheets, it is moving with stocks at this point. We sold off drastically from what appeared to be an inverse head and shoulders pattern forming at around $39K, smashing through several major levels in the $30K's. However we are currently finding support at $34.9K and $34.0K. If we tumble further then $32.3K is the next target. If we are able to recover a bit, then $36.7K is the next target.

There is not much time left until the 35,000 touch by BitcoinThe first target of Bitcoin is 38K and then 35K
90% of my positions are sells and I never use the word if in analysis because I think this type of analysis is just the job of a market narrator.

Bitcoin Ready to Breakout??Bitcoin has made another run for lows in the mid $30K's. We found good support at $36.7K, confirmed by a green triangle on the KRI. The Kovach OBV is still bearish, but does appear to be leveling off. We are seeing an inverse head and shoulders type pattern in Bitcoin with a "neckline" around $38.9K. If this is the case then a breakout could easily take us back to the $40K's, but we might need some fundamental driver like the situation with Russia to improve. If we are able to break out, the first target is $40.0K. If we reject current levels then $36.7K should hold.

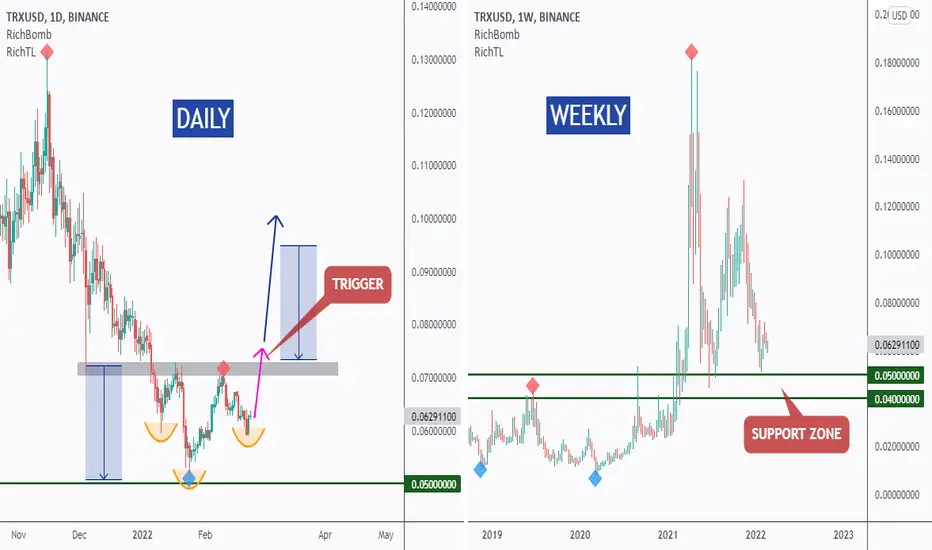
TRX - Top-Down Analysis!Hello everyone, if you like the idea, do not forget to support with a like and follow.
WEEKLY: Right Chart
TRX is sitting around strong support in green so we will be looking for buy setups on lower timeframes.
DAILY: Left Chart
TRX is forming an inverse head and shoulders pattern but it is not ready to go yet.
Trigger => Waiting for a momentum candle close above the gray neckline to buy.
Meanwhile, until the buy is activated, TRX would be overall bearish can still trade lower inside the green support.
Good luck!
All Strategies Are Good; If Managed Properly!
~Rich
Bitcoin Sells Off with Russia TensionsBitcoin has sold off with stocks as the markets react to the Ukraine/Russia conflict. We were skeptical of the bull rally anyway, as we have mentioned here many times. Bitcoin have solidly given up the $40K handle, and are well into the $30K's at this point. The level $38.2K appeared to provide good support, but another wave of selling took us back further to $36.7K. This appears to be a bottom for now, but there is a vacuum zone to $34.9K. If we catch some bull momentum, $40K is the level to break to see higher levels.

KCS - Detailed Video Analysis!Hello everyone, if you like the idea, do not forget to support with a like and follow.
Here is the top-down analysis for KCS, feel free to request any pair/instrument or ask any questions in the comment section below.
Fundamentally KCS / Kucoin is doing great too!
As per KuCoin Labs: Integration of Metaverse and DeFi Will Be a Major Highlight in 2022
“KuCoin Labs takes its role in promoting the development of the whole crypto industry. We incubate and invest in innovative projects, guide their development to their maturity where they would bring the best of crypto. As one of the top investment institutions, KuCoin Labs team gathers professional research on a forward-looking journey, unceasingly diving deep into every aspect and detail of a vertical. KuCoin Labs aims to be an integral force in building the future of Web 3.0.”
Said Lou Yu, head of KuCoin Labs.
Best of luck!

TOTAL - Sooner or Later, The Bulls Would Take Over!Hello TradingView Family, this is Richard.
I usually keep an eye on TOTAL to get a feeling about the overall crypto market bias. Just like I keep an eye on DXY when it comes to Forex.
As per my last TOTAL analysis, we are still bearish trading inside the red channel.
WEEKLY: Technically we are trading inside that big brown channel, and we are currently in a correction phase after rejecting the upper bound / brown trendline and 3T round number.
DAILY: After breaking below the head and shoulders neckline, marked in gray, the bears took over and TOTAL started trading inside the red channel, making lower highs and lower lows.
That being said, we know that we are overall bearish , but what are the possible scenarios?
Scenario 1: Projection in Blue
A sudden shift in momentum, by an aggressive movement from here to break above the current last high.
Scenario 2: Projection in Purple
TOTAL trades lower to test the support again and forms a new swing high around the upper red trendline. Then the bulls would take over by breaking above that new high.
Which scenario do you think is more likely to happen? and Why?
All Strategies Are Good; If Managed Properly!
~Rich

BTC Remains Hoarded As Price DropsAccording to on-chain data, a majority of Bitcoins
BTC have not been moved in at least a year.
Crypto investors are holding on to their BTC despite Bitcoin’s performance. Long-term investors are adding to their positions or staying put on their BTC exposure.
At the time of reporting, over 60% of all Bitcoins have not moved in the last year.
According to Glassnode's HODL Waves indicator, as of Feb. 18, 60.61% of the BTC supply has not been transacted for a year or more.

All Eyes On Bitcoin - Video Analysis!Hello TradingView Family / Fellow Traders. This is Richard, as known as theSignalyst.
Here is a detailed top-down analysis for BTC.
Which scenario do you think is more likely to happen? and Why?
Always follow your trading plan regarding entry, risk management, and trade management.
Good Luck!
All Strategies Are Good; If Managed Properly!
~Rich

Bitcoin to $30K's Again??Bitcoin has retraced back to support at $40K. We had been calling for this retracement after weak momentum met resistance, and the price action meandered just below $45K. Several red triangles on the KRI confirmed that $45K was too top heavy for Bitcoin, and we promptly retraced to support in the $41K's. After that did not hold, we identified the next levels of support around $40K, where we are currently seeking to establish value. The Kovach OBV has dropped off substantially, but $40K is a strong psychological and technical level. If it holds, we could make a run back through $41K back to the value area just above the $43K's. If selling continues, then $38.2K is a particularly auspicious level and is likely to provide strong support.

Bitcoin Price Analysis (Short Term)Bitcoin is looking to consolidate and might trade within the range. Any Breakout/Breakdown From The Range Can Lead To Significant Move.


Bitcoin Rejects $45KBitcoin has pressed higher, though hopes for a bull rally were quickly thwarted as we met resistance just below $45K. Several red triangles on the KRI indicated resistance, and the price action was rounding off. Support at $43.8K broke, and the next level below, $43.1K is hanging on by a thread. If we break down further, we should have support from two strong levels in the $41K's, then $40K. The target from above to break is $45K, and we aren't convinced of any bull rally until this happens. After that, the next target is $47.4K, where we will be in a better position to consider $50K again.

HNT - Trend-Following Buy Setup!Hello everyone, if you like the idea, do not forget to support with a like and follow.
HNT is overall bullish and now approaching the lower bound/brown trendline, so we will be looking for buy setups.
Moreover, the zone 20.0-25.0 is a resistance turned into support.
on DAILY: HNT is forming a wedge pattern in blue but the upper trendline is not valid yet, so we are waiting for a new swing high to form around it to consider it our trigger swing. (projection in purple)
Trigger => Waiting for that swing to form and then buy after a momentum candle close above it (gray zone)
Meanwhile, until the buy is activated, HNT would be overall bearish can still trade lower inside the horizontal support in green, where we will be looking for new buy setups to form.
Good luck!
All Strategies Are Good; If Managed Properly!
~Rich

GME - Spicy - 90-day Cycle AlertGME daily chart with the estimated 90-day cycle (High to High). Next peak looking like it could hit new intermediate high by early March 2022.
RSI bullish with plenty of room to run to the upside from here. Multi timeframe Stoch is not overbought.
Also - New bombshell report on GameStop out on Zerohedge this morning reporting that the sEc Got iT wRong:
SEC's Conclusions About 2021 GameStop Run-Up Are "Misguided", Academics Argue, www.zerohedge.com
HODL
Not financial advice.

BITCOIN POTENTIA INVERSE HEAD AND SHOULDERS ! Bitcoin after the huge drop, found a really strong support at 33k which worked as a bounce price!, now after a long time we have a potential inverse head and shoulder at 1 Day chart which can chance a lot! Of course we have a lot of resistances to break before we go for a big run, but almost every bounce to the top starts from an Inverse head and shoulder!
@CryptoDrou
Lets Make Money!

Bitcoin Meets ResistanceBitcoin has made an attempt at a rally, but several red triangles on the KRI have suggested resistance. We seem to have topped out just below our level at $45K for now. The Kovach OBV has quickly leveled off as we encounter resistance. It appears we are in a broad sideways corrective pattern after a large rally took us back to the $40K's again from the high $30K's. If we retrace further, we should see support at $41.9K and $41.6K. If we catch another burst of momentum, we will surely encounter resistance at $45K, then $45.6K, then $46.2K. If we are able to clear these levels the next target is $47.4K, but based on the price action and momentum, this is not likely for now.

ETH - Wait For The Break! Come On BullsHello TradingView Family / Fellow Traders. This is Richard, as known as theSignalyst.
ETH is forming a potential big inverse head and shoulders pattern , marked by orange arcs.
As per my last analysis, we are still waiting for the bulls to take full control , by breaking above the gray neckline which covers the entire pattern/structure.
Meanwhile, until the bulls take full control, the bears can still kick in and push ETH lower to test the lower brown trendline. In this case, we will be looking for new buy setups to form.
Which scenario do you think is more likely to happen? and Why?
Always follow your trading plan regarding entry, risk management, and trade management.
Good Luck
All Strategies Are Good; If Managed Properly!
~Rich

Trying to pin down the DWAC trend.I like to do these "gesture drawing" lines. You can probably find really similar lines with complicated maths, but these are not meant to be precise. The horizontal lines are just support and resistance levels. The lines slanted down are bearish trend lines, the lines slanted up obviously are the bullish trend lines. The purpose of doing this is simply another way to visualize price action. Like all charting.
Once in a while I find a line that wasn't immediately obvious but appears to have a type of gravity to it... in this chart, that is the yellow line. The way it contacts the top of the day 1 candle so perfectly, it reminds me of an old quote...
“Give me a place to stand, and a lever long enough, and I will move the world. ”
-Archimedes
