Buy Signal Given on HOODTrading Fam,
Keeping this trade simple here with low risk. Received a "BUY" signal from my Pivot Zones Indicator and I'm entering the trade. We are above the 200-day SMA. I want to shoot for that fairly recent gap down that was made at the end of last year as a target. I will exit if we drop much below that 200-day SMA. At entry, this trade was a 1:5.4 rrr.
✌️Stew
HOOD

01/18/2026 HOOD longHello traders,
I’m seeing many S&P stocks forming wedge patterns (QQQ is also forming a wedge), and HOOD is one of them. While the exact catalyst for the next market move is unclear, it appears something is cooking, and a directional move may be approaching. HOOD is currently sitting near the lower boundary of its wedge and could bounce toward the upper range. Let’s stay disciplined and trade cautiously in this choppy market.
May the trend be with you.
AP

HOOD Weekly Swing: Catch the Bearish Move Before Expiry!HOOD Weekly Signal | 2026-01-22
📊 TRADE DETAILS 📊
🎯 Instrument: HOOD
🔀 Direction: PUT (SHORT)
🎯 Strike: 100.00
💵 Entry Price: 0.97
🎯 Profit Target: 1.94
🛑 Stop Loss: 0.58
📅 Expiry: 2026-01-30
📏 Size: 1.0
📈 Confidence: 60%
MODERATE RISK WARNING: Consider reducing position size due to moderate confidence level.
🚨 IMPORTANT NOTES
Wide bid-ask spreads (e.g., $0.95/$1.00 for the $100 PUT) pose significant slippage risk on entry and exit.
The provided options tables lack strikes near the current price ($106.56), forcing the selection of a deep out-of-the-money option with a low delta (-0.199).
Trade Strategy / Edge:
Targets potential downside from technical divergences aligned with AI’s subtle bearish trajectory.
Very small position size (1%) limits capital at risk.
Manage this trade actively. Consider taking partial profits at Target 1 if reached.

Robinhood TRADE IDEA $HOODNASDAQ:HOOD What do you think about this trade idea?
Robinhood stock has bounced strongly from its moving average three times in the recent past, clearly showing that this level is acting as an important area of support. Each pullback toward the moving average has attracted buyers, leading to meaningful rebounds, which makes this level worth watching closely again.
After a strong run earlier in 2025, the stock has experienced a sharp pullback, coming down from around $150 to near the $100 level. This correction has made the chart structure more interesting, especially from a risk-to-reward perspective. While the end of the move has been rough, the overall trend still has the potential to resume if price holds above this key moving average.
If you’re considering a buying opportunity in Robinhood, it’s important to closely monitor how the stock behaves around this moving average. A strong reaction or bullish confirmation from this level could signal another leg higher, while a clean break below it may suggest further downside. Overall, this moving average remains a critical decision point for anyone looking to trade or invest in the stock.

BULL – In My Top 10 Picks for 2026: Is Webull the Next HOOD?I’ve been following BULL (Webull) closely, and it’s firmly in my top 10 picks for 2026. Structurally, the story is very compelling.
Retail participation in financial markets continues to grow, and platforms that serve these investors—brokerages like Webull—are direct beneficiaries of this trend.
When I think about the trajectory, BULL reminds me a lot of our early calls on HOOD.
Robinhood currently trades at a market capitalization of roughly $97 billion. BULL, on the other hand, is valued at only around $4 billion.
That gap highlights the potential upside if Webull can continue to grow its user base and improve monetization.
The numbers alone are not the full story, of course. Financial results and execution matter, and Webull will need to prove that it can convert its growing user base into consistent revenue streams.
But structurally, the ingredients are there. As user monetization improves, I expect financial performance to start reflecting this, which could be a major catalyst for the stock.
The stock's 52-week range of $7.57 to $79.56 further fuels my bullish stance.
After dipping to its lows amid broader market volatility, BULL has shown resilience, trading around $8.16 as of mid-January 2026.
This setup strongly reminds me of our early HOOD call positions when the stock was trading around $9, back in its post-IPO correction phase. Robinhood eventually surged as retail trading boomed, and I anticipate a similar catalyst for Webull—perhaps through strategic partnerships, international expansion, or even acquisition interest in a consolidating industry.
In my view, BULL represents a rare combination of structural tailwinds, compelling valuation, and optionality. For those looking for a top pick for the year, it checks all the boxes.

ROBINHOOD HOOD Bearish Playbook — Thief on Duty!📉 ROBINHOOD MARKETS INC. (HOOD) — Bearish Profit Playbook
🔥 Swing / Day-Trade Thesis with Thief Layer Strategy
🧭 Market Context & Core Idea
The bearish outlook is confirmed after HULL Moving Average shows a downside breakout, signaling momentum shifting toward sellers. This forms the backbone of today’s playbook 📉⚔️.
The setup focuses on a layered entry (Thief Strategy) — a structured way of placing multiple limit orders at different price levels to average into premium zones with precision.
🎯 Plan: Bearish Setup with Thief-Style Layered Execution
This plan uses multiple SELL LIMIT layers, allowing flexibility and better control across volatility zones:
🔻 Layered Entry Zones (Sell Limit Layers)
125.00
120.00
115.00
110.00
(You may increase the number of layers based on your own approach — thief style is flexible.) 😎🧤
🛑 Stop-Loss (Thief SL)
SL @ 130.00
⚠️ Dear Ladies & Gentlemen (Thief OGs), this SL is not a recommendation — adjust your stop according to your own risk appetite. You make the money, you take it at your own risk.
🏁 Target Zone
The Moving Average is acting as strong support, and current structure suggests oversold conditions + a possible bullish trap scenario.
🎯 Target @ 92.00
⚠️ Dear Ladies & Gentlemen (Thief OGs), this TP is not fixed — targets must match your personal risk-to-reward logic. Manage wisely.
📊 Why This Setup Works (Key Technical Notes)
✨ HULL Moving Average breakout confirms bearish flow
✨ Multi-layer entries help capture stretched price spikes
✨ Oversold conditions hint at potential profit-taking zones
✨ Support zones + price traps increase snap-back volatility
✨ Ideal for swing/day-traders who prefer structured scaling
🔍 Related Pairs to Watch (Correlation Radar)
Tracking correlated or sentiment-linked assets helps understand broader flows:
🧩 Tech / Growth Sentiment Links:
NASDAQ:QQQ — reflects overall high-beta sentiment & liquidity
CBOE:ARKK — tracks innovation/growth appetite
NASDAQ:COIN — crypto-linked sentiment often spills into HOOD
NYSE:XYZ — fintech risk appetite correlation
NASDAQ:SOFI — retail-driven growth behavior overlaps with HOOD
🧲 Key Takeaways:
When growth ETFs weaken, HOOD typically accelerates momentum
Retail-heavy assets show higher reaction to volatility spikes
Watching these helps confirm whether HOOD’s breakdown has strength
✨ “If you find value in my analysis, a 👍 and 🚀 boost is much appreciated — it helps me share more setups with the community!”
Disclaimer: This is a thief-style trading strategy just for fun.

The Robinhood vs. Coinbase War is raging. Is the Battle decided?While Robinhood has certainly been faster at launching traditional banking features, Brian Armstrong has explicitly confirmed a pivot for Coinbase to become a "financial super app" (or "everything app") to directly compete in that same space.
As of late 2025 and early 2026, Armstrong has shifted Coinbase’s narrative from being just a "crypto exchange" to becoming a "bank replacement"
The Coinbase "Everything App" Pivot
In his 2026 roadmap and recent interviews, Armstrong outlined a vision that looks very similar to what Robinhood is building, but powered by blockchain rails:
The "Everything Exchange": In December 2025, Coinbase officially launched tokenized stock trading and prediction markets (via Kalshi) within its main app. They also flagged plans for 24/7 perpetual futures on both crypto and stocks for 2026.
Primary Financial Account: Armstrong stated his goal is for Coinbase to be a "bank replacement" where users handle all spending, savings, and investing. This includes an aggressive push for the Coinbase Card and using stablecoins (USDC) for everyday payments.
On-Chain "Super App": Coinbase recently rebranded its wallet as an "everything app," integrating messaging, social networking, and "mini-apps" that run on its Base network. This model is more akin to China’s WeChat than a traditional US brokerage.
Robinhood currently feels like the "Amazon of Finance" because they already offer the full "Prime" experience (credit cards, 3% IRA matches, and gold subscriptions) using traditional rails.
Coinbase’s counter-argument is that traditional rails are "outdated". Armstrong's bet is that by building the same services on Base (their Layer 2 network), they can offer faster, cheaper, 24/7 global services that Robinhood’s traditional banking partners can't match—like instant 200-millisecond transaction "Flashblocks".
What do you think?

Down to Support ~$90Since 2024, each time the 10 day crossed the 20 day (which just happened), we had already dropped and bounced off the 50 day.
This has not happened this time. Aka = this time will likely be different.
I expect we will go down to the 50 day ~$90, if the larger bulltrend is intact, this will just be a pullback. If not, this will just be a speedbump where shorts are closed and this price rallies back up to the 20 before continuing downward.

Does HOOD Signal Distribution Below Key Support?🎯 HOOD: The Heist Setup | Swing/Day Trade Breakdown 💰
📊 Market Overview
Asset: Robinhood Markets Inc. (HOOD)
Strategy Type: Swing/Day Trade
Direction: Bearish Bias
Risk Level: High Risk - High Reward 🎲
🔍 Technical Analysis
💎 Entry Strategy
Breakout Entry: Below $115.00 support level
📍 Wait for confirmation of support breakdown before executing position
Entry Logic:
Key support zone at $115.00 has been holding price action
Break below this level signals potential bearish momentum
Volume confirmation on breakdown is crucial for validation
🛡️ Risk Management
Stop Loss: $124.00
⚠️ Position should be closed if price reverses back above this level
Risk Note: This is an aggressive stop placement. Traders should consider their own risk tolerance and account size. Adjust position sizing accordingly to limit exposure.
🎯 Target Zone
Primary Target: $104.00
🏃💨 Quick exit recommended near target zone
Target Rationale:
Strong historical support level at $104.00
Oversold conditions expected at this price zone
Potential liquidity trap area
High probability of bounce from this level
⚡ Exit Strategy: Use trailing stops or scale out in portions as price approaches target to lock in profits.
📈 Fundamental & Economic Factors
🌍 Macro Environment
Fed Policy: Current interest rate environment affecting fintech valuations
Market Sentiment: Risk-off sentiment pressuring growth stocks
Sector Rotation: Money flow moving away from speculative tech/fintech
🏢 HOOD-Specific Catalysts
Trading volume trends on Robinhood platform
Competition from traditional brokerages
Regulatory scrutiny in fintech space
Crypto market correlation (significant revenue driver)
🔗 Correlated Assets to Watch
💵 Related Pairs & Key Correlations
📍 Direct Competitors:
NASDAQ:COIN (Coinbase) - Strong positive correlation due to crypto exposure
NASDAQ:SOFI (SoFi Technologies) - Fintech sector correlation
NASDAQ:UPST (Upstart Holdings) - Fintech/lending space correlation
📍 Market Indicators:
AMEX:SPY - Overall market direction (tech-heavy index)
NASDAQ:QQQ - Nasdaq correlation (growth stock proxy)
AMEX:BTC & CRYPTOCAP:ETH - Crypto market health (HOOD revenue driver)
Key Correlation Notes:
HOOD tends to follow crypto volatility patterns
When BTC/BTC/
BTC/ETH drop, HOOD often experiences sympathy selling
Broader fintech weakness in SOFI/SOFI/
SOFI/COIN signals sector-wide pressure
Monitor NASDAQ:QQQ for overall growth stock sentiment
⚠️ Important Disclaimers
Risk Warning: Trading involves substantial risk of loss. This analysis is for educational and entertainment purposes only.
Personal Responsibility: Every trader must:
Conduct their own due diligence
Assess their personal risk tolerance
Never risk more than they can afford to lose
Make independent trading decisions
Not Financial Advice: This is a speculative trading idea with a humorous "heist" theme for entertainment. It does not constitute professional financial advice.
🎭 The "Heist" Trading Philosophy
This playful trading style represents the thrill of catching market moves - entering positions strategically, managing risk carefully, and exiting with profits before reversal. Remember: the best traders "steal" profits from the market by being disciplined and strategic! 🎪
✨ If you find value in my analysis, a 👍 and 🚀 boost is much appreciated — it helps me share more setups with the community!
⚠️ Final Disclaimer: This is a "thief style" trading strategy presented just for fun and educational purposes. Please trade responsibly and never risk capital you cannot afford to lose. 🎰
Happy Trading! Stay sharp, stay disciplined, and may the market odds be ever in your favor! 🎯💰

Robinhood (HOOD) – Consolidation After Strong Run🔍 Fundamental Highlights:
Cathie Wood’s ARK Invest recently bought 124,427 shares of Robinhood NASDAQ:HOOD , valued at approx. $15.4M, reinforcing her bullish stance despite recent market volatility. This move aligns with ARK's broader rotation into crypto-adjacent and disruptive finance plays — including names like Coinbase, BitMine, and Circle. This kind of conviction buying often precedes major inflection points.
📉 Technical Setup:
After a strong rally, HOOD is now consolidating. Price action is tightening, volume is cooling, and a pullback into the $95–$98 zone offers a compelling risk-reward opportunity. This range has previously acted as demand, and a bounce here could trigger the next leg higher.
📌 Trade Plan (Illustrative Only):
Entry Zone: $95 – $98
Take Profit Targets: $117, then $153
Stop Loss: $85 (invalidates support zone)

HOOD - Speculative Cup and HandleUsing bars patterns to plot a handle to the current massive cup looking structure on HOOD
I think price will hit the horizontal white line again before it continues to rise again
Daily timeframe

Robinhood pretends to chill, but the chart exposes its ambitionsRobinhood pretends to wander, but the chart already knows its destination
HOOD closed at 123.08 on the daily chart and is moving toward the buy zone 116.54–120.86, aligned with the ma100, which forms a strong demand area. As long as price stays above the intermediate support near 120.00, the bullish structure remains valid. The expected scenario is a controlled pullback into 116.54–120.86 followed by accumulation and a fresh upward impulse.
Once demand confirms, the first major resistance is 138–146. A breakout above that level opens the road to the primary target 180.36. Fibonacci aligns cleanly with the structure: 0.618 at 119.54, 0.5 at 123.86, 0.786 at 110.38 remain key tracking levels.
Fundamentally as of December 12 2025, Robinhood is delivering strong performance. Active users exceed 26.5M, trailing revenue is near 2B USD, and options revenue is up more than 18 %. Cash reserves surpass 5.7B USD with minimal debt. Robinhood Retirement, lending products and the fast growing Gold Membership continue expanding monetization. User activity remains high with more than 6M daily trades.
Price has not yet reached the demand zone, but volume behavior and moving averages suggest a strong upcoming entry point. Robinhood looks casual, but the chart hints that something bigger is brewing.

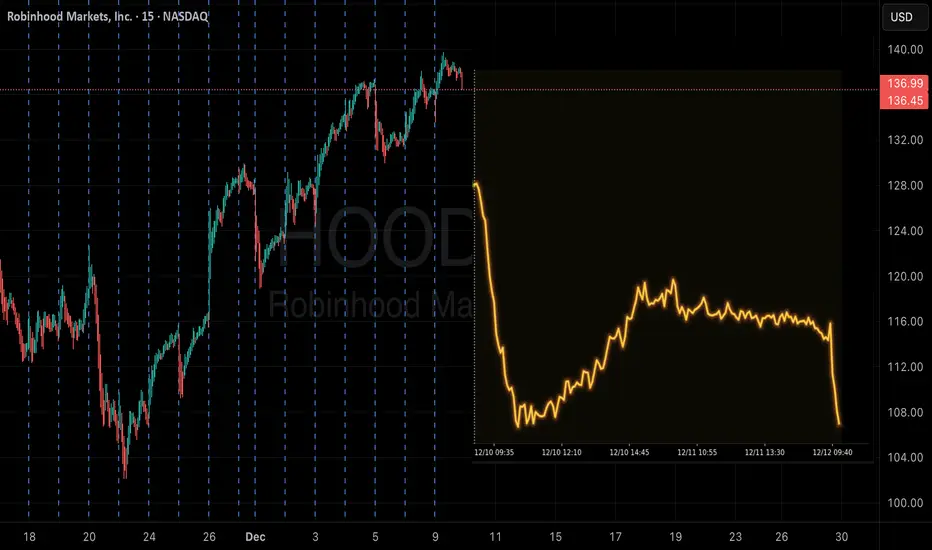
HOOD Weekly Options Strategy — Bearish Edge Despite LLM Call Adv📈 HOOD Trading Info — Weekly Signal (2025-12-09)
BUY PUTS
Confidence: 58% (Low Conviction)
Risk Level: High — Katy/LLM conflict detected
🔢 Options Setup
Strike: $126.00
Expiry: 2025-12-12 (3 days)
Entry Range: $0.41 – $0.53 (Use exact bid/ask)
Target 1: $0.82 (100% gain)
Target 2: $1.23 (200% gain)
Stop Loss: $0.25 (39% loss)
Position Size: 2% of portfolio
📊 Market Snapshot
Current Price: $137.56
Weekly Momentum: Neutral (-0.15%)
VWAP Support: $134.70
Resistance: $139.62
PCR: 0.87 (Neutral)
3-Day Outlook: Potential downward move to $132.79
🤖 Katy AI vs. LLM Conflict
Katy Prediction: Bearish → -3.46% move to $132.79
LLM Recommendation: Buy Calls
Katy Confidence: 50%
⚠️ Critical: Trade aligns with Katy’s bearish bias despite LLM call recommendation.
📰 Sentiment Overview
Mixed news: Indonesia expansion (bullish), whale activity & institutional uncertainty
Options flow shows unusual volume at $70 puts → hedging activity
Gamma risk moderate with 3 days to expiry
⚠️ Key Notes
Low conviction trade → small position recommended
Tight stop loss essential due to weak composite signals
Monitor for time decay risk on short-term expiry
Position aligns with Katy AI’s predicted downward trajectory
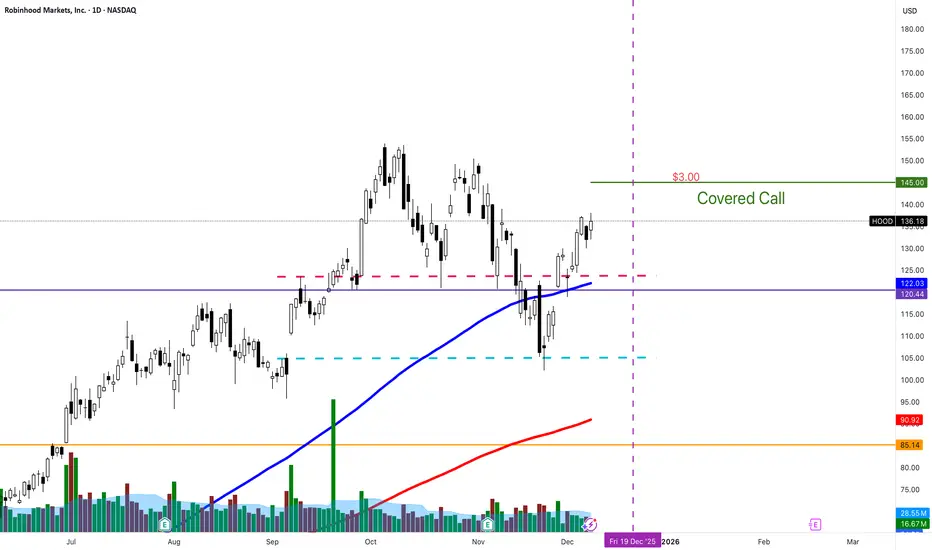
HOOD covered callsI'm in shares. WHO Doesn't love HOOD and use the app/platform all the time?! I love that HOOD is above the 100 sma. I love that its had a pull back. And I have no issue holding it for a while and eventually selling it higher. :-)
HOOD Bearish Setup?HOOD on the daily chart has completed a clear bearish Market Structure Shift after its October peak. Price is now trading below the 20-day and 60-day moving averages (around 127.54 and 128.96), confirming short- to mid-term downside momentum, while resting on long-term support near the 120-day MA around 113.17. We’ve already seen price bounce off this zone, and with premarket now around 121, the earlier “bounce long” idea is effectively behind us.
From here, the primary plan is to fade strength into the former support turned resistance around 122.50. If price pushes into that zone and fails—confirmed by a bearish daily candle or a close back below 121.00—the short bias is favored. The first downside objective is a retest of the 110.00–113.00 area around the 120-day MA and recent lows. A clean break below 104.00 would open the door to a deeper move toward the psychological 100.00 level. Invalidation for the bearish view sits above 128.00, where a daily close would reclaim the 20- and 60-day MAs and negate the idea of simple rally-fades. This is a study, not financial advice. Manage risk and invalidations.
Thought of the Day 💡
Good trade ideas are built around “if–then” conditions, not predictions. Define the path, then wait for price to prove it.
--------------------------
Thanks for your support!
If you found this idea helpful or learned something new, drop a like 👍 and leave a comment, I’d love to hear your thoughts

Opportunity buy at $78HOOD is likely to continue trending up following the green line, but there is a chance of $78. If it hits there get your options ready.
The main reason I'm looking for $78 is it completely skipped that area, yet a pullback and forming support was expected. That can absolutely happen, but if it goes back there that's where the opportunity is.
Good luck!

Robinhood - The third bearish crackdown!🏹Robinhood ( NASDAQ:HOOD ) will crash quite soon:
🔎Analysis summary:
Since we witnessed a major botton on Robinhood in 2023, this stock has been rallying about +1,600%. But always after a major +250% rally, Robinhood corrected at least -40%. Therefore it is quite likely that we will see another similar pattern playing out soon.
📝Levels to watch:
$150
SwingTraderPhil
SwingTrading.Simplified. | Investing.Simplified. | #LONGTERMVISION

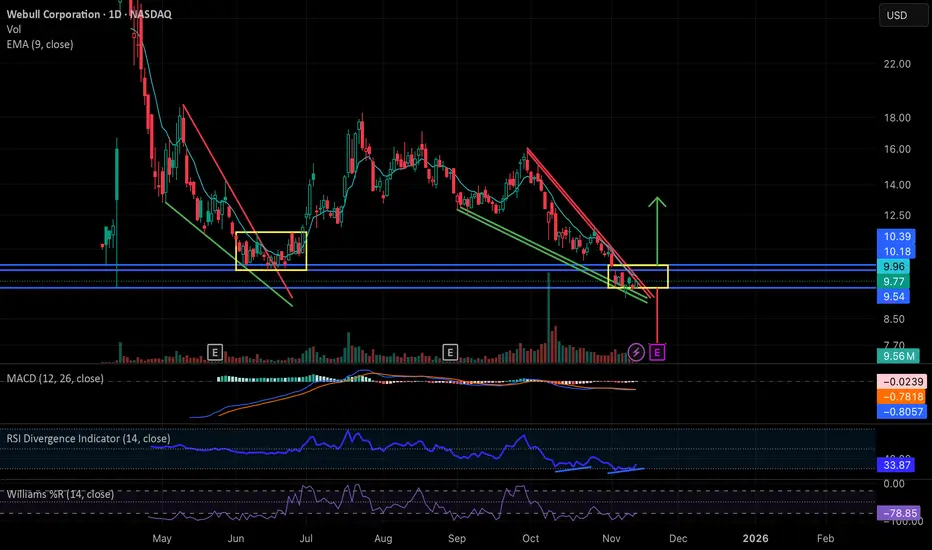
Webull: Falling Wedge Breakout ImminentNASDAQ:BULL has been in a steady decline essentially since the start of the government shutdown, forming a clean falling wedge structure very similar to the setup we saw in May and June. Back then, the wedge resolved with a brief breakout but ultimately moved into a sideways consolidation inside the yellow range before finally lifting in late June/early July.
Price is now sitting at the apex of a new wedge right as the government has officially reopened, almost to the day. With the president signing the bill, this may act as a macro green light for liquidity into year end, and BULL is positioned to potentially benefit from that.
Technically, the stock is deeply beaten down (roughly 40 percent from pre-shutdown levels), the MACD is starting to curl up, and there’s a clear daily RSI divergence. Together, these conditions make a relief move or breakout increasingly plausible.
If we don’t get a meaningful directional move between now and earnings on 11/20, then the most likely scenario is a replay of the May/June pattern: a period of sideways chop inside its current established support and resistance band zone around 9.54-10.18/10.39 while the market waits for the earnings catalyst. That report would then determine the next substantial move up or down.
In short: BULL is at a technical decision point, with momentum indicators improving, macro pressure easing, and earnings close enough that either a near-term wedge break or a consolidation-before-catalyst are both reasonable outcomes from here.
HOOD 1M AI Analysis – Neutral Trend🚀 HOOD – QuantSignals AI Analysis (1M Prediction)
Current Price: $133.27
Final Prediction: $133.08 (-0.14%)
30min Target: $132.79 (-0.36%)
Trend: Neutral
Confidence: 55%
Volatility: 32.2%
Summary:
1 stock analyzed (HOOD)
0 trade signals generated
The Market shows a neutral trend for HOOD in the near term. Small predicted movement and moderate confidence suggest holding or waiting for a clearer setup rather than taking a position.

10 Stocks READY to EXPLODE!🔥 10 STOCKS READY TO EXPLODE! 🔥
NYSE:LMND , NYSE:FUBO , NASDAQ:GRAB , NYSE:PATH + 6 more primed setups. 🚀
Watch before they run 👇
Are you in any of these trades/ investments?

Robinhood (HOOD) | Explosive Q3 & Bullish Setup📊 Fundamental Highlights – Q3 2025
Robinhood NASDAQ:HOOD just posted blowout earnings for Q3:
🔼 Revenue up 100% YoY to $1.27B
💥 EPS up 259% YoY
📈 Total platform assets surged 119% to $333B
💸 Transaction-based revenues +129%, led by crypto, options & equities
💰 Net interest income +66% to $456M
🏦 Cash reserves > $4B
👑 Robinhood Gold users up 77% YoY to 3.9M
They also hinted at adding Bitcoin to the balance sheet, which could fuel major sentiment momentum in the coming quarters.
📐 Technical Setup
HOOD is currently trading above strong support near $113–$118. Price is consolidating in a healthy zone following the earnings spike.
🟢 Trade Idea
Entry Zone: $113–$118 (watch for reaction near support)
Targets (TP): $137 and $153
Stop Loss (SL): $105
Risk-reward is attractive with strong fundamentals and growing institutional interest. If markets hold, this could be a runner.
🔔 Watchlist Material – Stay alert for breakout confirmation or Bitcoin-related news from HOOD in upcoming quarters.

HOOD Bullish Breakout? Flag Continuation Toward 170/185HOOD’s 1D trend remains decisively up after a run from ~$70 to above $155, with price consolidating around $144.80 in what looks like a Bull Flag. The key supply is the recent peak near $155.40, while demand sits at prior resistance-turned-support around $125.75, broadly aligning with the MA60. Volatility has cooled, consistent with a maturing consolidation.
Primary path: look for a break-and-hold through the flag’s upper boundary near $150–$152, then a daily close > $155.50 to confirm continuation. If that triggers, the next objectives are the psychological $170 and a measured move toward $185. For positioning, conservative traders can wait for the close > $155.50; aggressive participants might stalk the $135–$138 pullback zone only with bullish confirmation. For breakout longs, a pragmatic invalidation sits beneath $147; for range-bound longs, below $132.
Alternative path: failure to reclaim $150–$152 and a daily close < $135 would warn the flag is failing, opening a deeper test toward $120. A decisive close below $125.75 would negate the broader bullish setup in the near term and shift bias bearish until reclaimed.
This is a study, not financial advice. Manage risk and invalidations.

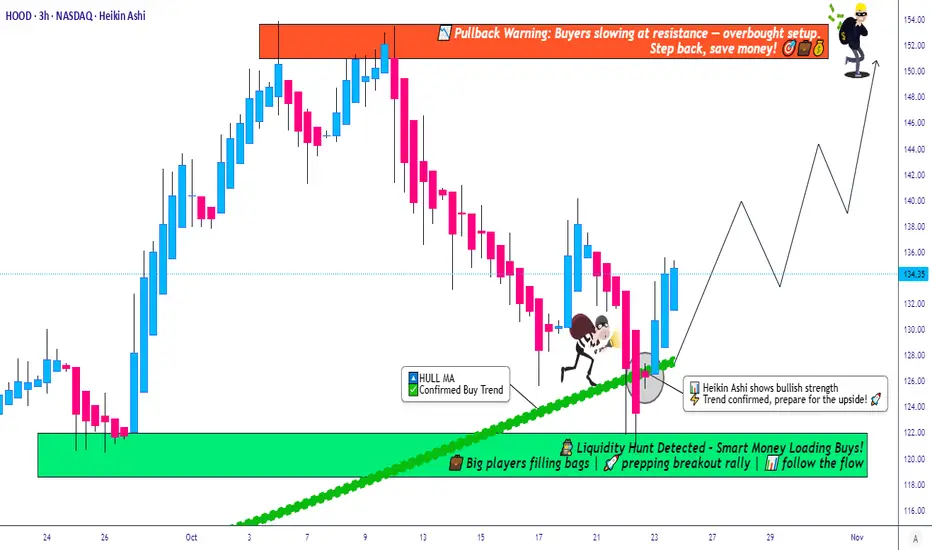
Is HOOD Ready for a Bullish Comeback?🎯 HOOD: The Pullback Heist - When Robinhood Gets Robbed! 💰
📊 Asset Overview
Robinhood Markets Inc. (HOOD) - Because even Robinhood needs a little robbing sometimes! 🏹
🔍 Technical Setup - The Perfect Storm ⛈️
Ladies and gentlemen, gather 'round! We've got ourselves a textbook setup that's so clean, even your grandma's trader boyfriend would approve!
What's Cooking:
✅ Demand Zone Double Bottom - Price said "nah, I'm good down here" twice!
✅ 786 Hull Moving Average Pullback - The golden fibonacci level that traders dream about
✅ Heikin Ashi Bullish Doji - Indecision turned into a straight-up reversal signal
✅ Buyers Flexing Strength - The bulls are back in town, and they brought receipts! 📈
🎯 The Heist Plan - "Thief Strategy" Layering Edition
💵 Entry Strategy (Choose Your Adventure):
Option 1: YOLO Entry 🎲
Jump in at any current price level (for the degenerates with strong conviction)
Option 2: The Thief's Layered Approach 🧅
Multiple limit buy orders to average in like a professional sniper:
🎯 Layer 1: $126.00
🎯 Layer 2: $130.00
🎯 Layer 3: $134.00
(Pro tip: Add more layers based on your risk appetite and portfolio size)
🛡️ Risk Management - Don't Be a Hero
Stop Loss: $120.00 🚨
⚠️ Reality Check: This is the Thief's stop loss, but YOU need to manage YOUR risk. This isn't financial advice - it's just one trader's playbook. Take profits, cut losses, and live to trade another day!
🎯 Target Zone - Where We Cash Out
Target: $150.00 🎊
Why we're taking profits here:
📍 Strong resistance at higher highs
🔥 Overbought conditions brewing
Potential trap zone - don't be the last one at the party!
⚠️ Friendly Reminder: This is MY target, not a command. You do you! Scale out, take partials, or hold for Valhalla - it's YOUR money and YOUR decision!
📈 Related Pairs to Watch - The Correlation Game
Keep your eyes on these connected movers:
NASDAQ:SOFI (SoFi Technologies) - Fellow fintech disruptor, tends to move in sympathy
NASDAQ:COIN (Coinbase) - Crypto exposure correlation with retail trading volume
SET:SQ (Block Inc.) - Payment processing and fintech sector bellwether
NASDAQ:AFRM (Affirm Holdings) - BNPL fintech momentum tracker
Key Correlation Point: When retail trading volume spikes or crypto markets heat up, HOOD typically catches a bid alongside its fintech cousins. Watch sector rotation patterns!
📝 Trade Management Tips
🎪 Scale in gradually if using the layer strategy
📊 Monitor volume - confirmation is key!
⏰ Watch intraday levels for day trading setups
🎢 Swing traders - give it room to breathe on the daily chart
🔔 Set alerts at key levels so you're not glued to the screen
⚡ Final Thoughts
This setup is cleaner than a hospital floor! The confluence of technical factors here is chef's kiss. But remember - markets are wild, unpredictable beasts. Trade what you see, not what you hope!
Stay sharp, stay disciplined, and may the pips be ever in your favor! 🎰
✨ If you find value in my analysis, a 👍 and 🚀 boost is much appreciated — it helps me share more setups with the community!
#HOOD #RobinhoodStock #SwingTrading #DayTrading #TechnicalAnalysis #StockMarket #ThiefStrategy #BullishSetup #DemandZone #PullbackPlay #FinTech #TradingIdeas #PriceAction #RiskManagement #TradingStrategy #LayeringStrategy #HullMA #HeikinAshi