JD, Longing 6/7 months. CHINA COMEBACK IS REAL...Is China going for it?
Our best Shot is JD.COM, let´s take that shot!
Also the high volume during August 20th, seems Buying.
Hang Seng HSI

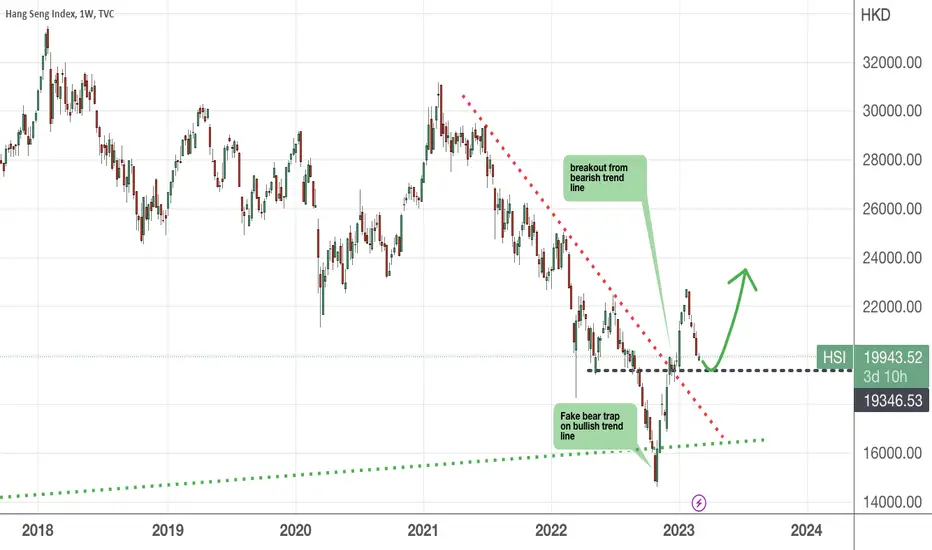
CHINA GOING FOR IT! Until Christmas? #BlowoffTop and Recession!Breakout and retest for RSI, China breakingout after 6 long years.
This will have implications on every market, they were waiting for the FED to pull the trigger and now they can go. Game on!
#JD is going, Commoditties will go for it, except #oil maybe.
But more important, #Bitcoin will have the #BLOWOFFTOP I was looking for.
That´s the News GOODS...
The BAD News is, Recession or Crisis after it. December or March 25´as late.

Shares of Chinese Companies SurgeShares of Chinese Companies Surge
As evidenced by today’s Hang Seng chart (Hong Kong 50 on FXOpen), this stock index has risen to a yearly high.
Bullish sentiment in the market is bolstered by promises from China's top leadership, including President Xi Jinping, to achieve the growth target for 2024 and to halt the decline in the real estate market.
Bloomberg News reported that China is considering injecting up to 1 trillion yuan of capital into its largest state lenders to enhance their capacity to support the recovery of the Chinese economy. This proposal is part of broader stimulus measures launched by the People’s Bank of China earlier this week.
Technical analysis of the Hang Seng index chart (Hong Kong 50 on FXOpen) indicates that the price is making a significant upward reversal:
→ This month, the price broke above the trendline (marked in red), which dates back to 2021.
→ Evaluating the angles of decline (indicated by grey arrows), it is evident that the rate of downward impulses has been consistently slowing over time, indicating exhaustion of selling pressure.
→ Price action in 2024 provides grounds to construct an upward channel (shown in blue). It’s possible that the upper boundary could be reached by the end of the year.
Let’s remember that we established a long-term upward channel in January of this year, and today’s price action on the Hang Seng (Hong Kong 50 on FXOpen) confirms its relevance.
This article represents the opinion of the Companies operating under the FXOpen brand only. It is not to be construed as an offer, solicitation, or recommendation with respect to products and services provided by the Companies operating under the FXOpen brand, nor is it to be considered financial advice.

HANG SENG Strong sell opportunity on recurring fractal.Hang Seng (HSI1!) closed below the 1D MA200 (orange trend-line) yesterday for the first time in a month and confirmed the rejection of August 30. That was a Lower High within the established Channel Down pattern that started on the May 20 High.
This Channel Down is so far following a similar structure with the one that covered the entirety of 2023. The August 30 rejection was in fact also done on the 0.5 Fibonacci retracement level after a -17.30% decline.
If this sequence of events continue to follow the April 17 2023 rejection, we should be expecting the new Lower Low to be formed on the -0.236 Fibonacci extension. Our Target is exactly on that level at 15700.
-------------------------------------------------------------------------------
** Please LIKE 👍, FOLLOW ✅, SHARE 🙌 and COMMENT ✍ if you enjoy this idea! Also share your ideas and charts in the comments section below! This is best way to keep it relevant, support us, keep the content here free and allow the idea to reach as many people as possible. **
-------------------------------------------------------------------------------
💸💸💸💸💸💸
👇 👇 👇 👇 👇 👇

Hang Seng bulls eye retest of 18kWe'll admit that the Hang Seng does not have the most bullish of structures among APAC indices, but it continues to defy bears with a break of key support. And if sentiment for global indices picks up as we suspect, it could pave the way for another cheeky long for Hang Seng bulls.
The index has seen three failed attempts to break beneath 17500 since late June. Sure, we saw one daily close below it, but the move was mostly reversed on Monday. A bullish divergence is also forming on the daily RSI (2), hence the bias for another crack at 18k minimum - a break above which brings the June and July highs around 18,400 into focus.
Yet as the 4-hour chart shows prices paused at the weekly pivot point with RSI (2) overbought, we'd prefer to wait to see if prices retrace within Monday's range before seeking longs. This could help improve the reward to risk ratio for bulls whilst prices hold above last week's low, with 18,000 and 18,400 in focus for upside targets.

Hang Seng _ Wedge Pattern forming, Target 1_(20694), T2_(29000)Long Term Analysis : "Wedge Pattern" forming in "Hang Seng" and down trendline is "Breakout". So market move to Bullish Trend, wait for if Retest or Trend Continuation. And the 1st Target is 0.5 Fibonacci Retracement price (20694), 2nd Target is Wedge Pattern Top is 29000.
After Reach the Wedge Pattern Top (29000) expect Breakout the Pattern.
I want to help people to Make Profit all over the "World".

Hang Seng Index: Home Stretch 🏁The HSI has risen slightly since Friday, which we interpret as part of the internal substructure of the turquoise wave 4. We therefore expect further sell-offs. However, it is not far to our turquoise Target Zone between 18,341 and 17,899 points. Within this range, the index should place the low and turn upwards. Subsequently, a determined rise above the resistance at 19,772 points is on the agenda, which completes the magenta-colored wave (1). Accordingly, long positions could be opened within the Zone, with stops placed around 1% below the lower edge. Should the price fall significantly below the lower edge, this will set in motion our 38% probable alternative scenario, which implies further setbacks with the magenta wave alt.(ii).

HSI poised to Retest the Breakout level and RallyHang Seng Index is pulling back to breakout level in the next few weeks, followed by rally.

HSI (hang seng index)It seems HSI will prepare for a bullish trend.
With technical analysis and checking the wave structure of the chart, the corrections ahead of it will probably be a buying opportunity

A Han Seng Index Trade Early Monday morning Hello everyone,
The markets are slightly ruffled lately and there is an opportunity to short HS50 on Monday.
Trend:
W1: Up
D1: Down
H4: Down
Moving Average:
Below the Daily MA
H4 pointing downwards
Pattern:
Gartley on M15
Strong resistance at 16450.
Target is 16000
Double top on H1 and lots of divergence
Stop loss of 40 pips and a target of 120.

Hang Seng: Is a Turnaround Coming?The Hang Seng Index, with everything measured in Hong Kong Dollars rather than US Dollars, offers a distinct perspective within our analysis portfolio, focusing on the Hang Seng Index Futures contract. Starting with a weekly chart overview, we've identified that the initial cycle likely concluded in 2008, followed by a flat correction. Notably, the correction for Wave B exceeded 100%, suggesting that the drop towards Wave (A) level, or slightly lower, is plausible.
However, there's an alternative perspective that at Wave (A) already concluded Wave II, although the rapid temporal progression for such a wave suggests this is less likely. We anticipate further declines, yet it's critical to acknowledge a potential Wave (1) and Wave (2) formation at the 78.6% level. A drop below this point should lead us towards the HK$10,500 mark, aligning with our initial entry point around HK$11,300. Despite this, it's premature to issue a limit order given the ample time to observe developments.
Daily chart observations further indicate an expectation of a 5-wave structure from (B) to (C), which has been forming quite elegantly despite Wave ((iv)) intruding into Wave ((i)) territory. This necessitates our acceptance of the current count unless we opt for an interpretation that sees a completed Wave (2) at the point marked as Wave ((iii)).
Delving into the 4-hour details reveals a persistent downtrend from the onset of what's identified as Wave ((iv)). To reverse this trend, surpassing the invalidation zone would be crucial, suggesting a reconsideration for long positions. Until such a shift occurs, the bear flag's presence likely continues to restrain any significant upward movements in the market.

Tell your hedge fund to buy HSITell your hedge fund to buy Hang Seng Index and some Chinese stocks. Good returns will be coming in next years.

Anta Sports: Final Descent 🛬Anta Sports recently continued to rise after an impulsive downward spike narrowly missed the magenta Target Zone between HK$58.95 and HK$33.60. Thus, it is quite possible that this downward spike has already completed the low of the green wave (2) and that the stock is now marching higher. However, we are not convinced that this is the case, so we believe that the stock will soon pull back, drop below the support level of HK$67.85, and then run into our magenta Target Zone. Once this has been explored, we expect the wave (1) in magenta to lead to strong rallies above the resistance at HK$125.30.

Hang Seng Index - A potential multi bagger in the long termRead the latest article here
With this mask off policy, we can expect more people to come out of their home and resume their pre-Covid days - shopping, meeting friends at cafe, more dining out, weekend travel,etc. This is good news for local consumption along with the incentives that the Government is currently offering.
I posted here to go LONG on HSI late last year when it breached the all important weekly bullish trend line. Macroeconomic data and news gave me the assurance that the major storms have passed and it is only a matter of time before Hong Kong picked up its pace and roar back into action once more.
This week will , imo be another good opportunity to go LONG or accumulate for those who had done so.
The Hang Seng Index is Near Important SupportThe Hang Seng Index is Near Important Support
The economy of China is hit by the decision to liquidate the developer Evergrande due to a debt of USD 300 billion. Bloomberg writes that this will have huge consequences for all of China.
While the S&P 500 index rose by more than 3% since the beginning of January, the Hang Seng index fell by more than 8%. JPMorgan and HSBC point to local government debt, non-performing bank loans and negative sentiment in the private sector.
The weekly chart of the stock index Hang Seng (HSI) shows that:
→ The price is in a downward trend, which is shown by the black line.
→ The price dropped close to the 2022 minimum.
→ The RSI indicator is located near the oversold zone.
What is important: the price is near the lower border of the long-term channel (shown by orange lines), from which support can be expected.
Expectations of investors to lower the interest rate from the Fed may increase the appetite for risky assets, which features Chinese stocks.
As Reuters writes, Goldman Sachs noted in its note to clients that hedge funds are actively buying Chinese shares - for the period from January 23 to 25, there was the largest capital inflow in the last 5 years. Perhaps the managers of hedge funds believe that the plans of the Chinese authorities to stimulate the economy for more than $280 billion will become a reality, and the price of the Hang Seng index will make a jump from the lower border of the long-term channel, breaking the black line of the downward trend.
This article represents the opinion of the Companies operating under the FXOpen brand only. It is not to be construed as an offer, solicitation, or recommendation with respect to products and services provided by the Companies operating under the FXOpen brand, nor is it to be considered financial advice.

Chinese Economy (HSI) Supercycle ReversalThe Chinese economy has had 4 consecutive years of closing in decline. Evidently, the Chinese economy supercycle (as depicted in the chart) indicates that a reversal is well overdue (or superdue in this particular context). By the end of this year, it can be expected to see a relatively massive reversal in the Chinese economy, one that may catch many by surprise. On the daily timeframe, this reversal started in this past week, Monday 01/22/24, where China likely saw its last lowest of the year. There's still potential to test 10/31/22 low and maybe even break it at some point in February, but doing so will imply an even larger repump, leading to potential break of the yearly supercycle. In any event, if China does indeed maintain the recent low as the yearly low, it means it intends to engulf the yearly red cycle this year, latest 2025. But 2025-'26 should mean the chinese economy once again sees a powerful decline. After this, Chinese economy could choose to completely collapse as an economy or overcome odds and revive a green supercycle economy.
In my fairest opinion, I think Chinese economy will explode to the upside, likely with fusion technology as the leading catalyst. Artificial Intelligence will ultimately be the wildcard that decides whether this catalyst holds the economy in whole or whether it briefly collapses until further regulation is upheld.

HSI: Already finished? 👀The HSI has risen sharply since Monday. Nevertheless, we continue to believe that the index is still working on a magenta-colored downward structure and is therefore not yet finished with its correction. Only after this five-part wave, and thus the turquoise-colored wave 3, has come to an end should things pick up a good bit - even if there is still further downside on a Long-term level. However, there is also a 33% probable alternative, which envisages a sustained rise and considers the past low to be the low of the green wave alt.(2). This scenario comes into effect if the resistance at 18 846 points is exceeded.

Hang Seng Index God ViewThis version of God View includes Fractal Analysis
China QE = Roaring 20s or Black Swan Bust

HSI ForecastThe current status is uncertain, and there are two possibilities:
1. If it is the 2nd wave of an upward trend, the HSI (Hang Seng Index) will rebound in the short term and surpass 16500. The level of 16500 will be tested multiple times, which would be the most favorable situation for the HSI.
2. If it is the 5th wave of a downturn, the HSI will break the 15400 level and drop even further, below 14470, previous bottom, and towards 13000.
In 2024, I expect the HSI to fluctuate between 15300 and 17100 until the market gains a clearer understanding of China's economic performance.
At the beginning of 2024, in the very short term, the trend is likely to decline further. I anticipate that the HSI will test a near-term new low at 15300. However, after the 1st quarter, it could benefit from a lower Federal Reserve interest rate. Nevertheless, the strength of the rebound may not be very strong due to the prevailing uncertainty in the market. We can target the rebound to 16500 or max 17000.
Disclaimer
Please understand the forecasting will be subjected to many factors and this is the vision at this moment. This comment is not encouraging you to follow or make any investment decision. You will be the only one be responsible for your investment decision and any related behavior. I am not going to bear any legal or non-legal responsibility.

A few trends in China's economyToday, we would like to briefly discuss a few underlying trends in China's economy, touching on the subject of unemployment, demographics, and deflation.
Youth unemployment
While the unemployment situation has improved in 2023, youth unemployment (for those aged between 16 and 24) has been a longtime issue in China. Indeed, it has steadily risen since 2018 (back then, it stood at around 10%), with government programs promoting a higher level of education contributing to the problem. As a matter of fact, this year, in June, the youth unemployment rate hit a staggering 21.3%, prompting the Chinese government to stop reporting the number.
Illustration 1.01
Illustration 1.01 shows the daily chart of China’s unemployment rate.
Demographics and fertility
Another big issue in China is the country’s aging population and declining fertility among women. The median age has risen from 28.9 years in 2000 to 34.1 years in 2010 and 37.4 years in 2020. On the other hand, the average number of births per woman stood at 1.6 in 2000; in 2012, 2014, 2016, and 2017, the average rose to 1.8. But since 2018, the rate has been rapidly collapsing. In 2021, the number stood at 1.2, representing approximately 33% decline since 2018.
China’s deflation
As much of the Western world grapples with inflation, China has the opposite problem. For November 2023, the country recorded -0.5% deflation compared to the previous year. With that said, there were three periods when China experienced deflation (annually) since the 1990s. The first period occurred between 1998 and 1999, when the annual inflation rate was -0.8% and -1.4%. The second instance took place in 2002, and the third in 2007. For the eleven months of 2023, the inflation rate averages about 0.3%, the lowest figure since 2009.
Housing prices
Amid the ongoing property crisis in China, house prices have been sliding down this year. Actually, there were only two prints when the year-over-year change was not negative, particularly in June 2023 (coming in at 0.1%) and July 2023 (coming in at 0%).
Please feel free to express your ideas and thoughts in the comment section.
DISCLAIMER: This analysis is not intended to encourage any buying or selling of any particular securities. Furthermore, it should not serve as a basis for taking any trade action by an individual investor or any other entity. Your own due diligence is highly advised before entering a trade.

China A50: Last wave down. Prepare to long for the new year 2024To summarize:
1. We are currently in the 5th wave down. The last wave.
2. Potentially a sharp drop for the last 2 weeks of Dec 2023.
3. Price might follow the same pattern as Dec 2018.
4. Target 10130-10145.

$TENCENT shows sign of rebound with bottom formed$TENCENT shows sign of price bottoming on last Thursday with high volume supporting the price from going down lower. (Yellow square box)
Based on our analysis, the rebound signals further sets in with price recover more than 50% of the Friday morning price fall. This indicating demand is coming back in after 2 weeks retrace & selling pressure easing. Which could lead to a price rebound in the coming weeks.
Our trading method: we are looking into Bull CBBC on this potential short term rebound.
#hkex #supplydemandtrading #supportresistancestrategy #cbbc #highriskhighreturn #stocktrading

Hang Seng Index: Pending Explosive Move UpIn this analysis, I talk about how I used Elliott Waves to count the moves of Hang Seng Index from Jan 2018 to 24th Nov 2023.
The main points to take note are these:
1. The corrective move down in 2023 is over.
2. We are still in a minor corrective move down.
3. But a wave 3 up is round the corner and that it will be an explosive one.
4. The risk is low for this bullish trade.
