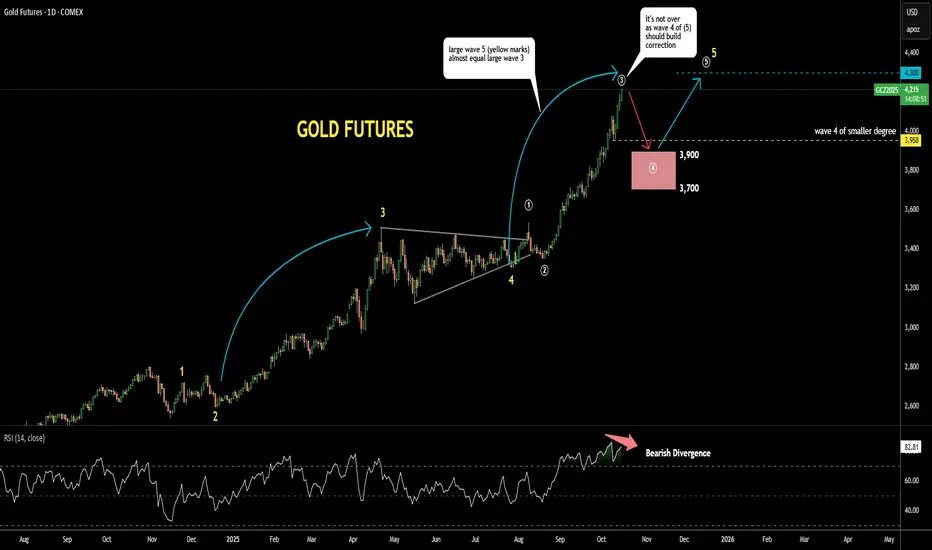
Gold Update 05JAN2026: One More Up to $4,584-$4,700Happy New Year and best wishes!
Indeed, it’s not an Ending Diagonal anymore
The Leading Diagonal in wave 1 confused me into thinking the entire wave 5 was an Ending Diagonal
As the dust settles and the chart moves further to the right, the structure becomes clearer
We now have waves 1–2–3–4 in place, and the bottom of wave 4 has held above the peak of wave 1 at $4,250, which is healthy
The final wave 5 of (5) of ((5)) could be underway, targeting the blue box area
This lies between $4,584 (the all-time high) and $4,700 (the 61.8% Fibonacci projection of waves 1–3)
Both targets align well with the yellow uptrend
Wave 5 should print lower on RSI while price makes a higher high, confirming bearish divergence
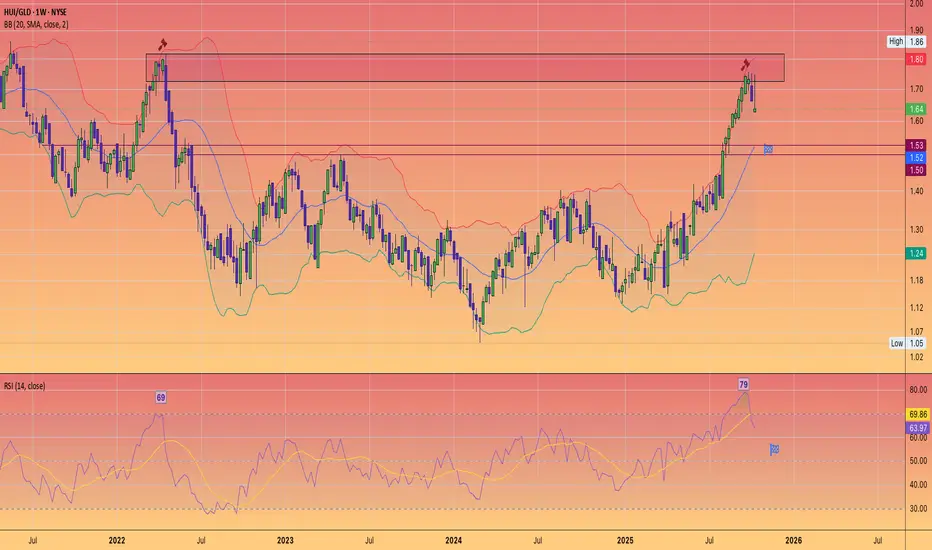
HUI

Gold Update 25DEC2025: Ending Diagonal RechartedNot all our projections play out as we plan
This time Ending Diagonal grew larger but the structure is still valid
as it unfolds in 3-3-3-3-3 sequence
I recharted it for you on 4-hour chart
RSI will be our guide as always:
wave 5 on RSI should be lower than on the price chart
to show Bearish Divergence

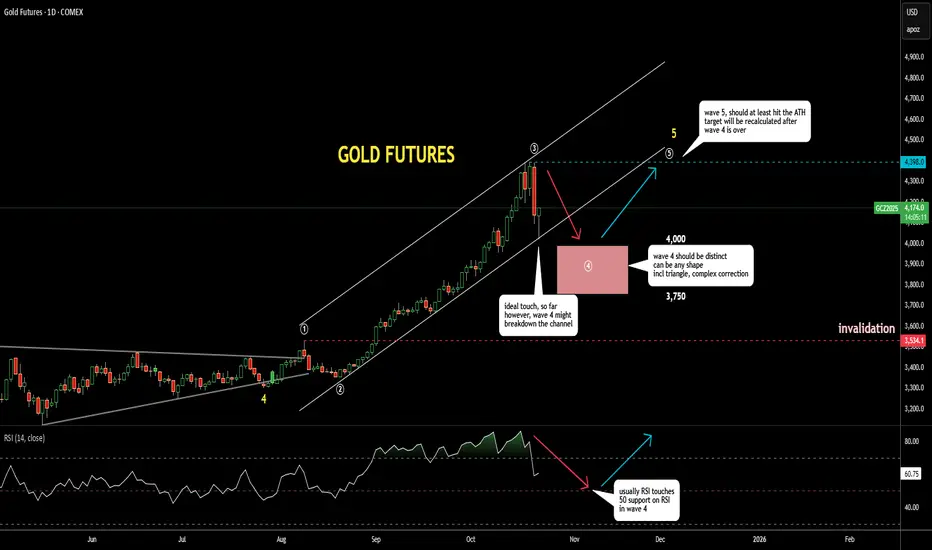
Gold Update 17DEC2025: Ending Diagonal Almost Done Market volatility dries up as price approaches the all-time high
Out of the three scenarios posted last time, the first one is playing out
Price is shaping an Ending Diagonal in the final wave up, which should at least retest the record high around $4,400 to complete a full five-wave sequence
Meanwhile, RSI did not build the same bullish momentum and is showing early signs of bearish divergence against price
This confirms that the current move is likely the final wave up and also warns of a possible reversal after price retests the record high
Minor support is located at the previous low around $3,901
Typically, the valley of the larger wave 4 contains the first drop in the event of a reversal
This major support is located near the $3,300 level
Let’s see how price behaves around the all-time high first

Gold Update 02DEC2025: Multiple Options Are PossibleThe price has been stuck in the range as expected for wave 4
Let’s navigate this chaos and build viable paths on the chart
Option 1: Ending Diagonal wave 5 — pink marks
This option is based on the idea that wave 4 looks disproportionately large compared to wave 2
It could already be over after the first large move down to the $3,900 area
The current ascending zigzag may be shaping an Ending Diagonal in wave 5 to retest the former top around $4,400
Option 2: Triangle — orange marks
I left this path on the chart last time for visualization and it still could play out
Waves A and B could be completed with waves C, D, E ahead
Option 3: Large sideways consolidation (range, box) — white marks
This scenario implies a flat correction within the established $4,400–$3,900 range
Which path do you think the price will take?
Share your thoughts in the comments below

HUI/GLD showing weekly exhaustionUnderstandable given the Euphoria in the Precious metals markets the past two weeks.
Is the Bull Run completely over?
I don't think so.
#Silver has yet to Hit $95
and is merely testing it's own breakout level of its historical all time high's.
As this ratio is indicating the past few weeks it appears it wants to come back into previous resistance zones and also reset the RSI to around 50, so still in a bull market.
Would be a welcome correction.
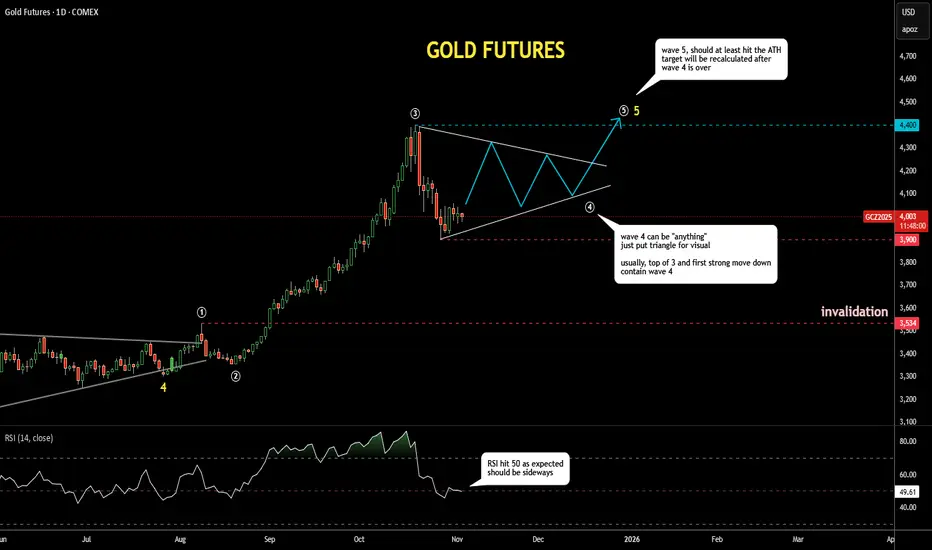
Gold Update 04NOV2025: Wave 4 Dropped Into Target AreaGold futures dropped into the pink-box target area based on the Fibonacci retracement between $3,750 and $4,000.
As expected, the RSI has reached the 50 “waterline”, where it could find some support and start moving around that level.
Many traders lose money in fourth waves, as they can be “anything” and often last longer than one’s pocket. I’ve outlined a triangle shape in wave 4 just for visual context.
The range built through the peak of wave 3 around $4,400 and the bottom of recent panic selling near $3,900 will likely contain most of the volatility in wave 4.
It can take time… testing one’s patience.
Gold Update 22OCT2025: Wave 4 Correction is in Progress Sooner or later, both overbought conditions and bearish divergence tend to play out — and we’re seeing that now.
Gold just experienced a massive and surprising sell-off, with many stop-losses triggered.
The price dropped $300 in a single day, compared to its usual $50 range.
This likely marks the start of wave 4, as expected. Price briefly touched the bottom of the uptrend channel and bounced off quickly.
However, wave 4 is rarely straightforward.
It can take many corrective forms, such as a triangle or sideways consolidation.
It also tends to be larger than wave 2 and should become clearly visible on the chart.
The target range for wave 4 remains $3,750–$4,000. While $4,000 has already been touched, the corrective structure isn’t fully formed yet.
We should wait for wave 4 to fully develop before setting any expectations for wave 5.
Gold Update 15OCT2025: RSI Hints at CorrectionGold continues to dominate headlines, printing new all-time highs one after another
The 4-hour Bearish Divergence earlier failed to halt the rally
Now, a Bearish Divergence has appeared on the daily time frame, as the latest price high was not confirmed by RSI
This signals that a peak may be forming
A corrective phase could soon unfold as wave 4 within the larger wave (5) structure
The expected retracement could reach the 38.2–61.8% Fibonacci zone of wave 3 of (5), targeting the pink box between $3,700 and $3,900
The low of the previous minor wave 4, near $3,958, may serve as initial support during the pullback
It is worth noting that the magnitude of wave (5) so far mirrors that of the prior large wave (3)
Therefore, the projected target for the final wave 5 of (5) remains around $4,300 as a conservative objective
However, if momentum extends further, wave 5 could evolve into an extended move and drive prices toward new record highs beyond that level
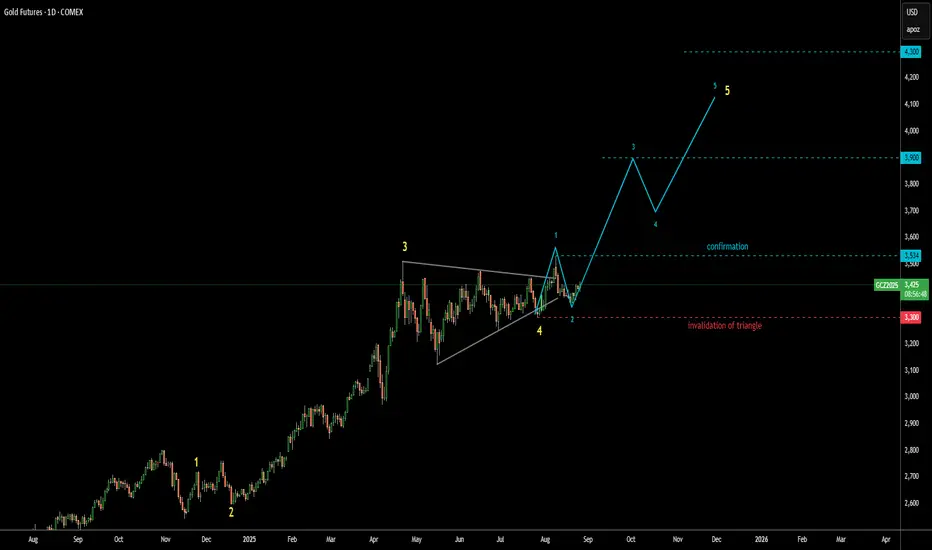
Gold Update 26AUG2025: Bullish Confirmation Above $3,534 The gold futures price has made a U-turn as it didn't trigger Triangle's invalidation at $3,300
This bounce back could be a harbinger of wave 3 within the larger degree wave 5
It will be confirmed once upmove breaks above the top of wave 1 beyond $3,534
I erased the complex correction scenario as the price might be taking off right now
I added the breakdown of the upcoming large wave 5 into smaller 5 waves inside
Target range remains intact between $3,900 and $4,300
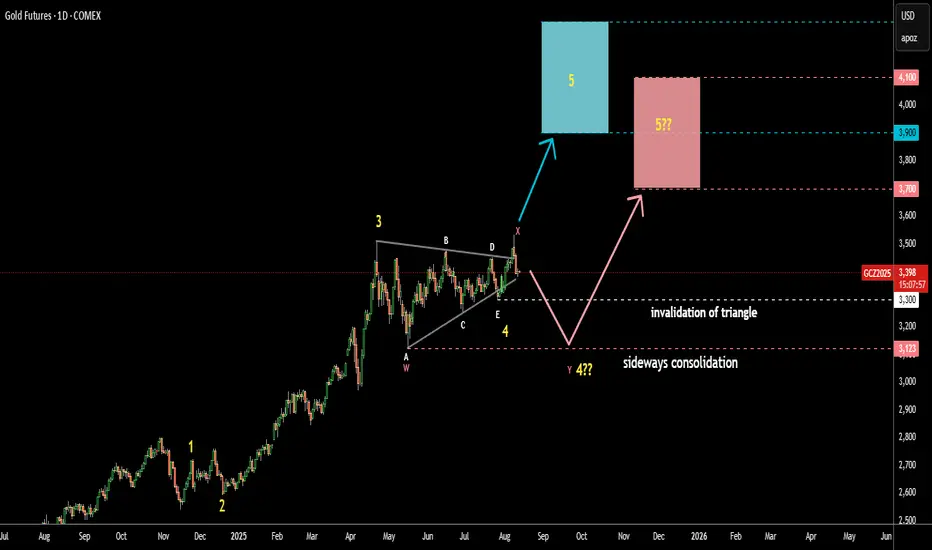
Gold Update 13AUG2025: Risk of Sideways Consolidation Last Friday, August 8, the price failed to progress above the April top as it closed underneath. Hence, there are two possible scenarios from here:
The price could have just completed the first wave up in a larger wave 5, and we may see a retracement. This setup remains valid as long as the price stays above the last wave E of the Triangle at $3,300.
The large sideways consolidation (WXY) might take shape, potentially retesting the bottom of wave A at $3,123. In this case, the target could drop lower, with potential support in the pink box area between $3,700 and $4,100.
Which one do you think plays out?
Gold Update 06AUG2025: Price Tests ResistanceThe Triangle pattern in gold futures remains highly reliable.
Wave E held above the low of Wave C, maintaining the structure.
Price is now testing the Triangle’s upper resistance.
A breakout above this level would confirm the bullish setup.
The target zone remains unchanged: $3,900–$4,300.

Gold Update 28 JULY 2025: On The EdgeGold is accurately following the path shown in my earlier post.
Wave D respects the triangle rules, staying below the top of wave B.
Wave E appears nearly complete, even piercing the A–C support line.
This is acceptable as long as wave E stays above the wave C low at $3,251.
Keep a close eye on this invalidation point.
The target range remains unchanged: $3,900–$4,300.

Gold Update: Possible Triangular Consolidation Before New RallyIt looks like corrective wave 4 is in the making within a large Triangle
3 waves A, B and C already emerged in 3-waves structure
which confirms triangle
Wave D should stay under the top of wave B
Wave E could either touch or break down the support line
It should keep above the valley of wave C
Target area changed higher as this consolidation tends to narrowing within a
contracting triangle.
Lowest target now $3,900
Optimistic target is at $4,300
Breakdown below $3,123 would invalidate the pattern

Gold Update: 2 optionsIndeed, the top metal surged well beyond $3,000, as I mentioned in my earlier post (see related post for details).
The price reached a new all-time high of $3,510 before pulling back, as expected.
So far, the retracement has been rejected at the trendline support around $3,123 (futures).
From here, there are two possible scenarios:
1) Blue Labels
The price may have already completed wave 4. If so, we could now see a large wave 5 move to the upside.
This wave could reach the blue target box, which represents 61.8% to 100% of the distance from wave 1 to wave 3, added to the bottom of wave 4.
This target zone lies between $3,700 and $4,100.
Keep in mind that gold is a commodity, and commodities often have extended fifth waves — so the higher end of the blue box is still possible.
2) White Labels
Typically, fourth waves retrace down to the valleys of previous lower-degree fourth waves.
In this case, the market could form another leg down to complete a larger, more complex correction, potentially hitting $2,975 before wave 5 begins.
If that happens, the target for wave 5 may be lower, but with a possible extended fifth wave, it could still reach the blue box area.

Gold Update: $3,000 Is Not the Final DestinationGold futures broke above minor consolidation, so the map should be updated.
Wave 3 becomes extended (blue small waves) and it is looking to test the trendline resistance near magic $3,000 level.
But that's not all as we didn't see wave 4 yet.
It should be complex to alternate wave 2, which was simple.
Wave 4 could hit the $2,500-2,550 area to complete correction.
We can measure it after wave 3 will be completed.
And finally, wave 5 is usually extended in commodities.
It could be huge, wave 3 already travelled over $1,000,
imagine where wave 5 could rocket then.
It will depend on how deep wave 4 would retrace first.
Stay tuned, share your thoughts below, lucky trades to all of you!

Still work to do before the next phase of the PM bull market $375 is the number HUI needs to sustain above to push PM stocks a lot higher.

Gold futures eyes $2,577 in acceleration of upside impulseA pullback in yellow wave (2) almost hit 61.8% of yellow wave (1).
Now we see the strong minor impulse to the upside.
It can be a part of large yellow wave (3).
The target is projected at the distance of 1.618x of wave (1) with aim at $2,577.
Watch how price breaks above the top of wave (1) beyond $2,086
Risk/reward is 1:2.5, one could get it better if goes on a lower time frame and buys on
minor pullback following minor wave 1 of (3).
Do you see gold futures touching $2,577?

Are we at a bottom for miners?Miners may finally be at or near a medium term bottom. They were up nicely today while gold was down. Also the technical are good. They are at the primary trendline, and there is a bullish RSI divergence. There is major support around 31, but not sure it will get down there.

Gold and Sentiment, Turbo Bear?My favorite ratio for cutting through the noise is an LT view of Gold/Oz($) : HUI (the Gold Bugs Index). Generally when it rises we gold bugs suffer because the price isn't reflecting our buying habits. That's why I'm looking for the next bottom on this chart sometime in July that might coincide with this broadening wedge... A date that keeps recurring for me is June 28th, and I haven't figured why just yet..
The broadening wedge may indicate that some dramatic downside is very possible, I just hope that it's in late summer after some profit-taking. Reasons for hope here:
1] a breakdown from this channel is giving me hope, as sentiment is outstripping gold price performance.
2] it seems to coincide with deep retrace and ultimately a break below the 100Mo MA, the 30Wk Ma, and 30D Ma are firmly below. (Looking for the 30D to cross below 30Wk for TURBO BEAR)
3] downward cloud pressure is huge and respected at this time
See my previous post on GDX/Gold for another view at this pivotal time


Long term analysis of gold and mines versus DJIIn the next next 2 years gold and HUI will rise significantly while DJI will fall by further 50%.
HUI:Gold ratio which is still quite low (0,16) will rise to about 0,45.
Enter mines now and exit after HUI:Gold exceeds 0,4.

Silver structure might have changed. First down then up to 22.50The earlier idea could be completed as structure gets more complex with possible double three WXY to emerge.
The drop into blue box should occur then to make a wave X retracement.
Then the metal could hit 22.50 when another zigzag up in wave Y unfolds.

Gold Update: Wave 5 up could be extended to hit 1921-1965The wave (4) has been completed as per the plan (see related).
The wave (5) could be extended and of the same size as wave (3) and it can hit the all-time high and even higher level of 1965.
