XAUUSD Weekly Analysis (Daily Timeframe)let's walk through our thoughts process. we expect gold to reaches to resistance zone (2551-2563) and after that continues its movement downward to the support zones (2098-2080) and (2062-2043). consider these zones for your long term analysis and trades.
Ichimokuchart

XAUUSDThere are two support levels
2420
2385
and we see two important resistance levels:
2477
2454
what we expect is a reaction of price to the level of 2454 and a downward movement to the level of 2420.

Xauusd Weekly Analysis (4H time frame)In daily and 4h time frame the xauusd has been in the descending channel. During the past 147 candle of 4H time frame (the past 32days).
It could not reach a higher price level. It has also hit the Ichimoku support zone seven times in daily time frame and we see weakness in its trend.
According to our last week analysis gold exactly hit it's 2368 resistance which was considered as an important range that caused great drop.
This week, we expect gold to make a move to higher levels again and continue its downward movement to the lower levels that we consider.
In case of breaking the range zone of 2321, the gold will definitely reach to the range of 2209-2289_2212.

Xauusd Weekly Analysis (4H time frame)In the daily time frame xauusd trend is in its downward movement, it is in its support zone (2286) which is a strong support.
After that we expect it to reach to the zones which are mentioned in the chart.
If it loses its support zone (2276), it will definitely reach the 2210 price range.

Ichimoku Watch: SPDR S&P 500 ETF Trust Engaging with SupportDesigned to track the performance of the S&P 500 market index, the SPDR S&P 500 ETF Trust (current AUM is US$529,081.40 million) is engaging with an interesting area of support on the 4h chart after gapping lower on Wednesday. This follows an all-time high forged last week at $534.00.
SPDR Testing Support
The uptrend in this market at the moment is obvious, and traders, therefore, will be seeking locations for dip-buying opportunities.
The Ichimoku Cloud’s upper limit was tested yesterday, currently between $525 and $529 (the difference between the Leading Span A and Leading Span B), and could be enough to encourage buying. This is also the first time the Cloud has been tested since the Leading Span A crossed above the Leading Span B at the beginning of May.
Within the Cloud, there is also a 100% projection ratio at $522.00, which, for many harmonic traders, will be recognised as a potential AB=CD support level. Further to this, a trendline support (from the low of $493.86) is close to this level.
Adding to the above analysis, the Conversion Line appears poised to cross back above the Base Line, which, given the uptrend, would be observed as a bullish signal.
Price Direction Favouring Bulls
The trend in this market and the current support structure suggest that it remains a buyers’ market. Within the Ichimoku Cloud, the AB=CD support and trendline support could provide a floor to which dip-buyers may be drawn.
However, should the Conversion Line cross back above the Base Line prior to testing the above support area, we could see dip-buyers enter this market earlier to challenge all-time highs.

Xauusd Weekly Analysis (4H time frame)We expect xauusd price continues its downward movement to the support zone (2300 to 2312) and back upward to resistance zone (2374 to 2364). Then the price will fall again to the support range of 2334.

Bajaj Finance Flat CorrectionBajaj FInance is in a long term flat correction which started from late 2021 & it can continue for few more months.
It loks like in Wave C where it can make a 5 wave fall. Minimum target should be 6443 of this pattern but seeing the impulsive wave it shouldn't stop here & we can see straight fall to 5800 levels then later on 5200-5300 levels. This pattern can go in till April May 2024
As per Ichimoku too it has broken weekly cloud & next monthly cloud support appears near 5900 levels
Buying otm puts for march or April is not a bad option right now.. Risk reward is good with small risk & can hedge this trade too if you want

ITC new runITC can start a new run after results if holds 435 levels..
Buy in 4440-445 range with 435 stop los short term or 425 medium term with a target of 500 to 530 levels..

Ichimoku Kinko Hyo - The Most Underrated Indicator (e.g. NAS100)Welcome to my first educational post. This is a big one, Ichimoku Kinko Hyo is the most underused, underrated, least understood and yet most powerful trend indicator available to the general public. I'll first briefly describe the 4 components:
- Tenkan Sen (turning line): it's like a small period moving average but calculated slightly differently. So if price breaks it, it's a first signal of a trend reversal but always wait for the retest.
- Kijun Sen (standard line): it's like a larger period moving average but like the Tenkan it's calculated differently. One interesting note is that when it flatlines it represents the 0.5 fib level of the current range.
Together, they are used for crossovers just like classic moving averages.
- Kumo (Cloud): which is composed of 2 special moving averages called the Senkou Span A and the Senkou Span B. Generally serves as a support/resistance zone and is also subject to crossovers that can confirm reversals (not signal) since it is too slow to signal them. The thicker the cloud the stronger the trend and vice versa.
- Chikou Span (Lagging Span): Mirrors current price action 26 periods in the past. In simple terms, it puts things into perspective and can detect potential blocking points for price.
Here is a case study of the NAS100 and monthly Ichimoku:
What do we see? (Follow the steps)
1) Price breaking the Tenkan and retesting it twice. This is already a major bearish signal.
2) Following the Tenkan break, price doubled down and broke the Kijun + retested it TWICE!
A strong bearish confirmation that the downtrend will continue.
3) The Tenkan/Kijun crossover, this is like a death cross of MAs (look it up).
4) This is a reversal signal. You'll notice how price never touched the cloud again. The monthly Ichimoku really puts things into perspective. It really enables you to see the bigger picture and that it is okay to buy in a bear market. You just have to let it guide you.
5) First confirmation of the reversal: the break of the Tenkan + retest.
6) Second confirmation of the reversal: the break of the Kijun + no retest was even needed.
7) 'Golden cross', the Tenkan/Kijun crossing over which is the third confirmation and that price is simply extremely bullish.
8) The Chikou Span breaking past price. This is similar to price breaking a resistance level, it gives the same kind of signal. This is the final bullish confirmation.
This a very summarised explanation of how the Ichimoku Kinko Hyo indicator should be used BUT if you want to learn more about it, I strongly suggest you read the book by Karen Péloille: Trading With Ichimoku, A Practical Guide to Low-Risk Ichimoku Strategies.
As always, have a lovely Sunday and happy trading! ;)

US Government Bonds 2 YR Yield 📌💵💰Daily chart.
Resistance zone.
It remains to be seen the position of the FED, whether or not to lower the rate?
Make up your mind.

Dogecoin ,,, Tecnicall analyst Dogecoin is at the bottom of the ascending channel in its weekly time, which I imagine a good growth from Doge coin ,., now it is in the Cuomo cloud, when it breaks the Cuomo cloud in the weekly, it can have a high growth. 📈

KAVAUSDT 1DGuys, keep your eyes on this currency,
KAVA has done a good floor construction and made a higher floor than the previous floor, also the cloud of Ichi has broken one day.
I expect the price to grow up to the indicated area (0.94) Then the price reaction to this level should be re-examined
Its main resistance, which is dynamic, is at 0.95, and static support is at 0.7. If he can break the resistance, we can expect very good moves from him. It is almost 9% away from this price to its main resistance.....

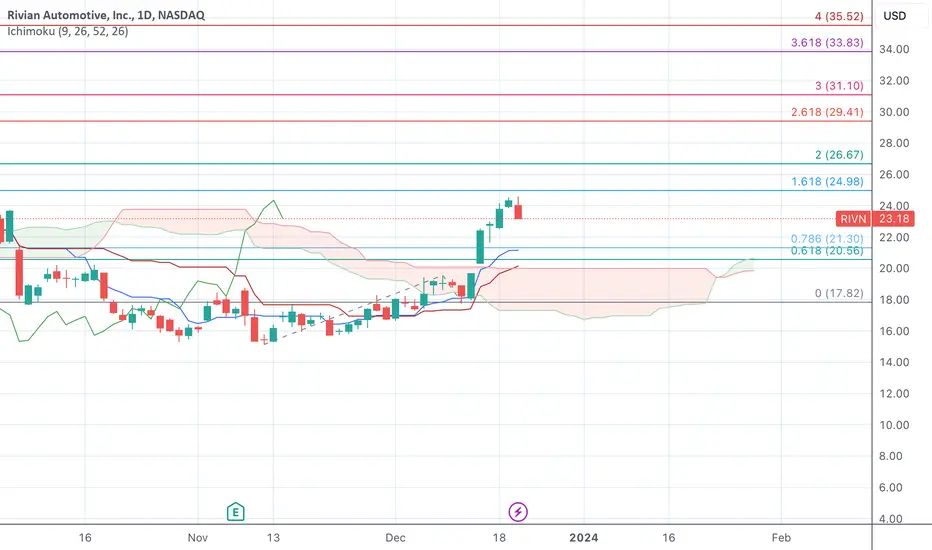
Validating $RIVN Ichimoku and Fibonacci - Trend AffirmedI want to validate RIVN on Ichimoku and Fibonacci.
The trend seems to be intact and not broken as it h as a big support at 20 as shown below. If it breaches the 26.8 resistance which is the Fib Resistance, it has to just fly from there.
Will watch closely and please provide the feedback
IchimokuLong position. TP 100% fib ext.
After braking the 0.786 level the next one is the 1. We are in an uptrend and making new ATH

ICPUSDTHello dear friends
This is one of the currencies that I think is attractive for buying from these areas, especially the pink range ($3.417).
As soon as the $11.65 area is fully consumed, the probability of seeing higher areas in the medium term will be strengthened.
Of course, the view of the increasing trend is valid on the condition that the resistance range of $6.53 is consumed and the price floor is maintained.

How does FTM behaving?Clearly it has bullish position after breaking resistances and now crossing over ichimoku cloud...
Be rich with FTM...

Shiba-USD Bullish ichimokuShibainu appears bullish on the Ichimoku chart, signaling a potential upward trend.

December E-Mini Russell 2000 Index Futures Weekly Chart: 12/7/23Last week we saw the December E-mini Russell 2000 Index futures continues its bullish run with its third consecutive green candle closing into the Ichimoku cloud and above its 52-week moving average. With this move up, the MACD showed a bullish cross indication by crossing its signal line. RSI is trending up along with price. A continuation of this uptrend might find resistance at the top of the Ichimoku cloud (~1,906) and at the 200-week moving average (~1,930). A reversal to the downside might find support at the recent lows at the end of October (~1,640).
Please Note:
Commentary and charts reflect data at the original time of analysis (12/01/23). Market conditions are subject to change and may not reflect all market activity.

BTCUSD appears to have more upside potentialPotential signals to watch out for.
Upside:
Most candlesticks that broke above the cloud have higher highs and higher lows
Tenkan-sen and Kijun-sen crosses upwards
Chikou-span i.e. the lagging line is about to cross above the cloud
No weekly bearish bars above the cloud
Downside:
Last week's candle is a potential reversal signal, it's also an inside bar, therefore a breakout is required for confirmation
Price is approaching a monthly resistance, be mindful a sharp reversal may occur.
The Lagging line may be rejected by the top of the cloud

Starlinkusdt ,,, technical analyst Starling, after its correction,
this currency was able to get out of the Kumo cloud,
it can be the end of the correction and repeat the previous goals.

Ichimoku Wave, entering Second set of Cycles (Round Two) Each round contains three cycles of waves. We are looking for a correlation between Wave one in Round Two compare with behavior of Wave One in the first cycle of Round One.
Im expect that AUD go lower till the place marked for reveres to bullish or continuation of bearish.

FTMUSDTHello friends
The price chart has reached an important support zone and the price zone of $0.1724 is maintained.
Ichi Moku has issued attractive signals on the daily and 4-hour time frames. To confirm this signal, we need to look for a break of the relatively long-term downtrend line.
👉 If the downward trend line is broken and the range of $0.1724 is maintained, we expect the formation of an upward trend up to the price range of $0.4846.
what do you think?

Road to 300!!!!There is not need to draw several lines and works with many indicators.
Basics of ichi says when your price breaks the thick red cloud we must expect rise in price.in this case the cloud broke and pull back to cloud completed.
It occurred in weekly chart so it have more validity.
Chance of rise in price is way more than fall!!
