US30: Strong Growth Ahead! Long!
My dear friends,
Today we will analyse US30 together☺️
The recent price action suggests a shift in mid-term momentum. A break above the current local range around 46,027.62 will confirm the new direction upwards with the target being the next key level of 46,265.81 and a reconvened placement of a stop-loss beyond the range.
❤️Sending you lots of Love and Hugs❤️
Ict

GOLD: Will Go Down! Short!
My dear friends,
Today we will analyse GOLD together☺️
The in-trend continuation seems likely as the current long-term trend appears to be strong, and price is holding below a key level of 4,197.43 So a bearish continuation seems plausible, targeting the next low. We should enter on confirmation, and place a stop-loss beyond the recent swing level.
❤️Sending you lots of Love and Hugs❤️

SILVER: The Market Is Looking Up! Long!
My dear friends,
Today we will analyse SILVER together☺️
The market is at an inflection zone and price has now reached an area around 51.058 where previous reversals or breakouts have occurred.And a price reaction that we are seeing on multiple timeframes here could signal the next move up so we can enter on confirmation, and target the next key level of 51.944.Stop-loss is recommended beyond the inflection zone.
❤️Sending you lots of Love and Hugs❤️

EURUSD: Strong Bearish Sentiment! Short!
My dear friends,
Today we will analyse EURUSD together☺️
The price is near a wide key level
and the pair is approaching a significant decision level of 1.16744 Therefore, a strong bearish reaction here could determine the next move down.We will watch for a confirmation candle, and then target the next key level of 116601.Recommend Stop-loss is beyond the current level.
❤️Sending you lots of Love and Hugs❤️

The EURUSD will start to fallWe may see the beginning of a decline in the EURUSD when it touches the order block at 1.17186 levels, and if the 15-minute candle closes within the order block range, it will be a good opportunity to sell

DXY: Bears Are Winning! Short!
My dear friends,
Today we will analyse DXY together☺️
The recent price action suggests a shift in mid-term momentum. A break below the current local range around 98.135 will confirm the new direction downwards with the target being the next key level of 98.012 and a reconvened placement of a stop-loss beyond the range.
❤️Sending you lots of Love and Hugs❤️

EURUSD: Target Is Up! Long!
My dear friends,
Today we will analyse EURUSD together☺️
The in-trend continuation seems likely as the current long-term trend appears to be strong, and price is holding above a key level of 1.16705 So a bullish continuation seems plausible, targeting the next high. We should enter on confirmation, and place a stop-loss beyond the recent swing level.
❤️Sending you lots of Love and Hugs❤️

GOLD: Local Bullish Bias! Long!
My dear friends,
Today we will analyse GOLD together☺️
The market is at an inflection zone and price has now reached an area around 4,260.94 where previous reversals or breakouts have occurred.And a price reaction that we are seeing on multiple timeframes here could signal the next move up so we can enter on confirmation, and target the next key level of 4,285.09.Stop-loss is recommended beyond the inflection zone.
❤️Sending you lots of Love and Hugs❤️

SILVER: Absolute Price Collapse Ahead! Short!
My dear friends,
Today we will analyse SILVER together☺️
The price is near a wide key level
and the pair is approaching a significant decision level of 53.253 Therefore, a strong bearish reaction here could determine the next move down.We will watch for a confirmation candle, and then target the next key level of 53.090.Recommend Stop-loss is beyond the current level.
❤️Sending you lots of Love and Hugs❤️

Bitcoin - Is the top already in?Introduction
This chart analyzes Bitcoin’s cyclical timing. The focus is on time, not price. It examines the number of days between structural moments such as cycle tops, cycle bottoms, and halvings. By comparing these intervals, we can understand rhythm and consistency. This helps determine whether the current cycle top may have already formed in early October.
Cycle Top to Cycle Bottom
The period from cycle top to cycle bottom represents the bear phase after a market peak. In the previous two cycles, this phase lasted about 365 days each. This pattern suggests that the market typically needs a year to recover. After that, a new accumulation phase usually begins. If the pattern holds, it provides a fairly predictable window for correction. It marks the transition from euphoria to rebuilding.
Cycle Bottom to Cycle Top
The phase from cycle bottom to cycle top defines the bull run itself. In the last two cycles, this period lasted 1,065 and 1,066 days. That is just under three years. During this time, Bitcoin rose from deep accumulation to a new all-time high. Based on current data, 1,065 days points to early October. In that month, a new ATH was reached. This makes the current phase consistent with past cycles. It supports the idea that the top may already be in.
Cycle Top to Cycle Top
The full duration from peak to peak measured 1,461 and 1,431 days in previous cycles. This shows a clear recurring rhythm. The market moves in fairly consistent four-year patterns. Comparing this with the current cycle shows a slight extension. If the peak occurred in early October, this cycle is longer than the last. That may suggest a more mature market. Growth is slower but structurally stronger.
Halving to Cycle Top
The time between a halving and the next cycle top is key. Halvings affect both supply and market sentiment. In past cycles, this interval was 518 and 548 days. We are now exactly at day 548 since the last halving. This aligns perfectly with historical timing. It supports the idea that the top was reached in early October. The moment fits the halving-to-top rhythm observed in earlier cycles.
Conclusion
Based on this timing analysis, it is very likely that the cycle top formed in early October. The bottom-to-top duration of 1,065 days and the halving-to-top of 548 days confirm this. Both match previous patterns. The current cycle is slightly longer than earlier ones, suggesting a slower rhythm. If Bitcoin sets a new ATH later, it would mark an extended cycle.
Timing alone does not guarantee future price direction. Macro factors, policy shifts, and liquidity events can all change the rhythm. Use timing cycles as context, not as prediction. Combine them with price structure and on-chain signals. Maintain active risk management, since longer cycles often bring higher volatility and larger deviations from historical averages.

XAU/USD Update 1Next move on the way, focus on proper risk management & stay discipline. Wishing you successful trades..!
Key Reason:
1. Fresh B.block along with orderflow.
2. BISI still in pending.
3. Structure was bullish.
This is not a financial advice. Confirmation is very important. Let's see how it will work.

EURUSD 4 Hour analysis - Sell opportunityThere is a selling opportunity on the EURUSD in the long term (4Hour chart) as the price may fall from the 1.16950 level because it left behind a liquidity void that will attract the price to fall in addition to the EQL at the bottom, which makes the possibility of breaking this level very likely.

EURO/USD still weakIn our last analysis here:
I broke down the EU shorts, I'm back again and I am still bearish until the key level is hit.
Nothing much to say. I'll just be talking too much boring you
the chart has all the words i want to say.

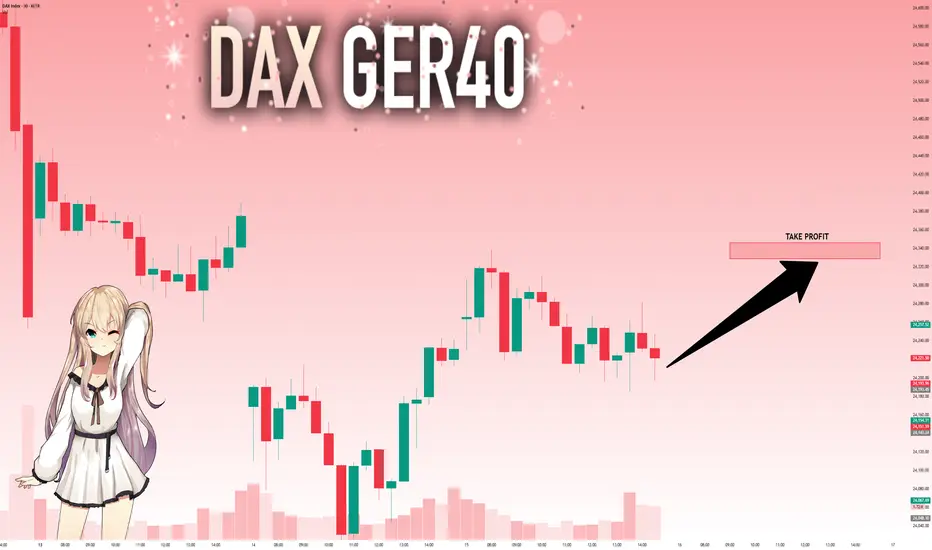
DAX: Will Go Up! Long!
My dear friends,
Today we will analyse DAX together☺️
The recent price action suggests a shift in mid-term momentum. A break above the current local range around 24,193.45 will confirm the new direction upwards with the target being the next key level of 24,328.,98 and a reconvened placement of a stop-loss beyond the range.
❤️Sending you lots of Love and Hugs❤️
EURUSD: The Market Is Looking Down! Short!
My dear friends,
Today we will analyse EURUSD together☺️
The in-trend continuation seems likely as the current long-term trend appears to be strong, and price is holding below a key level of 1.16224 So a bearish continuation seems plausible, targeting the next low. We should enter on confirmation, and place a stop-loss beyond the recent swing level.
❤️Sending you lots of Love and Hugs❤️

SILVER: Strong Bullish Sentiment! Long!
My dear friends,
Today we will analyse SILVER together☺️
The market is at an inflection zone and price has now reached an area around 52.802 where previous reversals or breakouts have occurred.And a price reaction that we are seeing on multiple timeframes here could signal the next move up so we can enter on confirmation, and target the next key level of 53.558.Stop-loss is recommended beyond the inflection zone.
❤️Sending you lots of Love and Hugs❤️

GOLD: Bears Are Winning! Short!
My dear friends,
Today we will analyse GOLD together☺️
The price is near a wide key level
and the pair is approaching a significant decision level of 4,204.23 Therefore, a strong bearish reaction here could determine the next move down.We will watch for a confirmation candle, and then target the next key level of 4,182.91.Recommend Stop-loss is beyond the current level.
❤️Sending you lots of Love and Hugs❤️

AMD short term bullish. Price is expected to have sought its SSL and Receiving nice reaction from Previous Bull POI which was that Bullish Breaker and thus Seeking new Price discovery for short term.
Thus it is very good chance that Price will visit that Bearish Breaker first in next few weeks.
DYOR. This isn't a financial advice. This is just educational and speculative idea.
Your gains or losses are your own responsbility.
If you like this idea, please give it a thumbs up.

All Time High in the crosshair...again1. Weekly Lows hit;
2. Repricing below Weekly Open and Monthly Open;
3. Large Displacement on the upside confirming reversal;
4. Monday's high, Daily FVG and ultimately ATH relative equal highs in the crosshair for the upcoming days/weeks (that is bullish bias until proven otherwise);

XAU/USD Update 1Next move on the way. Focus on proper risk management & stay discipline. Wishing you successful trades..!
Key Reason:
1. Fresh BPR still in pending.
2. Unmitigated supply area.
3. Overall structure was bullish. But we can expect 150 - 200 pips retracement trade from this zone with confirmation.
This is not a financial advice. Let's see how it will work.

EURJPY WILL GROW|LONG|
✅EURJPY retraced perfectly into the demand level after clearing liquidity below previous lows. Price shows bullish intent, with upside imbalance toward 177.00 likely to be filled. Time Frame 4H.
LONG🚀
✅Like and subscribe to never miss a new idea!✅

EURAUD BEARISH BIAS|SHORT|
✅EURAUD retraced into a clear supply level after a sharp displacement move. ICT traders anticipate distribution, targeting inefficiency around 1.7830 as price seeks sell-side liquidity. Time Frame 3H.
SHORT🔥
✅Like and subscribe to never miss a new idea!✅

US30: Next Move Is Down! Short!
My dear friends,
Today we will analyse US30 together☺️
The recent price action suggests a shift in mid-term momentum. A break below the current local range around 46,422.01 will confirm the new direction downwards with the target being the next key level of 46,148.32 and a reconvened placement of a stop-loss beyond the range.
❤️Sending you lots of Love and Hugs❤️
