USDJPY FREE SIGNAL FOR MONDAY|SHORT|
✅USDJPY Price forms a double-top and breaks neckline, signaling bearish order flow. ICT framework suggests liquidity draw into the 149.00 demand area.
—————————
Entry: 149.60
Stop Loss: 150.05
Take Profit: 149.00
Time Frame: 3H
—————————
SHORT🔥
✅Like and subscribe to never miss a new idea!✅
Ict

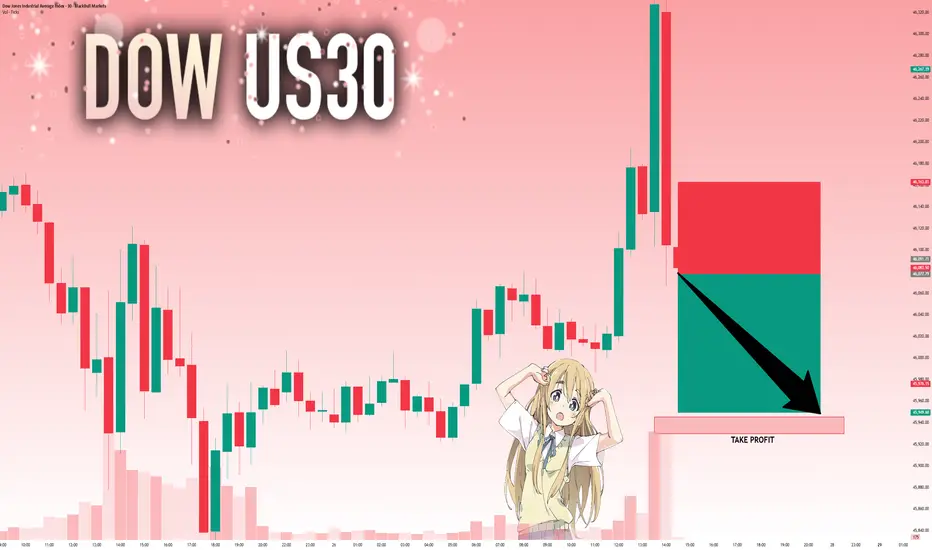
US30: Target Is Down! Short!
My dear friends,
Today we will analyse US30 together☺️
The recent price action suggests a shift in mid-term momentum. A break below the current local range around 46,077.79 will confirm the new direction downwards with the target being the next key level of 45,945.23 and a reconvened placement of a stop-loss beyond the range.
❤️Sending you lots of Love and Hugs❤️
GOLD: Move Down Expected! Short!
My dear friends,
Today we will analyse GOLD together☺️
The in-trend continuation seems likely as the current long-term trend appears to be strong, and price is holding below a key level of 3,755.40 So a bearish continuation seems plausible, targeting the next low. We should enter on confirmation, and place a stop-loss beyond the recent swing level.
❤️Sending you lots of Love and Hugs❤️

EURUSD: Strong Growth Ahead! Long!
My dear friends,
Today we will analyse EURUSD together☺️
The market is at an inflection zone and price has now reached an area around 1.16802 where previous reversals or breakouts have occurred.And a price reaction that we are seeing on multiple timeframes here could signal the next move up so we can enter on confirmation, and target the next key level of 1.16999.Stop-loss is recommended beyond the inflection zone.
❤️Sending you lots of Love and Hugs❤️

SILVER: Will Go Up! Long!
My dear friends,
Today we will analyse SILVER together☺️
The price is near a wide key level
and the pair is approaching a significant decision level of 45.405 Therefore, a strong bullish reaction here could determine the next move up.We will watch for a confirmation candle, and then target the next key level of 45.807.Recommend Stop-loss is beyond the current level.
❤️Sending you lots of Love and Hugs❤️

XAUUSD || GOLD ANALYSIS BASED ON SMART MONEY ORDERS (REAL TIME )🤖 GOLD ANALYSIS What’s Moving the Market Today? (September 26, 2025)
🚀 Welcome to Trade with DECRYPTERS
We break the charts down into clean levels so you can spot where smart money is buying 🟢 and selling 🔴.
Keep it simple, stick to the plan, and let the levels guide your moves.
🟡 Gold Slips to $3,747 — Dollar’s Flexing Its Muscles!
A stronger US dollar and mixed economic signals are pushing gold prices down.
When the dollar gains, gold gets less attractive as it’s priced in dollars.
Investors are watching closely!
🏦 Fed Says “No Rush” on Rate Cuts — Gold Feels the Heat!
Strong US jobs data makes the Fed cautious about cutting rates soon.
Lower rates usually boost gold, so this hesitation is bad news for prices.
🌍 Middle East Tensions Flare — Gold’s Safe-Haven Glow Shines!
Rising conflicts and US-China trade worries make investors nervous, driving them to gold.
As a safe-haven asset, gold prices get a lift when global risks spike.
📊 Jobs Report Looms — Will Gold Get a Break?
Next week’s US jobs data could shake things up.
If the report shows weakness, it might spark hopes for rate cuts, pushing gold prices higher.
🚀 US Economy Roars at 2.8% — Gold’s Not Impressed!
Solid US GDP growth eases recession fears, making gold less appealing.
Strong economies often reduce demand for safe-haven assets like gold.
⚡ Trump’s Tariff Threats Stir Chaos — Gold Loves It!
Talk of new tariffs and global uncertainty keeps gold in demand.
Investors turn to gold as a hedge when trade wars heat up.
🏛️ Central Banks Hoard 900 Tonnes — Gold’s Got Backup!
Central banks are buying tons of gold to diversify reserves.
This steady demand supports higher gold prices over time.
⚡⚡So what we are Expecting .. ? ⚡⚡ Current Price around 3744.
🟢 Buy Zone (3717–3698)
Buyers waiting to load up.
3705 is the key bounce point 🔑.
🔴 Sell Zone (3777–3790)
Sellers may step in hard here.
Watch for a sharp push ⚡ into this zone before any drop.
📊 Todays possible Daily Range:-
High of the day: 3792 ⬆️
Low of the day: 3703 ⬇️
CONCLUSION :-
With today’s range between 3703–3792, price action near 3744 sits right in the middle.
Key levels: Buy Zone 3717–3698 (bounce at 3705) and Sell Zone 3777–3790.
Bias is slightly bullish 🟢, but confirmation will come only from reactions at these zones.

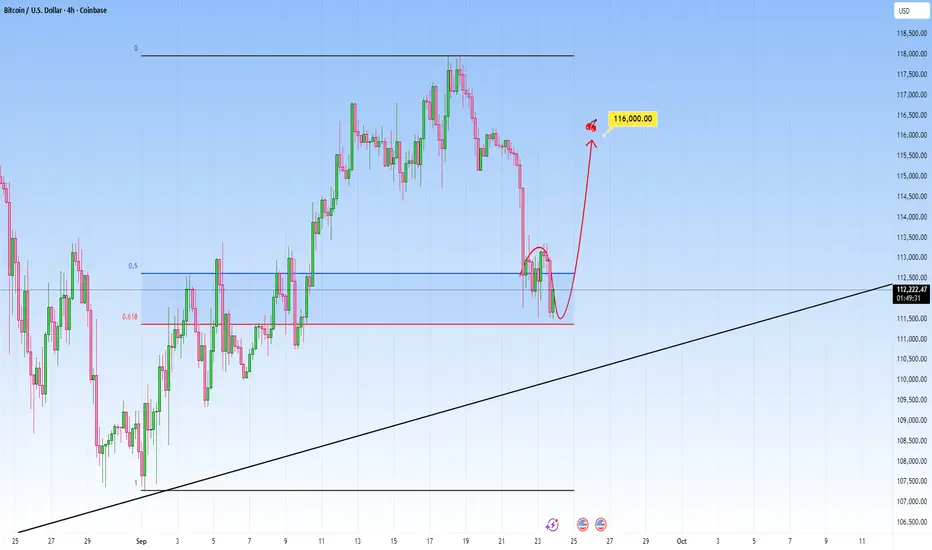
Bitcoin Analysis: Key Level to WatchPrice sold off aggressively, and now it sits within a key reaction area.
We can see price just tapped into the 0.5 and 0.618 Fibonacci retracement level of the last leg up. This is the golden pocket, a place where markets tend to react often.
Now look closely: price is showing early signs of rejection here, with wicks forming and momentum slowing down. If buyers step in here, and hold this zone that is our signals, targeting around the previous high.
But if price breaks clean below it, that invalidates the bullish idea and we could see some more continuation lower.
EURUSD - Bears are taking control!Introduction
This chart analysis of EUR/USD highlights key price action concepts such as liquidity grabs, fair value gaps, and inversions on the four-hour timeframe. By examining how the market has been moving recently, we can better understand where price may head next and how institutional activity could be shaping upcoming moves. The following sections break down the liquidity sweeps, the bearish and bullish setups, and the potential implications for future price direction.
Liquidity grab at the upside
The recent price movement shows a clear liquidity grab to the upside, where price aggressively pushed higher to take out resting buy stops above previous highs. This kind of move is typical of market makers and institutions seeking liquidity before reversing the price. Once those stops are cleared, the market often lacks the momentum to sustain higher levels, which can be a precursor to a reversal or deeper retracement.
Liquidity grab at the downside
After the upward liquidity sweep, the market also executed a downside liquidity grab. Price dipped lower to target sell-side liquidity, running stops beneath previous lows before showing signs of reacting. These moves are designed to trap both breakout traders and late sellers, creating the liquidity necessary for the next larger move. This back-and-forth price action emphasizes how the market often seeks liquidity in both directions before deciding on a sustained trend.
4h bearish FVG
A four-hour bearish Fair Value Gap (FVG) has formed, which acts as a strong area of imbalance where price is likely to return. This zone provides a potential entry point for institutional traders looking to short, as it represents inefficiency in the market that has yet to be filled. As long as price respects this area and reacts bearishly upon re-entry, it strengthens the case for continuation to the downside.
4h bullish inversion
At the same time, there is a four-hour bullish inversion level, where previous resistance has flipped into potential support. This area can act as a temporary base for price to consolidate or retrace before resuming its bearish trajectory. If the inversion holds, we might see short-term bullish reactions, but the broader market structure still favors sellers as long as the bearish FVG remains intact.
Final thoughts
Overall, the current EUR/USD setup suggests that the market is in the process of engineering liquidity on both sides before deciding its next major move. The upside and downside liquidity grabs confirm the presence of institutional activity, while the bearish FVG highlights a potential point of interest for further selling. The bullish inversion may offer temporary support, but the broader bias remains bearish until proven otherwise. Traders should watch how price reacts to the highlighted zones, as these areas are likely to provide the clearest signals for the next significant move.
-------------------------
Thanks for your support. If you enjoyed this analysis, make sure to follow me so you don't miss the next one. And if you found it helpful, feel free to drop a like 👍 and leave a comment 💬, I’d love to hear your thoughts!

DAX: Move Up Expected! Long!
My dear friends,
Today we will analyse DAX together☺️
The recent price action suggests a shift in mid-term momentum. A break above the current local range around 23,517.46 will confirm the new direction upwards with the target being the next key level of 23,580.90 and a reconvened placement of a stop-loss beyond the range.
❤️Sending you lots of Love and Hugs❤️

GOLD: Local Bullish Bias! Long!
My dear friends,
Today we will analyse GOLD together☺️
The in-trend continuation seems likely as the current long-term trend appears to be strong, and price is holding above a key level of 3,731.85 So a bullish continuation seems plausible, targeting the next high. We should enter on confirmation, and place a stop-loss beyond the recent swing level.
❤️Sending you lots of Love and Hugs❤️

SILVER: Absolute Price Collapse Ahead! Short!
My dear friends,
Today we will analyse SILVER together☺️
The market is at an inflection zone and price has now reached an area around 44.284 where previous reversals or breakouts have occurred.And a price reaction that we are seeing on multiple timeframes here could signal the next move down so we can enter on confirmation, and target the next key level of 44.004.Stop-loss is recommended beyond the inflection zone.
❤️Sending you lots of Love and Hugs❤️

EURUSD: Will Go Down! Short!
My dear friends,
Today we will analyse EURUSD together☺️
The price is near a wide key level
and the pair is approaching a significant decision level of 1.17013 Therefore, a strong bearish reaction here could determine the next move down.We will watch for a confirmation candle, and then target the next key level of 1.16688.Recommend Stop-loss is beyond the current level.
❤️Sending you lots of Love and Hugs❤️

EURUSD Quick tradeThere is a good SMT signal on the EURUSD, which the price may react to in order to fill the Liquidity void that occurred yesterday and then continue the decline to target more liquidity areas.

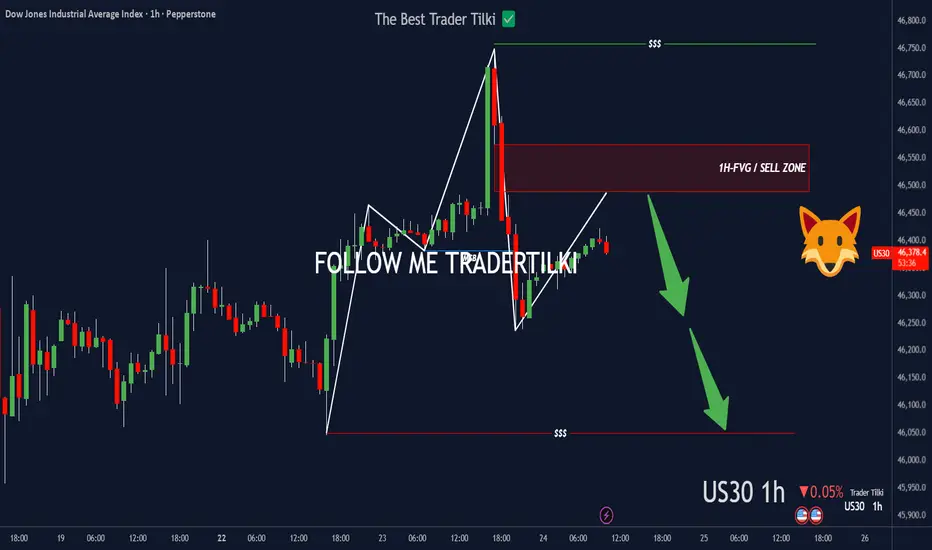
US30 left a footprint—FVG’s callin’.Hey Guys,
Once US30 hits my SELL zone, I’m pulling the trigger—targeting 46049.0
• Entry: 46574.5.0 or 46488.9
Set the stop point according to your own margin, my friends.
Every like you drop pushes me to share more setups like this. Big thanks to everyone showing support!
$BTC beautiful range to play i will looking for short!lower time frame rejection call lead us for more downside ! keep eye on it..

DXY: The Market Is Looking Down! Short!
My dear friends,
Today we will analyse DXY together☺️
The recent price action suggests a shift in mid-term momentum. A break below the current local range around 97.434 will confirm the new direction downwards with the target being the next key level of 97.299 and a reconvened placement of a stop-loss beyond the range.
❤️Sending you lots of Love and Hugs❤️

GOLD: Strong Bearish Sentiment! Short!
My dear friends,
Today we will analyse GOLD together☺️
The in-trend continuation seems likely as the current long-term trend appears to be strong, and price is holding below a key level of 3,770.99 So a bearish continuation seems plausible, targeting the next low. We should enter on confirmation, and place a stop-loss beyond the recent swing level.
❤️Sending you lots of Love and Hugs❤️

EURUSD: Bulls Are Winning! Long!
My dear friends,
Today we will analyse EURUSD together☺️
The market is at an inflection zone and price has now reached an area around 1.17420 where previous reversals or breakouts have occurred.And a price reaction that we are seeing on multiple timeframes here could signal the next move up so we can enter on confirmation, and target the next key level of 1.17568.Stop-loss is recommended beyond the inflection zone.
❤️Sending you lots of Love and Hugs❤️

SILVER: Next Move Is Down! Short!
My dear friends,
Today we will analyse SILVER together☺️
The price is near a wide key level
and the pair is approaching a significant decision level of 44.061 Therefore, a strong bearish reaction here could determine the next move down.We will watch for a confirmation candle, and then target the next key level of 44.239.Recommend Stop-loss is beyond the current level.
❤️Sending you lots of Love and Hugs❤️

ETH and BTC seeking further lows?Everything explained in video, please let me know if I missed anything or any other thoughts 🙏🏾

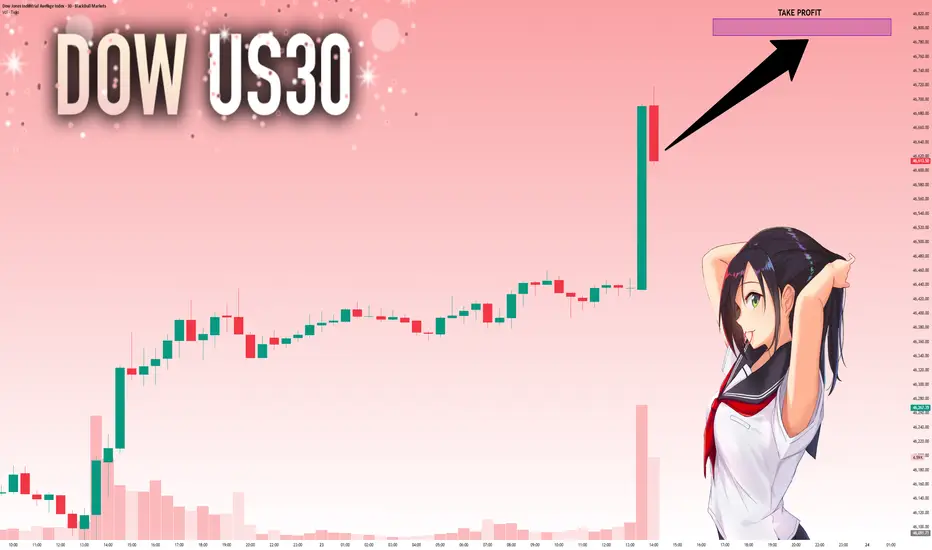
US30: Target Is Up! Long!
My dear friends,
Today we will analyse US30 together☺️
The recent price action suggests a shift in mid-term momentum. A break above the current local range around 46,620.50 will confirm the new direction upwards with the target being the next key level of 46,789.61 and a reconvened placement of a stop-loss beyond the range.
❤️Sending you lots of Love and Hugs❤️
GOLD: Strong Growth Ahead! Long!
My dear friends,
Today we will analyse GOLD together☺️
The in-trend continuation seems likely as the current long-term trend appears to be strong, and price is holding above a key level of 3,783.21 So a bullish continuation seems plausible, targeting the next high. We should enter on confirmation, and place a stop-loss beyond the recent swing level.
❤️Sending you lots of Love and Hugs❤️

EURUSD: Will Go Down! Short!
My dear friends,
Today we will analyse EURUSD together☺️
The market is at an inflection zone and price has now reached an area around 1.17880 where previous reversals or breakouts have occurred.And a price reaction that we are seeing on multiple timeframes here could signal the next move down so we can enter on confirmation, and target the next key level of 1.17740.Stop-loss is recommended beyond the inflection zone.
❤️Sending you lots of Love and Hugs❤️
