GOLD IS OVERBOUGHT|SHORT|
✅XAUUSD After sweeping liquidity above the supply zone, price is about to retest the rejection point in a premium area. A draw on liquidity toward the next inefficiency is favored as the market seeks a balanced repricing leg. Time Frame: 3H.
SHORT🔥
✅Like and subscribe to never miss a new idea!✅
Ict

CHFJPY FREE SIGNAL|SHORT|
b]✅CHFJPY taps the H2 supply array and shows displacement as bearish orderflow confirms a potential reversal cascade. A corrective pullback into the imbalance is likely before delivering downside toward the target zone.
—————————
Entry: 194.40
Stop Loss: 194.63
Take Profit: 194.15
Time Frame: 2H
—————————
SHORT🔥
✅Like and subscribe to never miss a new idea!✅

EUR/GBP: Smart Money Unwinding Begins — The Pullback Trap1. Price Action (Daily Chart)
At the moment, EUR/GBP is moving through a bearish correction within a broader medium-term bullish structure. Price has cleanly rejected the 0.8800–0.8850 supply zone, which aligns with the upper boundary of the ascending channel.
The breakdown of the inner trendline and the daily close below the channel’s midline signal that momentum has shifted to sellers.
RSI is deeply oversold, so I expect a technical rebound before any continuation of the sell-off. The first level I’m watching for a retest is 0.8780–0.8800, a former support → now resistance.
As long as we remain below that zone, I maintain a short bias, targeting the 0.8680–0.8650 confluence, where the channel support, daily demand, and previous structural levels align.
A sustained reclaim above 0.8810–0.8830 would invalidate this scenario.
2. Sentiment (Retail Positioning)
Sentiment data shows 74% retail short and only 26% long.
As a contrarian trader, this makes me cautious about selling lows: the crowd is already on the move, usually late. This doesn’t invalidate the downside bias, but it reinforces the idea of waiting for a proper pullback before considering new short entries.
3. COT (Commitment of Traders)
The COT report sends a clear message: we may be entering a distribution phase on the cross.
On the EUR side, Non-Commercials remain strongly net-long (243k vs 135k) but are reducing long exposure.
On the GBP side, Non-Commercials remain net-short (79k vs 91k) and are aggressively cutting long positions.
This tells me the market had been positioned long EUR / short GBP, and is now unwinding that consensus — a classic signature of a correction after a mature bullish trend.
Commercials, as often seen at potential turning points, are doing the opposite: accumulating GBP and distributing EUR, suggesting that current EUR/GBP levels are no longer attractive from a hedging/fundamental standpoint.
4. Seasonality
November seasonality is historically moderately bearish for EUR/GBP across the 10-, 15- and 20-year studies.
December, on the other hand, shows a much stronger positive seasonal tendency.
For me, this creates a clear narrative:
• expected weakness into late November,
• potential accumulation zone in early December,
• likely seasonal recovery in the second half of the month.

EURUSD Approaching a Key Buy ZoneQuick Summary
EURUSD is approaching a potential buy zone near 1.15370 where the pair is expected to take liquidity below the low at 1.15474 before showing a bullish reaction The likely target after the rebound is the break of the descending trendline on the H4 timeframe with the demand zone aligning with the 61 Fibonacci level
Full Analysis
The pair is gradually moving toward an important area around 1.15370 This zone represents a potential point where strong buying pressure may appear The current movement seems focused on collecting liquidity below the low at 1.15474 and once this liquidity is taken the probability of a bullish reaction becomes higher
If the price reacts from this level the next objective will be a move toward breaking the descending trendline on the H4 timeframe This scenario aligns with a previously formed demand zone and converges with the 61 Fibonacci level which adds more strength to the bullish continuation outlook
The main focus now is to wait for a clear reaction from the 1.15370 zone Whether it appears as a strong bounce or a shift in control toward buyers this area is likely to play a key role in guiding the next move of the pair

#CHFJPY , Lets give her a chance !!📌 Market Insight: {#CHFJPY }
⚠️ Risk Assessment: {High}
🚀 Approach:
Not a fan of these kinda pair ... but lets see
with a nice momentum structure we can take it as a QuickScalp .
#Ash_TheTrader #Forex #GBPJPY #MarketAnalysis #TradingSetup #RiskManagement #GOLD #Scalper #NQ #EURUSD

GOLD FREE SIGNAL|LONG|
✅XAUUSD bullish displacement out of the consolidation shows price drawing toward buy-side liquidity after mitigating the prior sell-side sweep. Upside imbalance remains unfilled, pulling price toward the next target zone.
—————————
Entry: 4166$
Stop Loss: 4135$
Take Profit: 4204$
Time Frame: 4H
—————————
LONG🚀
✅Like and subscribe to never miss a new idea!✅

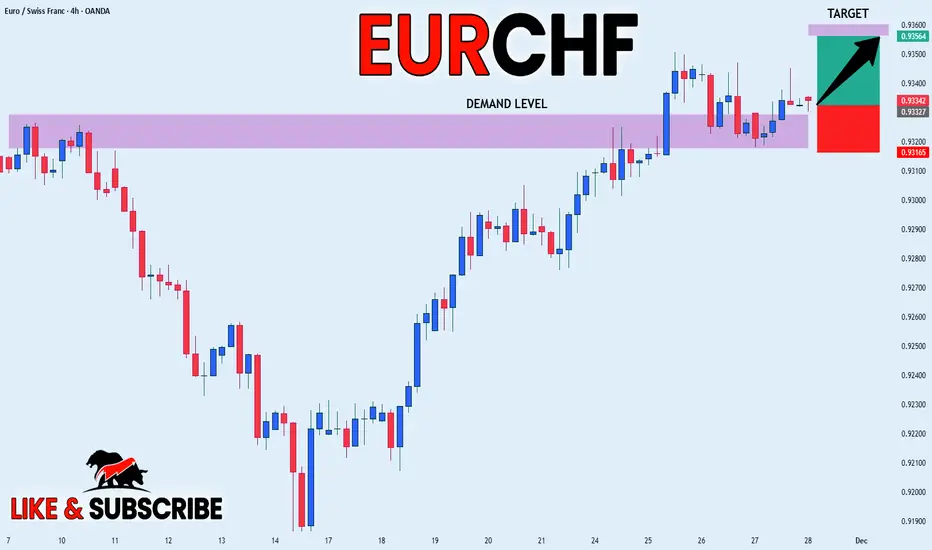
EURCHF FREE SIGNAL|LONG|
✅EURCHF is reacting from the higher-timeframe demand block after clearing sell-side liquidity and showing bullish displacement. With inefficiency above acting as a magnet, price may draw toward the next buy-side target.
—————————
Entry: 0.9332
Stop Loss: 0.9316
Take Profit: 0.9356
Time Frame: 4H
—————————
LONG🚀
✅Like and subscribe to never miss a new idea!✅
CISD as an Entry mechanism. How I pair my entry with CISDFPMARKETS:GBPUSD
An example to show you the entry mechanism of CISD

Bitcoin - Can the bulls break resistance?Bitcoin continues to stagnate after a strong sell-off. Market structure remains weak, and trading volume is declining as price keeps moving sideways within a tight range. Traders are uncertain about the next move, and both bulls and bears currently lack conviction. Overall sentiment is cool, with most attention focused on nearby resistance zones. Many eyes are on how BTC reacts to the current consolidation area.
4H Bearish FVG
Just above the current price lies a clear bearish 4-hour Fair Value Gap (FVG). This zone now acts as strong resistance. When BTC retests this area, a rejection is the most likely scenario. Only a breakout with strong volume would give bulls something to lean on. As long as this FVG holds, further downside remains the path of least resistance.
1H Timeframe
The 1-hour timeframe shows ongoing consolidation and repeated struggles with the local 1H bearish FVG. Every attempt to break through this area is immediately rejected. As a result, the probability of BTC breaking to the downside increases, which would allow the market to collect the liquidity resting below. Bears are expected to keep defending this zone until the market breaks through with conviction. Consolidation may continue as long as the support level holds, but the underlying downside risk remains significant.
Conclusion
BTC remains technically pressured as long as there is no convincing breakout above the 4H FVG. The current range is vulnerable to a downward break, especially with weak volume and persistent resistance structures. Traders would be wise to wait for clearer signals or a new trend on higher timeframes before committing to a direction.

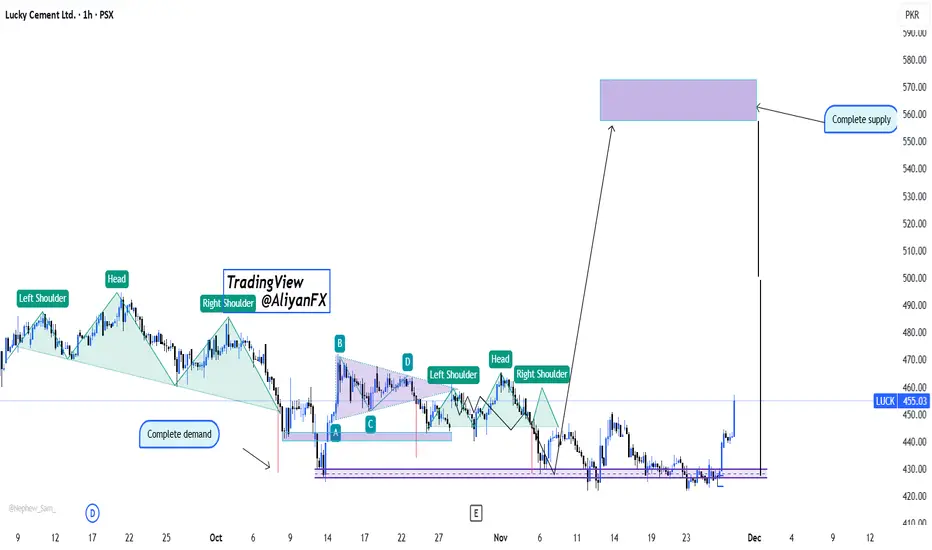
LUCK – Demand Completed|Reversal Patterns Targeting Supply ZoneLucky Cement (PSX: LUCK) has completed a series of bullish reversal structures after tapping into a major completed demand zone. Price has reacted strongly, confirming the possibility of a medium-term bullish leg toward the 560–575 PKR supply zone.
🔍 Key Technical Highlights:
🟢 Completed Demand Zone triggered a clean bullish reaction.
🧩 Multiple Inverse Head & Shoulders patterns forming across different price swings.
📉 Previous bearish leg has fully balanced its inefficiencies, enabling bullish continuation.
🟣 Major supply zone sits at 560–575, expected to be the next target for Smart Money.
⚡ Current momentum indicates strong institutional activity from discount pricing.
📈 Outlook:
If price holds above the 430–440 area, LUCK has high probability to continue upward with clean structure until the complete supply zone. Break of minor resistance levels will add confirmation for position traders.
USDCAD BEARISH BREAKOUT|SHORT|
✅USDCAD broke below the supply zone with clean displacement, leaving a fresh imbalance that may act as a breaker on any pullback. Expect price to draw toward sell-side liquidity resting near the lower target area. Time Frame 3H.
SHORT🔥
✅Like and subscribe to never miss a new idea!✅

EURUSD Sell after bullish retracementplanning to sell EURUSD after retrace the 1.15900 level this will be weak area because there are liquidity above but i will sell if i see a clear rejection from this zone + inducement
these 2 other zones are likely the price to rebound from them (the extreme is high probability)

EURAUD LOCAL LONG|
✅EURAUD has tapped the higher-timeframe demand after clearing sell-side liquidity, signaling a potential bullish reversal. If displacement confirms, algos may drive price toward the next buy-side liquidity target above. Time Frame 3H.
LONG🚀
✅Like and subscribe to never miss a new idea!✅

EURUSD Sell zonewill sell EURUSD if the 15min closed with Rejection inside or outside the orderblock
thats will be good confirmation to sell after tokyo break

ANDNZD WILL FALL|SHORT|
✅AUDNZD has broken down from the higher-timeframe supply with strong displacement, confirming bearish order-flow. A shallow corrective retrace may form before algos drive price toward the next sell-side liquidity target below. Time Frame 3H.
SHORT🔥
✅Like and subscribe to never miss a new idea!✅

EURUSD — Sell Setup After Sweep at 1.15882Quick Summary
EURUSD is forming a bearish opportunity around 1.15882.
The plan: wait for a sweep of the candle at that level, confirm the rejection, and then sell.
A bearish setup is supported by the internal CHoCH on the 15m, and the strong push upward has left behind a liquidity void, which makes it a downside target.
Full Analysis
According to the current price action, EURUSD is setting up for a potential sell from 1.15882. The key condition here is not selling immediately, but waiting for a sweep of the candle at that level. Once the sweep occurs and the market shows a clear rejection, the sell entry becomes valid.
The reasoning behind this setup is aligned with the short-term structure:
On the 15-minute timeframe, the market printed an internal CHoCH, signaling early weakness and a potential shift in intraday direction.
The recent sharp move upward created a noticeable liquidity void. Price often seeks to rebalance these inefficiencies, making that void an attractive downside target once selling pressure begins.

DXY FREE SIGNAL|LONG|
✅DXY has tapped the higher-timeframe demand and formed bullish displacement after clearing sell-side liquidity. A refined entry inside the mitigation zone aligns with algo order-flow targeting the buy-side liquidity above.
———————————
Entry: 99.773
Stop Loss: 99.641
Take Profit: 99.967
Time Frame: 2H
———————————
LONG🚀
✅Like and subscribe to never miss a new idea!✅

EURUSD - Waiting on the direction!Introduction
EURUSD is currently trading in a very technical zone where price is positioned between two significant daily fair value gaps. These opposing imbalances—one bearish and one bullish—are acting as major directional barriers. As long as price remains contained between them, the pair is effectively trapped in a compression phase, awaiting a decisive breakout. The next clear move will likely arise when either the upper or lower FVG gives way, allowing the market to target the liquidity zones that lie beyond these imbalances.
Daily Bearish FVG
Above current price sits the daily bearish fair value gap, which is acting as a strong resistance area. If EURUSD manages to break through this upper FVG with conviction, it would indicate that buyers have reclaimed control. A clean break above this zone would open the path toward the liquidity area located at the top of the chart. This region is where a large cluster of stop orders and resting buy-side liquidity is likely positioned. A move into this area would be a natural target as price seeks to rebalance inefficiencies and tap into the liquidity pool above previous highs.
Daily Bullish FVG
Below the current range lies the daily bullish fair value gap, functioning as a major support zone. If EURUSD breaks below this lower FVG, it would signal a shift in momentum back to the downside. Such a move would send price toward the liquidity zone at the bottom, where sell-side liquidity rests beneath prior lows. This would align with typical market behavior in a bearish continuation—first taking out inefficiencies, then reaching into the liquidity pools that form below structural lows.
Conclusion
EURUSD is currently confined between two major daily FVG levels, creating a tightly compressed structure where the next breakout will dictate direction. Until price decisively breaks either the bearish FVG above or the bullish FVG below, the pair remains in a waiting phase. The eventual breach of one of these imbalances will determine whether EURUSD hunts liquidity at the top or at the bottom, making this a critical moment for directional clarity in the market.

AUDUSD — CLS Daily vs 1H Chart AUDUSD — Daily vs 1H Chart 📈
Price has purged into a key level on both the Weekly and Daily timeframes, then formed a CLS range on the Daily chart.
Once price pulls back into the Daily Gap on the 1H, I’ll look to go long toward the Daily 50% level.
🎯 Target → 0.64695
OANDA:AUDUSD

CADJPY DEMAND LEVEL AHEAD|LONG|
✅CADJPY is pulling into the higher-timeframe demand after clearing sell-side liquidity, setting up a bullish reaction. If displacement confirms, algos may reprice toward the next buy-side liquidity target above. Time Frame 10H.
LONG🚀
✅Like and subscribe to never miss a new idea!✅

Quick buy EURUSDafter breaking Tokyo high and following the buy program for the Higher time frame, im buying EURUSD to target the previous high on the Higher time frame

EURCHF – Outlook for the Coming Month1. Monthly View
On the monthly timeframe, the overall structure is still bearish, but there’s room for a potential bullish shift. The major liquidity resting at the previous lowest point—formed in November 2024—has already been swept. With that liquidity taken, the market now has the space to push higher if buyers step in.
2. Weekly View
Last week’s candle swept liquidity as well, leaving behind a strong rejection wick. That tells us many stop orders below were triggered. This week’s candle is currently trading within the range of last week’s candle, which suggests we could see some sideways movement for a bit. However, since downside liquidity from higher timeframes has already been taken, the market could be setting a liquidity trap before moving upward to hunt the liquidity sitting above.
3. Daily View
Yesterday’s candle showed solid buying pressure, confirming a daily low. I’m looking for a pullback into the discount zone before expecting the next move to the upside. The structure is starting to shift in favor of buyers.
4. 4-Hour View
The market had been in a bearish trend for quite some time, failing to break previous highs. But today, we finally saw a break of structure to the upside, followed by a new lower low—hinting that a more meaningful move may be developing. Still, I expect EURCHF to pull back once more on the 4H to create a trap before continuing upward, and this pullback shouldn’t break the lowest low.
Final Thoughts
EURCHF has already cleared major downside liquidity on the higher timeframes, and that shifts the draw toward the upside. With the monthly low from 2024 swept, last week’s liquidity taken, and the daily low confirmed, the pair is setting the stage for a potential bullish continuation once the market finishes its pullback.
I’m keeping an eye on how price behaves during this expected retracement. As long as the market doesn’t break the recent lowest low, the structure favors a move higher. A clean reaction from the discount zones on the daily or 4H would strengthen the bullish narrative and open the door for the next upward leg.
Overall, EURCHF looks prepared to build momentum—but confirmation will come from how it handles the upcoming pullback. Stay alert to those key zones, because that’s where the next major move will likely begin.
----------------------------------------------------------------------------------------------
Thanks for checking out this analysis! If you enjoyed it, hit that follow button so you don’t miss future updates. And if this breakdown helped you out, drop a like 👍 and share your thoughts in the comments 💬—I always appreciate the feedback!

EUR/USD – Trade UpdateI have entered a long (buy) position on EUR/USD after an Inducement and a confirmed rejection. This setup now shows a strong entry signal, increasing the probability of a successful trade.
