October 05, Forex Outlook: Key Moves to Watch This Week!Welcome back, traders!
In today’s video, we’ll be conducting a Forex Weekly Outlook, analyzing multiple currency pairs from a top-down perspective—starting from the higher timeframes and working our way down to the lower timeframes.
Our focus will be on identifying high-probability price action scenarios using clear market structure, institutional order flow, and key confirmation levels. This detailed breakdown is designed to give you a strategic edge and help you navigate this week’s trading opportunities with confidence.
📊 What to Expect in This Video:
1. Higher timeframe trend analysis
2. Key zones of interest and potential setups
3. High-precision confirmations on lower timeframes
4. Institutional insight into where price is likely to go next
Stay tuned, take notes, and be sure to like, comment, and subscribe so you don’t miss future trading insights!
Have a great week ahead, God bless you!
The Architect 🏛️📉
Ictconcepts

September 28, Forex Outlook: What Can Traders Expect This Week?Welcome back, traders!
In today’s video, we’ll be conducting a Forex Weekly Outlook, analyzing multiple currency pairs from a top-down perspective—starting from the higher timeframes and working our way down to the lower timeframes.
Our focus will be on identifying high-probability price action scenarios using clear market structure, institutional order flow, and key confirmation levels. This detailed breakdown is designed to give you a strategic edge and help you navigate this week’s trading opportunities with confidence.
📊 What to Expect in This Video:
1. Higher timeframe trend analysis
2. Key zones of interest and potential setups
3. High-precision confirmations on lower timeframes
4. Institutional insight into where price is likely to go next
Stay tuned, take notes, and be sure to like, comment, and subscribe so you don’t miss future trading insights!
Have a great week ahead, God bless you!
The Architect 🏛️📉

Using imbalanced candle ranges will change your analysis foreverIn this video you will learn how imbalanced candle ranges affect price. When an imbalanced range prints, mark them out and start observing how they affect price 💎

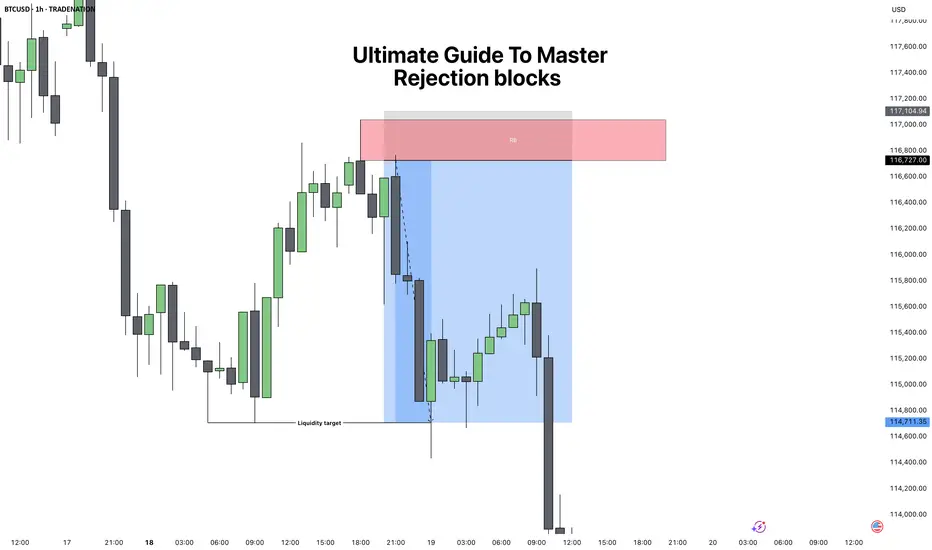
Ultimate Guide to Master: Rejection BlocksRejection Blocks (ICT Concept) – Complete Guide
1. What is a Rejection Block?
A rejection block is a special type of price level that forms when the market attempts to push through but gets denied and reverses. Unlike a traditional order block, which represents accumulation or distribution by institutions, a rejection block shows a failed attempt to continue in one direction. It is a footprint of rejection and often becomes a strong reaction zone in the future.
There are two types:
Bullish Rejection Block:
Forms from a bearish candle whose low is taken out, but price fails to continue lower and closes back above. The low of that candle becomes the key level.
Bearish Rejection Block:
Forms from a bullish candle whose high is breached, but price fails to continue higher and closes back inside. The high of that candle becomes the key level.
These levels can act as hidden support or resistance and often serve as high-probability entry points when combined with market structure.
2. How to Spot a Valid Rejection Block
To correctly identify rejection blocks, you need to look for:
1. Clear Attempt Beyond a Candle
Price must trade beyond the high or low of a prior candle, suggesting continuation.
2. Failure and Return
After breaching the level, price fails and closes back inside the candle’s body.
3. Liquidity Context
A rejection block is more powerful if the wick that caused it swept liquidity (equal highs/lows or a previous key level).
4. Higher Timeframe Confluence
The best rejection blocks line up with higher timeframe bias (for example, spotting a bearish rejection block inside a 4H premium zone during a downtrend).
3. How to Trade Rejection Blocks
Trading them involves waiting for price to come back to the rejection block level and using it as an entry or reaction zone.
Bullish Setup:
When price trades below a bearish candle, fails, and closes higher, mark the low of that candle. On a retracement, price often retests that level as support.
Bearish Setup:
When price trades above a bullish candle, fails, and closes lower, mark the high of that candle. On a retracement, price often retests that level as resistance.
Entry Technique:
You can enter "blindly" when you're understanding the confluences. But to begin with do this Instead, when price returns to the rejection block, drop to a lower timeframe and look for confirmation such as:
* Fair Value Gap (FVG) entries.
* Market Structure Shift (MSS).
* Liquidity sweeps into the level.
Stop Loss Placement:
Always place stops beyond the rejection candle itself (above the high for bearish RB, below the low for bullish RB).
4. Practical Examples and Market Context
Rejection blocks work best when they appear in the following situations:
Liquidity Sweeps:
After equal highs or equal lows are taken out, a rejection block often marks the failure point.
Inside Premium/Discount Zones:
In a bearish bias, look for bearish RBs in premium pricing. In a bullish bias, look for bullish RBs in discount pricing.
During Consolidation Breakouts:
If the market fakes a breakout and closes back inside, the rejection block often becomes the level to fade the fake move.
For example, if BTC takes out a prior daily high, prints a rejection block, and then closes back inside, the odds of reversal are high, especially if price was already in premium territory.
5. Combining Rejection Blocks with ICT Concepts
To increase accuracy, always combine RBs with ICT’s other tools:
Fair Value Gaps:
If a rejection block aligns with an FVG, it adds strength to the level.
Market Structure Shifts:
A rejection block is more powerful if followed by displacement and an MSS.
CISD Pattern:
A rejection block often forms right after the “Stop Hunt” part of the CISD sequence, serving as a clean entry.
Liquidity Pools:
Look for RBs near equal highs/lows, old highs/lows, or session liquidity (London/New York).
Conclusion
Rejection blocks are subtle but highly effective levels that show where the market tried to extend but failed, leaving behind a hidden form of support or resistance. By themselves they are useful, but when combined with ICT concepts like liquidity sweeps, MSS, and FVGs, they become powerful entry tools. The key is to always wait for price to return and confirm the level before entering, and to only trade them in alignment with higher timeframe bias.
Disclosure: I am part of Trade Nation's Influencer program and receive a monthly fee for using their TradingView charts in my analysis.
___________________________________
Thanks for your support!
If you found this idea helpful or learned something new, drop a like 👍 and leave a comment, I’d love to hear your thoughts! 🚀
Weekly Trade Outlook | Lessons in Discipline, Risk & PerspectiveGreetings Traders,
In today’s video, I’ll be walking you through my end-of-week trade outlook, breaking down every setup I took throughout the week. This session is designed to offer insight into how I apply risk management, trading rules, and maintain psychological discipline in real-time market conditions.
Whether you're struggling with emotional trading, inconsistency, or overtrading, this video will give you a fresh perspective on how structure, faith, and discipline can shape a sustainable trading approach.
Remember: respect your trading rules, pray over them daily, and ask God for the strength to remain disciplined—so you don’t become your own worst enemy in the market.
Let’s grow together,
The Architect 🏛️📈

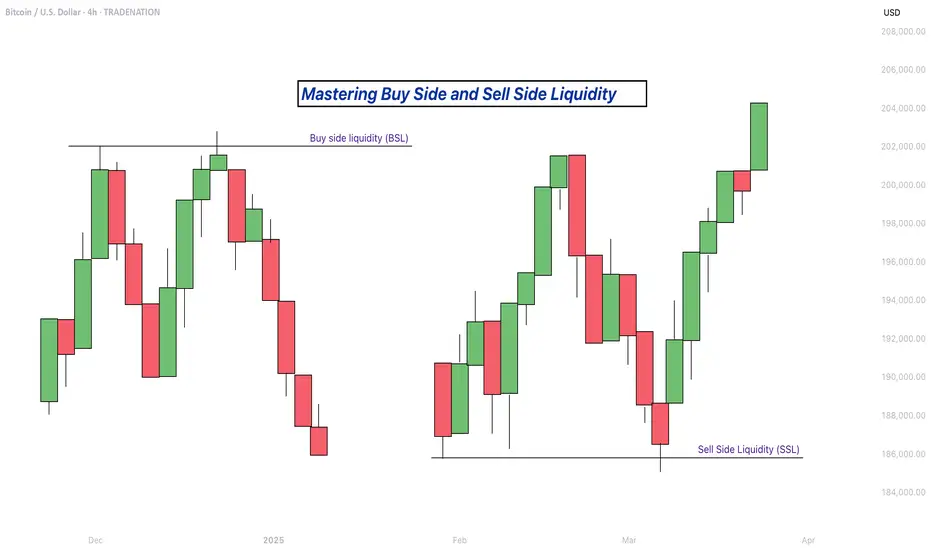
Mastering Buy Side and Sell Side Liquidity - How to trade it!In trading, understanding liquidity is one of the keys to predicting where the market might go next. The Inner Circle Trader (ICT) method teaches traders how to recognize where big players like banks and institutions are likely to enter or exit trades. Two important ideas in ICT trading are buy side liquidity and sell side liquidity. Once you understand what these terms mean and how to spot them on a chart, you can start using them to find better trading opportunities.
What will be discussed?
- What is Buy Side Liquidity?
- What is Sell Side Liquidity?
- How do you see Buy and Sell Side Liquidity?
- Examples
- How to trade BSL and SLL Liquidity?
What is Buy Side Liquidity
Buy side liquidity is found above market highs. It refers to all the stop loss orders from people who are holding short positions. When the market is going down, some traders sell (or go short) and place their stop losses above recent highs to protect themselves. These stop losses are actually buy orders because closing a short position requires buying. Big institutions know this, so they push price upward to trigger those stop losses and grab that liquidity. That’s why you’ll often see the market spike above a recent high before reversing. That spike is the market grabbing buy side liquidity.
What is Sell Side Liquidity
Sell side liquidity is the opposite. It’s found below recent lows. This is where traders who are buying (going long) place their stop losses. If someone buys a market, they’ll usually put a stop loss just below a previous low. That stop loss is a sell order. Smart money looks at these areas as pools of sell side liquidity. So when the market moves down quickly and breaks a recent low, it’s likely collecting those sell stop orders. After that, you’ll often see a reversal because the liquidity has been taken.
How do you see Buy and Sell Side Liquidity?
You can spot buy side and sell side liquidity by looking at the chart and identifying recent highs and lows where many traders might have placed stop losses. These are usually obvious swing highs and swing lows. If you look at a chart and see a clean high where price previously reversed, that’s likely where traders are placing stops. That makes it a target for buy side liquidity. Same for a recent low, if it’s a clean level where people might have bought in the past, that low probably holds sell side liquidity. The more obvious the level looks, the more likely it’s full of stops and therefore a liquidity target.
Examples
How to trade BSL and SLL Liquidity?
Trading liquidity means watching for the market to run above a recent high (to take buy side liquidity) or below a recent low (to take sell side liquidity), and then looking for signs of reversal. Once liquidity has been taken, the market often changes direction.
When you’re trading the ICT concept of liquidity, the key is not just spotting where liquidity lies, but also knowing when price is likely to reverse after that liquidity has been taken. Reversals don’t happen randomly, they leave clues on the chart. Here’s how you can recognize those signs in a simple way:
1. Market Structure Break
This is one of the clearest signs of a reversal. Let’s say the market grabs sell side liquidity by breaking below a recent low. If price then quickly starts moving up and breaks above the last lower high, that’s a break in structure. It shows that sellers are losing control and buyers are stepping in. It’s the first confirmation that the direction might be changing.
2. Rejection Wicks or Strong Candles
After price runs into liquidity (above a high or below a low), watch the candlesticks closely. If you see a long wick rejecting the level, or a strong candle in the opposite direction right after the liquidity grab, that’s a clue. It means price went there, collected the orders, and got rejected fast. That rejection shows the market might be reversing.
3. Fair Value Gaps (FVGs)
Fair value gaps are small “windows” left in price when it moves quickly in one direction. After liquidity is taken and price starts reversing, it often leaves an FVG behind. If price pulls back into that gap and holds, that can be a great entry point. FVGs act like magnets and support zones in ICT.
4. Displacement
Displacement is a strong, impulsive move that breaks structure. It usually happens right after liquidity is taken. If price moves very fast in the opposite direction after hitting a liquidity level, that’s a good sign smart money is behind the move and it’s not just random noise. That strong push is a hint that a new trend might be forming.
5. Change in Character (CHOCH)
This is a shift in how the market behaves. For example, price might be making lower highs and lower lows (a bearish trend), but after liquidity is taken, it suddenly starts making higher highs and higher lows. That change in character tells you the trend might be reversing.
-------------------------
Disclosure: I am part of Trade Nation's Influencer program and receive a monthly fee for using their TradingView charts in my analysis.
Thanks for your support. If you enjoyed this analysis, make sure to follow me so you don't miss the next one. And if you found it helpful, feel free to drop a like 👍 and leave a comment 💬, I’d love to hear your thoughts!
Market Structure Shift Meaning and Use in ICT TradingMarket Structure Shift Meaning and Use in ICT Trading
In ICT (Inner Circle Trader) trading, understanding Market Structure Shifts (MSS) is crucial for accurately interpreting market trends and making informed trading decisions. This article delves into the significance of MSS, its distinct indicators, and how it integrates with other trading elements like Breaks of Structure and Changes of Character.
Understanding Breaks of Structure and Change of Character
Comprehending the dynamics of Breaks of Structure (BOS) and Change of Character (CHoCH) can be crucial for analysing market trends. A Break of Structure occurs when price levels move beyond established support or resistance areas, indicating a potential continuation or acceleration of the current trend. For example, in an uptrend, a BOS is identified when prices break above a previous resistance level, suggesting further upward movement.
Conversely, a Change of Character signifies a possible shift in the market's direction. This occurs when the price action breaks against the prevailing trend, challenging the recent high or low points that served as market barriers. A CHoCH often raises a red flag about the sustainability of the current trend. For instance, in a sustained uptrend, a CHoCH would be marked by a significant downward breach that violates a previous low point, hinting at a weakening of bullish momentum.
Both BOS and CHoCH are pivotal in the ICT (Inner Circle Trader) methodology, where they are used to gauge market sentiment and potential shifts in trend dynamics. Traders monitor these patterns to adjust their strategies, whether to capitalise on the continuation signalled by a BOS or prepare for a trend reversal suggested by a CHoCH.
What Is a Market Structure Shift?
MSS, meaning a Market Structure Shift, is an indicator of a significant change in the prevailing trend, marked by a series of patterns that suggest a reversal is imminent. An ICT MSS is more than a simple Change of Character (CHoCH); it includes additional signals that strengthen the case for a directional change.
The process begins with a shift in market structure that fails to sustain the ongoing trend. For example, during an uptrend, the market might fail to make a new higher high, instead forming a lower high. This initial deviation raises a caution flag about the trend’s strength.
The confirmation of an MSS in trading occurs when there is a decisive break of a significant swing point, accompanied by a strong impulse move that deeply penetrates through this point, known as a displacement. This displacement is critical—it’s not merely a slight breach but a robust move that clearly indicates a shift.
In essence, an MSS signals that the current market momentum has not only paused but is likely reversing. For traders, this is a pivotal moment: the lower highs in an uptrend or the higher lows in a downtrend prior to the break suggest that a new opposite trend is starting to take shape.
How to Use a Market Structure Shift in Trading
An MSS ultimately serves as a directional tool. It helps traders understand when a potential trend reversal is underway, enabling them to align their strategies with the new market direction.
To effectively use an MSS in trading, traders often follow these steps:
- Observing Current Market Structure: They start by analysing the existing trend direction and key price levels. Understand whether the market is in an uptrend, downtrend, or sideways movement by identifying patterns of higher highs and higher lows or lower highs and lower lows.
- Watching for a Break in Key Levels: The core of an MSS is the break of an important high or low, combined with a sharp price movement that breaches a significant swing point (displacement).
- Confirming with News Releases: MSS often coincides with major economic announcements or news releases that can affect market sentiment significantly. For example, if there's a report indicating unexpectedly high US inflation rates, and this correlates with a sharp downward movement in EURUSD, it provides additional confirmation of the MSS. A stronger dollar against the euro, in this case, would signal a clear shift in market direction towards favouring the dollar.
By recognising these elements, traders can more confidently anticipate and adapt to changes in market direction. A well-identified MSS not only indicates a pause in the current trend but also the establishment of a new trend.
Using Market Structure Shifts With Other ICT Components
Using Market Structure Shifts with other Inner Circle Trader methodology components like break of structure, order blocks, and fair value gaps may enhance a trader's ability to interpret and react to market dynamics.
Integrating MSS with ICT Market Structure
An MSS identifies a potential reversal in the market’s direction. When an MSS occurs, it often leads to the formation of a new high-low range in the direction of the new trend. For example, if a bearish MSS results in a new lower high and lower low, traders can watch for a BOS of this range. A retracement back inside of the new range can signal a decent area to search for an entry to ride the trend that’s just beginning.
Utilising Order Blocks and Fair Value Gaps
However, there are scenarios where the price doesn’t establish a new high-low range but instead returns to the area where the original displacement occurred. This displacement often leaves behind a fair value gap and an order block.
- Fair Value Gap: This is a price range that the market skips over quickly during a displacement, leaving it untested by typical market trading. It often acts like a vacuum, drawing the price back to fill in the gap at a later stage.
- Order Block: An order block is typically a consolidation area that precedes a strong price move and is considered a footprint left by institutional traders. It represents levels where significant buying or selling occurred, potentially acting as support or resistance in future price movements.
If the price returns to fill a fair value gap and enters the order block, this scenario can provide a potent setup for a reversal. Traders might look for confirmatory signals at these levels to enter trades that anticipate the market returning to its previous course or extending the reversal initiated by the MSS.
The Bottom Line
The insights provided on MSS and its application within the ICT trading framework can be instrumental for any trader seeking to navigate the complexities of the market effectively. To put these strategies into practice and potentially improve your trading outcomes, practice a lot and learn more about ICT trading.
FAQs
What Is a Market Structure Shift?
A Market Structure Shift (MSS) indicates a potential reversal in market trends, marked initially by a lower high in an uptrend or a higher low in a downtrend, followed by a displacement—a significant and rapid price movement that decisively breaks through a key market level.
How to Identify Market Structure Shift?
Identifying an MSS involves observing for early signs of trend weakening (lower highs or higher lows) and waiting for a subsequent displacement that confirms the shift. This displacement should significantly penetrate a key swing point, clearly indicating a new direction in market momentum.
What Is the ICT Method of Trading?
The ICT (Inner Circle Trader) method of trading is a comprehensive approach that utilises various trading concepts such as market structure, order blocks, and fair value gaps, focusing on how institutional traders influence the market. It emphasises understanding and leveraging these components to align trading strategies with probable market movements.
What Is the Difference Between MSS and BOS in ICT?
In ICT, a Market Structure Shift (MSS) refers to a potential trend reversal, confirmed by a lower high/higher low followed by a displacement. A Break of Structure (BOS), however, simply indicates the continuation or acceleration of the current trend without necessarily suggesting a reversal, marked by the breach of a key high or low point within the ongoing trend direction.
This article represents the opinion of the Companies operating under the FXOpen brand only. It is not to be construed as an offer, solicitation, or recommendation with respect to products and services provided by the Companies operating under the FXOpen brand, nor is it to be considered financial advice.

What Is the ICT Silver Bullet Strategy, and How Does It Work?What Is the ICT Silver Bullet Strategy, and How Does It Work?
The ICT Silver Bullet strategy offers traders a unique approach to capitalising on market opportunities during specific trading hours. This article explored this advanced strategy, explaining the role of fair value gaps, liquidity, and timeframes and how to implement it.
Understanding the ICT Silver Bullet Strategy
The ICT Silver Bullet trading strategy is a sophisticated trading methodology developed by Michael J. Huddleston, known as the Inner Circle Trader, or ICT. This strategy is designed to capitalise on specific, high-probability trading opportunities that align with certain times throughout certain sessions, specifically the London and New York sessions.
Central to the ICT Silver Bullet strategy are two key concepts: liquidity and fair value gaps. Liquidity in this context refers to places within the market where there is significant trading activity, often indicated by previous highs and lows of a trading session or historical price points that attract significant interest from traders.
Fair value gaps are price areas that were either skipped over quickly during rapid price moves or areas where the price has not returned for a significant period, reflecting a disparity between perceived value and market price.
The strategy's effectiveness hinges on executing trades during specific one-hour windows known as Silver Bullet times. By focusing on these concepts and timings, traders can more accurately analyse market movements and align their trades with the influxes of smart money, potentially improving their returns by catching swift moves towards liquidity points.
Key Components of the Strategy
The Silver Bullet ICT strategy employs a detailed approach to trading that revolves around understanding market dynamics at critical times. Here are the key components that define this strategy:
Fair Value Gaps
A fair value gap (FVG) occurs when the price quickly moves away from a level without significant trading occurring at that price, leaving a "gap" that is likely to be tested again when the price returns to this point. In the context of the ICT Silver Bullet strategy, these gaps are targeted because they represent potential inefficiencies in the market where the price may return to balance or fill the gap. Traders using this strategy watch these gaps closely as they often present clear entry points when approached again.
Liquidity Targets
Liquidity targets are essentially areas where there is expected to be a significant volume of orders, which can lead to particular price movements when these levels are approached. These include:
- Previous session highs and lows: These are often areas where stop-loss orders accumulate, making them prime targets for liquidity-driven price moves.
- Swing points in the market: Key reversals and continuation points that have historical significance.
- Psychological levels: These include round numbers or price levels ending in '00' or '50', which often act as focal points for trading activity.
Specific Trading Times
Unlike many strategies that align strictly with market opening times, the ICT Silver Bullet trading strategy utilises specific one-hour windows during the day when liquidity and volatility are expected to be high due to trader participation across the globe. These Silver Bullet hours are strategically chosen based on their potential to tap into significant market moves:
- London Open Silver Bullet: Occurs from 3:00 AM to 4:00 AM Eastern Standard Time (EST) in winter and from 2:00 AM to 3:00 AM in summer, which is 8:00 AM to 9:00 AM Greenwich Mean Time (GMT) in winter and 7:00 AM to 8:00 AM in summer.
- New York AM Session Silver Bullet: From 10:00 AM to 11:00 AM EST, translating to 3:00 PM to 4:00 PM GMT.
- New York PM Session Silver Bullet: From 2:00 PM to 3:00 PM EST or 7:00 PM to 8:00 PM GMT.
These time slots are selected based on historical data showing heightened trading activity and, therefore, increased opportunities to capture moves towards identified liquidity targets.
Implementing the ICT Silver Bullet Strategy
Traders utilising the ICT Silver Bullet strategy typically prepare by marking potential fair value gaps and liquidity targets before these key trading times. As these windows approach, they monitor price action closely for signs that the market is moving bullishly or bearishly toward these liquidity points, enabling them to search for an entry.
Note that because this is an intraday strategy, ICT says it’s better to use a 15-minute timeframe or lower. Most traders use the 1-minute to 5-minute for the Silver Bullet setup, though those inexperienced with the strategy may prefer the 5-minute.
Here’s a breakdown of the strategy:
Entry
- Market Direction and Liquidity Analysis: Before the designated Silver Bullet timeframes, traders perform a detailed assessment of the market direction on higher timeframes, such as the 15-minute to 4-hour charts. This initial analysis is crucial to align their strategies with the market's overall momentum.
- Identifying Key Liquidity Points: Traders also mark significant liquidity targets during their analysis, such as previous session/day highs and lows. These points are expected to attract significant trading activity and thus are critical for planning entry points.
- Formation of Fair Value Gaps (FVG): During the Silver Bullet hours—specifically from 3:00 AM to 4:00 AM, 10:00 AM to 11:00 AM, and 2:00 PM to 3:00 PM EST—traders watch for the market to approach these liquidity points and leave behind a Fair Value Gap. This movement is essential as it indicates a potential inefficiency in price that the market may seek to correct.
- Setting Limit Orders at FVGs: Once an FVG is identified, traders set their limit orders at the boundary of the FVG closest to their intended trade direction. If aiming for a long position, the order is placed at the top of the FVG; for a short position, at the bottom. This method allows traders to potentially enter the market as it moves to 'fill' the gap, aligning with the initial momentum assessment and the subsequent market reaction to liquidity levels.
Stop Loss
- Initial Placement: Traders typically place stop-loss orders to potentially manage risk tightly with respect to the FVG's structure. If trading long, the stop loss might be set just below the low of the candle that forms the FVG; if trading short, just above the high.
- Swing Points: Alternatively, stop losses might also be placed beyond recent swing highs or lows, providing a buffer against market volatility and minor fluctuations that do not affect the overall market trend.
Take Profit
- Targeting Liquidity Points: The common practice for setting take-profit points involves aiming for the next significant liquidity target identified during the preparatory phase.
- Risk-to-Reward Considerations: Many traders set their take-profit goals based on a calculated risk-to-reward ratio, often aiming for at least a 1:2 ratio. This means that for every unit of risk taken, two units of reward are targeted. In terms of pips, traders generally look for at least 15 pips when trading forex and 10 points in indices.
EUR/USD Example
In the provided EUR/USD chart example, a detailed analysis of higher timeframes has established a bearish outlook. Consequently, the focus is on identifying short trading opportunities while disregarding potential long setups.
During the 8:00 AM to 9:00 AM GMT window, there's a noticeable Fair Value Gap (FVG) that forms following a swift rejection from an upward move. This price action reflects a viable entry point for a short position. Traders could place a limit order at the bottom boundary of the candle that initiated the FVG, with a stop loss positioned just above the candle's high or the nearby swing point high, depending on their risk tolerance. The target for this trade is set at the previous day's low, which is reached and prompts a short-term reversal in price direction.
Later in the day, between 7:00 PM and 8:00 PM GMT, another FVG develops. Following the same principle, we can enter at the bottom of the FVG. Setting a stop loss above the swing high is considered more prudent than directly above the candle high, which in this case would likely lead to a stop-out due to the tightness of the entry. Since the previous day’s low has already been reached earlier, the next logical target is the low of the US session, aligning with the day's bearish momentum.
The Bottom Line
The ICT Silver Bullet strategy provides a precise framework for traders looking to exploit specific market conditions tied to the rhythmic movements of liquidity and price during crucial trading hours. By focusing on fair value gaps and strategic entry points, traders can align their actions with significant market forces.
FAQs
What Is the Silver Bullet Strategy in Trading?
The Silver Bullet strategy in trading is a specific, time-sensitive approach designed to capitalise on liquidity and fair value gaps that typically form during key periods of market volatility. Developed by Michael J. Huddleston, also known as ICT, it aims to take advantage of the movements that occur when the market reacts to these gaps during certain hours of the trading day.
What Time Is the Silver Bullet Strategy?
The Silver Bullet strategy is executed during three distinct one-hour windows corresponding to heightened market activity periods. These are:
- London Open Silver Bullet: Occurs from 3:00 AM to 4:00 AM Eastern Standard Time (EST) in winter and from 2:00 AM to 3:00 AM in summer, which is 8:00 AM to 9:00 AM Greenwich Mean Time (GMT) in winter and 7:00 AM to 8:00 AM in summer.
- New York AM Session Silver Bullet: 10:00 AM to 11:00 AM EST (3:00 PM to 4:00 PM GMT).
- New York PM Session Silver Bullet: 2:00 PM to 3:00 PM EST (7:00 PM to 8:00 PM GMT).
How Long Does Silver Bullet Last?
As an intraday trading strategy, the Silver Bullet targets quick, short-term trades within specific one-hour windows. The trades are typically intended to be closed by the end of the trading day, capitalising on rapid movements towards and away from liquidity points.
This article represents the opinion of the Companies operating under the FXOpen brand only. It is not to be construed as an offer, solicitation, or recommendation with respect to products and services provided by the Companies operating under the FXOpen brand, nor is it to be considered financial advice.

How to Master Premium & Discount For Better EntriesA lot of traders talk about premium and discount, but very few actually know how to use it properly. Most just draw Fibonacci tools on random legs and try to catch reactions at the 61.8% level. That kind of trading lacks structure and context. If you're serious about using Smart Money Concepts the right way, then you need to understand where value exists in the market and how to position yourself accordingly.
This guide is all about mastering the premium vs discount model using a 4H bias, entries on the 1H or 15M, and refinements based solely on Fair Value Gaps. No order blocks. No guessing. Just clean structure, displacement, and a focus on institutional logic.
Establishing a Valid 4H Dealing Range
Your entire analysis starts with the 4H chart. That’s where you define the dealing range, the leg of price that caused a significant shift in market structure, usually confirmed by displacement and a break of a previous swing.
To do this correctly:
Identify a 4H swing high to swing low (or low to high) that broke structure and created an imbalance.
Anchor your range from that swing point to the extreme, this becomes your dealing range.
Mark the 50% of this range — this is your equilibrium line.
Everything above this midpoint is premium, everything below is discount.
You’re not drawing fibs for retracement levels. You’re using them to separate cheap price from expensive price.
Premium vs Discount: Why It Matters
The logic is simple: institutions buy at discount and sell at premium. They don’t place large positions in the middle of the range, they accumulate when price is cheap and distribute when price is expensive.
Once you’ve marked out your 4H range, you now have a framework:
Price in discount (below the 50%) = potential buy setups.
Price in premium (above the 50%) = potential sell setups.
The key is to only look for trades in the right part of the range. If price is in premium and you're trying to long, you're working against smart money. If it's in discount and you're trying to short, you're fading accumulation.
Refining the Setup on 1H or 15M
Once price enters the zone you’re interested in, premium or discount. Drop to the 1H or 15M charts to look for entries.
But we’re not trading any structure or supply/demand zone. We’re only interested in Fair Value Gaps. Why? Because FVGs are the cleanest way to spot imbalance — they show where price moved too aggressively and left inefficiency behind.
Here's what to do:
Watch for displacement on 1H or 15M once price taps into the 4H premium or discount zone.
The move should break short-term structure and leave a clear FVG.
Wait for price to retrace into that FVG.
Entry is placed inside the gap, preferably in the upper or lower third depending on direction.
Your invalidation is the low or high of the displacement move.
The FVG gives you a clean risk-to-reward setup that is backed by structure, context, and smart money intent.
Example: Long from Discount
Let’s say price is trading inside the discount zone of a 4H bullish dealing range. You now drop to 15M and see a sharp move higher that breaks structure and creates a clean 15M FVG.
Now you wait.
If price retraces into that gap and shows some form of reaction (volume, reaction wick, or small lower timeframe shift), you have a valid long. The trade is high probability because:
It’s inside 4H discount
The 15M displacement confirms smart money is stepping in
The FVG is your refined entry zone
Target is always the next liquidity pool inside premium.
Example: Short from Premium
Opposite logic applies.
If price trades into the premium zone of a 4H bearish range, you drop to 1H or 15M and wait for displacement to the downside. When you get a strong bearish move that leaves behind a Fair Value Gap and breaks intraday structure, you mark the FVG.
When price retraces into it, you execute your short. Stop is above the displacement high. Target is the first liquidity level inside discount, such as an old low or a clean equal low.
Rules for FVG Entries (1H/15M)
To keep your execution sharp, stick to these:
Only enter FVGs that form from displacement moves.
The FVG must break intraday structure.
It must form inside the 4H premium or discount zone, no exceptions.
Avoid FVGs that form in the middle of the range or during chop.
Make sure higher timeframe context supports the direction.
This filters out 90% of weak setups and forces you to trade in sync with value.
Targets and Exits
Where you enter is based on imbalance and structure, but where you exit is based on liquidity and the premium/discount model in reverse.
If you long from discount, you should be targeting premium levels.
If you short from premium, you should be targeting discount levels.
More specifically:
Look for old highs/lows
Clean equal highs/lows
Unfilled FVGs in the opposite zone
This way, you’re always exiting into areas where the market is likely to reverse or stall, and not overstaying your trade.
Conclusion
Trading from premium or discount zones isn’t just a concept, it’s a framework that puts you in line with institutional activity. When you combine it with FVGs, you have a clean, mechanical way to structure your trades.
Keep your bias on the 4H. Mark your ranges clearly. Drop to 1H or 15M only when price is in a valid zone, and only take entries on FVGs that form from strong displacement. If you stay disciplined with this model, you’ll avoid chasing price and start trading from areas of true value.
___________________________________
Thanks for your support!
If you found this guide helpful or learned something new, drop a like 👍 and leave a comment, I’d love to hear your thoughts! 🚀
Make sure to follow me for more price action insights, free indicators, and trading strategies. Let’s grow and trade smarter together! 📈

Ultimate Guide to Master CISDCISD stands for Consolidation, Inducement, Stop Hunt, Displacement. It’s a simple, repeatable structure that shows how smart money sets up traps in the market to grab liquidity and then make a clean move in the opposite direction.
If you’re serious about trading the ICT style, this is one of the most useful frameworks to learn. It helps you avoid chasing bad breakouts and teaches you to wait for real setups that come after stop hunts and proper market structure shifts.
But there’s one rule that’s non-negotiable — a CISD setup is only valid after a liquidity sweep. If the market hasn’t taken out a clear high or low where stops are sitting, then the rest of the model doesn’t mean anything. No sweep, no trade.
1. Start With the Liquidity Sweep
Everything begins with the liquidity grab. If price hasn’t taken out a high or low where stops are stacked, you should walk away from the setup. Don’t try to front-run a move before smart money has done its job.
The liquidity sweep is what gives the rest of the move power. That’s when price runs through obvious levels, swing highs, swing lows, the Asian range, New York session highs or lows and hits stop losses. Those stops give smart money fuel to enter in the opposite direction.
When you’re watching the market, ask yourself this:
"Who just got stopped out?"
If you can’t answer that, then it’s not a sweep. And if it’s not a sweep, it’s not a CISD.
2. Consolidation — Where Liquidity Builds
This is the first part of the structure. Price starts to move sideways in a tight range, usually during Asian session or during parts of London where volume is low. It can last for hours or even across sessions.
The key here is to understand what’s happening. Traders are placing buys above the highs and sells below the lows. Liquidity is building on both sides. It’s a trap being set. Retail traders are expecting a breakout, but smart money is waiting to use that breakout to their advantage.
Your job in this phase is to identify the range and mark out the highs and lows. That’s where stops will be sitting. You’re not looking to trade during this phase. You’re watching and planning
3. Inducement (sweep)— Fake Break to Trap Traders
After the range is set, price gives a small push out of the range just enough to get people to commit. This is the inducement. It’s the bait.
Let’s say the range high is being tested. Price breaks just above it, traders think it’s a breakout, and they go long. Maybe it holds for a couple of minutes, even gives a small push in their favor. But then it rolls over. That’s the trap. Now those traders are caught, and their stops are sitting below.
Sometimes the inducement comes before the real sweep. Other times, the inducement is the sweep. What matters is that traders have been lured into bad positions and their stops are exposed.
As a trader, your job is not to take the bait. Watch how price reacts to these fake moves. Often, they come with weak volume or are followed by an immediate sharp reversal.
4. Stop Hunt — The Sweep That Validates the Setup
This is where the real move starts to form. Price aggressively runs through the level that holds liquidity, usually below the low or above the high you marked earlier.
This is when smart money takes out the traders who were induced during the fake move. Their stops get hit, and that gives institutions the volume they need to get into the opposite side.
You should be actively watching for a reaction here. Do you see rejection? Does the candle close with a strong wick? Are there signs of absorption or order flow flipping?
This is your validation point. Once price sweeps liquidity and starts to reject the level, that’s your cue to get ready for the next part, the actual shift.
5. Displacement — The Real Move Begins
Once the sweep happens, price doesn’t just drift, it snaps back hard. This is called displacement.
Displacement is a sharp, clean move in the opposite direction of the stop hunt. This is when market structure breaks, momentum shifts, and a fair value gap usually forms.
This is your confirmation that the setup is live. The sweep happened, smart money entered, and now the market is moving with intent.
You don’t want to chase the displacement candle itself. Instead, wait for the retrace. Look for price to come back into the fair value gap or an order block left behind by the impulse. That’s your entry point.
Make sure:
Structure is broken in your direction
The move away is impulsive, not choppy
You’re not forcing an entry on a weak pullback
This is the only part of CISD where you actually take the trade. Everything else is just setup.
How to Manage Risk and Entries
Once you’ve got a valid setup, here’s how to manage it:
Entry: Enter on the CISD or wait for the pullback into the fair value gap or order block. Enter on the reaction or confirmation.
Stop Loss: Place it just past the low or high that got swept. If you’re long, your stop goes below the stop hunt candle. If you’re short, it goes above.
Take Profit: Target the next liquidity level. That could be the other side of the range, a swing high or low, or an inefficiency in price.
You can scale out if price approaches a session high or low, or hold for a full range expansion depending on the session.
Final Thoughts
The CISD model works because it’s built on how the market actually moves, not indicators, not random patterns, but liquidity.
Don’t jump in early. Don’t guess. Wait for the sweep. Wait for the displacement. That’s where the edge is.
Once you get used to watching this play out in real time, you’ll start to see it everywhere. It’s in Forex, crypto, indices, any market that runs on liquidity.
Stick to the rules. Let the model do its job. And remember: no sweep, no setup!
___________________________________
Thanks for your support!
If you found this guide helpful or learned something new, drop a like 👍 and leave a comment, I’d love to hear your thoughts! 🚀
Make sure to follow me for more price action insights, free indicators, and trading strategies. Let’s grow and trade smarter together! 📈

Ultimate Guide to Master ICT KillzonesWhy Timing Matters Just as Much as Price
Smart Money Concepts (SMC) and ICT methodologies are built on the idea that markets are manipulated by large players with precision. While most traders obsess over price levels, entry models, and liquidity zones, many fail to realize that none of those matter if they happen at the wrong time. Time is not an afterthought, it's a core part of the edge.
Price can show you where the move might happen, but time shows you when smart money is most likely to act. That window of action is what ICT calls the killzone.
What Are Killzones?
Killzones are specific time periods in the trading day when smart money typically executes large moves. These sessions have predictable volatility and institutional order flow. They are not just random hours, they coincide with major session opens and overlaps.
The most relevant killzones are:
London Killzone (LKO), 2 AM to 5 AM EST
New York Killzone (NYKO), 7 AM to 10 AM EST
New York Lunch/Dead Zone, 11:30 AM to 1 PM EST (low probability, often reversal traps)
Each killzone offers unique opportunities depending on how liquidity has been engineered prior. ICT-style setups are most reliable when they form within, or directly in anticipation of, these windows.
The Trap Before the Real Move
Smart money loves to trap retail traders. This trap usually happens just before or early in a killzone. For example, if price takes out a key high at 2:30 AM EST (London open), many retail traders see a breakout. But those in tune with SMC see it as a classic liquidity raid, bait before the reversal.
Once that external liquidity is taken, smart money shows its hand with displacement, a sudden, aggressive move in the opposite direction. This typically forms a clean imbalance (Fair Value Gap) or a breaker block. That’s your cue.
If the price returns to that level within the killzone, that’s the optimal entry window.
Confluence is King: Time, Liquidity, and Structure
The most reliable SMC setups happen when:
Liquidity is swept early into a killzone
Displacement confirms the real direction during the killzone
Entry happens via return to an FVG or OB created within that same session
The setup might still look right if it forms outside these windows, but without proper timing, it’s often just noise or engineered liquidity to trap impatient traders.
Real-World Example: NY Killzone Short
NY, At 8:30 AM EST, price runs above the Asian highs, sweeping liquidity
Displacement, Sharp bearish move breaks structure to the downside at 8:45 AM
Entry, Price retraces into the 5M FVG at 9:10 AM
Result, Clean reversal into a nice profit trageting liquidity, all within the NY session
Outside of this killzone structure, the same setup likely would have chopped or failed.
Common Mistakes Traders Make With Time
Chasing price outside of killzones, Setup might look good, but volume is thin and no follow-through comes
Assuming all killzones are equal, London setups are often cleaner in structure, while NY has more manipulation around news
Forcing trades in NY lunch, Midday reversals do happen, but they’re lower probability. If you're not already in a position by 11 AM EST, it's often best to wait for the next day
The Discipline Edge
Most traders overtrade not because they lack setups, but because they don’t filter based on time. By only trading when price interacts with your levels during active killzones, you immediately reduce the number of bad trades and increase your focus on meaningful opportunities.
Good setups are rare. Good setups in the right timing window are even rarer. That’s where consistency comes from.
Final Thoughts
Time is not optional. In SMC and ICT, it’s not enough to have the level, you need the timing. Killzones are your filter, your edge, and your context for every trade.
Once you understand how time and price move together, and stop treating every moment on the chart equally, your trading will start to reflect the true flow of smart money.
Wait for time, wait for price, then strike.
___________________________________
Thanks for your support!
If you found this guide helpful or learned something new, drop a like 👍 and leave a comment, I’d love to hear your thoughts! 🚀
Make sure to follow me for more price action insights, free indicators, and trading strategies. Let’s grow and trade smarter together! 📈

Ultimate Guide to Liquidity Sweeps: Trading Smart Money MovesIn the world of Crypto and other financial markets, liquidity sweeps are deliberate price moves designed to capture liquidity sitting above or below key price levels. These moves are not random, they are orchestrated by large players who need to fill significant orders efficiently. By pushing price into zones where stop-losses and pending orders accumulate, these entities access the liquidity required to open large positions without causing excessive slippage.
Liquidity sweeps offer sharp insights into market structure and intent. Understanding how they work and recognizing them in real-time can significantly enhance a trader’s edge, especially in environments dominated by algorithmic and smart money behavior.
Defining the Liquidity Sweep
A liquidity sweep is characterized by a quick push through a well-defined support or resistance level, typically a recent high or low, followed by a swift reversal. These zones are hotspots for stop orders placed by retail traders, such as long stop-losses placed under swing lows or short stops above recent highs. When these stops are triggered, they act as liquidity pools.
Large players anticipate these zones and use them to enter positions. The sweep creates an illusion of breakout or breakdown, luring reactive traders in, only for the price to reverse direction once the necessary liquidity is absorbed. This mechanism reveals the strategic manipulation often present in efficient markets.
Structure and Behavior of a Sweep
The process typically starts with the market forming a recognizable range, often between a defined high and low. Price then consolidates or slowly trends toward one edge of the range, building tension. As the market reaches that boundary, a sudden surge beyond the level occurs, this is the sweep. Importantly, price does not sustain above or below the level. Instead, it quickly retraces, printing a rejection wick or reversal pattern.
Following the reversal, the market often resumes its original trend or begins a new leg in the opposite direction of the sweep. For traders, this offers a clear point of entry and invalidation, allowing for precise trade setups.
Bullish Scenario, Sweep of Lows
When Bitcoin approaches a prior low, especially one that marked a swing point or a support level, many traders place their stop-losses just below that low. This creates a pocket of sell-side liquidity.
In a bullish liquidity sweep, price will spike below this prior low, often triggered by a news event, a large market order, or a sudden increase in volatility. The market will quickly wick below the level, triggering stop-losses and perhaps inviting new short positions. However, instead of continuing lower, price snaps back above the broken level and begins to climb.
This reversal indicates that large players were absorbing liquidity at the lows and are now positioned long. Traders can look for bullish confirmation via engulfing candles, reclaim of the low, or a fast return into the previous range.
Bearish Scenario, Sweep of Highs
Conversely, when Bitcoin grinds higher toward a prior swing high or resistance level, traders anticipating a breakout may enter early, while others have stop-losses on short positions resting above the level.
A bearish liquidity sweep occurs when price spikes above the prior high, triggering those buy stops and breakout entries. Almost immediately, the market reverses, showing rejection at the highs. This action signals that buy-side liquidity has been used by larger players to enter short positions.
Once price fails to hold above the breakout level and begins to drop, the sweep is confirmed. Traders aligned with this read may look for bearish structure to form, such as a lower high, and enter short with a defined invalidation above the sweep.
Common Pitfalls and Misinterpretations
One of the most frequent mistakes traders make is confusing a sweep for a breakout. Liquidity sweeps are often mistaken for the beginning of a new trend leg, leading to premature entries that quickly get reversed.
Another pitfall is ignoring the broader market context. Liquidity sweeps are most reliable when they occur at logical levels aligned with higher time frame bias. Without that alignment, the sweep may simply be part of a choppy, indecisive range.
Lack of confirmation is also an issue. Entering trades immediately after a wick without seeing structure reclaim, volume shift, or candle confirmation can lead to unnecessary losses.
Confirming a Valid Sweep
To increase confidence in a sweep setup, traders should watch for several confirming behaviors. Volume often spikes during the sweep itself, followed by a drop in volatility as the market reverses. Divergences on momentum indicators like RSI or OBV can also support the idea of an exhausted move.
Most importantly, the reaction after the sweep matters more than the sweep itself. If price fails to reclaim the swept level or continues trending, the move was likely a true breakout, not a manipulation.
In high-probability sweeps, price often reclaims the level and begins forming structure in the opposite direction. Watching for breaker blocks, fair value gaps, or inefficiencies being respected in this phase can also strengthen the case for entry.
Conclusion
Liquidity sweeps are one of the clearest footprints left behind by smart money. While they can be deceptive in the moment, with enough practice and context awareness, they become one of the most powerful tools in a trader’s arsenal.
The key lies in understanding that these moves are engineered, not accidental. Recognizing where the market is likely hunting liquidity, and how it behaves after collecting it, can dramatically improve your ability to enter trades with precision, confidence, and clear invalidation.
__________________________________________
Thanks for your support!
If you found this guide helpful or learned something new, drop a like 👍 and leave a comment, I’d love to hear your thoughts! 🚀
Make sure to follow me for more price action insights, free indicators, and trading strategies. Let’s grow and trade smarter together! 📈

What Is a PD Array in ICT, and How Can You Use It in Trading?What Is a PD Array in ICT, and How Can You Use It in Trading?
The PD array, or Premium and Discount array, is a key concept within the Inner Circle Trader methodology, designed to help traders map market movements and identify high-probability zones. By breaking down price behaviour into premium and discount levels, along with tools like order blocks and fair value gaps, the PD array provides a structured framework for analysis. This article explores its components, applications, and how traders can integrate it into their strategies.
What Is a PD Array?
An ICT PD array, short for Premium and Discount array, is a concept developed by Michael J. Huddleston, the mind behind the Inner Circle Trader (ICT) methodology. At its core, the PD array is a framework used to organise price levels and zones on a chart where significant institutional activity is likely to occur. These zones highlight areas of interest such as potential support or resistance, points where liquidity resides, or regions that might attract price movement.
The PD array divides the market into two primary zones: premium and discount. These zones help traders gauge whether the price is above or below its equilibrium, often calculated using the 50% level of a significant price range. In practical terms, prices in the premium zone are typically considered attractive in a downtrend and unattractive in an uptrend, while prices in the discount zone are more attractive in an uptrend and less attractive in a downtrend.
Beyond premium and discount zones, PD arrays include specific elements like order blocks, which are regions linked to institutional buying or selling, and fair value gaps (FVGs), which are imbalances or gaps in price that the market often seeks to revisit. Together, these elements create a structured roadmap for traders to interpret price behaviour.
Unlike a static indicator, an ICT PD array is dynamic and requires traders to interpret price movements in real time, considering the broader market context. It’s not a quick fix but a methodical approach to understanding how price delivers across different levels, offering a clearer view of where high-probability reactions could occur. The PD array is often combined with other ICT concepts, like market structure shifts or SMT divergence, to sharpen analysis and focus on precise market opportunities.
Premium and Discount Zones of a PD Array
The foundation of a PD array starts with defining the premium and discount zones. This is typically done by identifying a significant price swing—either a low to a high or vice versa—and applying a Fibonacci retracement. The 50% level of this range serves as the equilibrium point, dividing the chart into two zones:
- Premium zone: Price levels above 50%, often considered less attractive in an uptrend and more attractive in a downtrend.
- Discount zone: Price levels below 50%, seen as more attractive in an uptrend and less attractive in a downtrend.
This equilibrium acts as a baseline, helping traders assess whether the price is likely to reverse, consolidate, or continue based on its position relative to the 50% mark.
Tools Within the PD Array
The PD array doesn’t rely on a fixed set of tools. Instead, it offers a collection of components traders can use to refine their analysis. While the choice of tools can vary, they’re often ranked in a loose hierarchy, known as a PD array matrix, based on their importance within the ICT methodology. Let’s break down how this structure works.
Order Blocks
Order blocks are areas where institutional traders placed large buy or sell orders, often leading to significant price moves. On a chart, they appear as the last bullish or bearish candle before a sharp reversal. Order blocks are highly prioritised within the PD array because they indicate zones of potential support or resistance.
Fair Value Gaps (FVGs)
FVGs are gaps between price levels that form when the market moves too quickly to fill orders evenly. These imbalances create "unfinished business" in the market, and price often revisits these areas to restore balance. They are especially useful for spotting potential reversals or continuation points.
Breaker Blocks
Breaker blocks form when order blocks fail. When supply or demand zones are unable to hold and the market structure shifts, breaker blocks emerge, highlighting key levels to monitor.
Mitigation Blocks
Mitigation blocks are related to breaker blocks but form after a market structure shift, where the price makes a lower high (in an uptrend) or a higher low (in a downtrend). They function the same as breaker blocks, but the key difference is in the failure of a new high/low before the trend reverses.
Liquidity Voids
Liquidity voids are areas on the chart where there’s little to no trading activity, often following sharp price movements. These large FVGs are often revisited by price as the market seeks to rebalance liquidity, making them significant for identifying future price movements.
Rejection Blocks
ICT rejection blocks are similar in concept to order blocks but consist of the wicks present on a given timeframe where an order block could be drawn. They are essentially a refined version of an order block where the price may reverse.
Old Lows or Highs
Old lows or highs represent liquidity pools where traders place stop orders. These levels are magnets for the price, as the market often seeks to trigger these stops before reversing. Identifying these points helps traders anticipate where the price might gravitate.
Using ICT PD Arrays for Trading
Let’s consider how to use the PD array of the ICT methodology.
Evaluating Trend Structure
Before anything else, traders typically assess the broader trend by analysing highs and lows. The goal is to identify the current structure and wait for the market to form a new significant high or low that aligns with the existing trend. For instance, in an uptrend, a trader might wait for a new higher high to form, followed by a retracement.
Once the new high or low is established, traders often draw a Fibonacci retracement tool between the previous low and the recent swing high (or vice versa for a downtrend). This creates a clear division of the price range into premium and discount zones, providing the foundation of the PD array.
Retracement into the PD Array
As the price retraces within the range, traders watch for it to reach the premium zone in a downtrend or the discount zone in an uptrend. This positioning is essential—it signals that the price has reached an area where the risk-reward profile may be more favourable.
Finding Specific Setups
Within these zones, traders use the tools of the PD array to refine their approach. For instance, an FVG might act as a key level, particularly if it sits just ahead of an order block. Alternatively, a breaker block might signal a potential reversal if the price aligns with the broader trend structure. By combining these elements, traders can narrow their focus to setups that align with both the PD array and the underlying market conditions.
The Limitations of ICT PD Arrays
While ICT PD arrays offer a structured framework for analysing price behaviour, they’re not without their challenges. Traders relying on this methodology should be aware of its limitations to avoid potential pitfalls. Here are some key considerations:
- Subjectivity in Marking Zones: Identifying premium and discount zones, as well as order blocks or other components, can vary between traders. This subjectivity means that no two analyses are identical, which may lead to inconsistent outcomes.
- Experience Required: Effectively using PD arrays demands a solid understanding of market structure, liquidity concepts, and the ICT methodology. It can feel overwhelming for beginners without adequate practice.
- Higher Timeframe Dependence: While PD arrays are valuable, they’re more popular on higher timeframes. Traders focusing solely on smaller timeframes might encounter more false signals.
- Dynamic Nature: Markets evolve quickly, and PD arrays require traders to adapt in real time. This dynamic quality can be a challenge for those who struggle with decision-making under pressure.
- Overfitting Risk: With so many tools available within the ICT framework, it’s easy to overanalyse or misinterpret signals, leading to analysis paralysis.
The Bottom Line
ICT PD arrays offer traders a structured framework to analyse market movements and identify key price zones, helping them refine their strategies. By combining these arrays with other tools and techniques, traders can gain deeper insights into institutional activity.
FAQ
What Is the ICT PD Array?
The ICT PD array meaning refers to a Premium and Discount array, a trading concept developed within the Inner Circle Trader (ICT) methodology. It organises price levels and zones into premium and discount areas, helping traders analyse where the price is likely to react and reverse and place entry and exit points. The framework includes tools like order blocks, fair value gaps, and liquidity voids to identify potential areas of institutional interest.
What Is a Premium Array in Forex?
A premium array in forex refers to the portion of a price range above its equilibrium level, typically the 50% mark of a significant swing high and low. Traders consider this zone less attractive for buying, as it’s closer to overvaluation, and often watch for potential selling opportunities.
What Is a Discount Array in Forex?
A discount array is the zone below the equilibrium level of a price range. It represents a potentially more favourable area for potential buying opportunities, as prices are considered undervalued relative to the swing high and low.
This article represents the opinion of the Companies operating under the FXOpen brand only. It is not to be construed as an offer, solicitation, or recommendation with respect to products and services provided by the Companies operating under the FXOpen brand, nor is it to be considered financial advice.

Examples of invalid setups | Judas Swing Strategy 07/04/2025As traders, it's crucial to spend time in the lab backtesting your strategy and exploring ways to optimize it for better performance in live markets. You’ll start to notice recurring patterns, some that work in your favor, and others that consistently lead to unnecessary losses. It might take time to spot these patterns and even longer to refine them to fit your trading system, but going through this process is what helps you evolve. In the long run, this is what you need to do to become a better trader.
We spent a considerable amount of time refining our entry technique for the Judas Swing strategy after noticing a recurring issue where entering with a limit order sometimes gets us stopped out on the very same candle. After testing a few alternative entry methods and making some key adjustments, we finally found an approach that worked consistently for us. On Monday, April 7th, 2025, this refinement proved its worth by saving us from two potentially painful losses. In this post, we’ll walk you through exactly what happened and how the improved entry made all the difference.
We got to our trading desks ready to scout for setups and were drawn to promising setups forming on both FX:AUDUSD and $NZDUSD. This was exciting since the previous week offered no solid trading opportunities. As price swept the liquidity resting above the highs of the zone our bias quickly shifted toward potential selling setups for the session. But before taking any trade, we always ensure every item on our entry checklist is met. Here’s what we look for:
1. A break of structure to the sell side
2. The formation of a Fair Value Gap (FVG)
3. A retracement into the FVG
4. Entry only after a confirmed candle close
With the first two requirements on our checklist confirmed, all that remained were the final two and at this stage, patience is key. As price began retracing toward the FVG on both FX:AUDUSD and OANDA:NZDUSD , things got interesting. Price came into the Fair Value Gap on both pairs, checking off the third requirement. Now, all that was left was to wait for the current candle to close.
But that’s where things will be clear to you now.
Had we jumped in early with a limit order, we would’ve been stopped out on the same candle. This moment served as a perfect reminder of why we now wait for a confirmed candle close before taking any trade. It’s this extra step that helps us avoid unnecessary losses and stick to high-quality setups.
This entry technique like any other, comes with its own set of pros and cons. At times a limit order might offer a more favorable entry price compared to waiting for a candle close and that can influence both your stop-loss and take-profit placements. On the flip side, there are also instances where waiting for the candle close gives you a better entry than the limit order would have. That’s why it’s so important to backtest.
Your job as a trader is to put in the time to study and test what works best for your system. We chose this candle close entry method because we did the work. After extensive backtesting and data analysis, we found this approach aligns best with the results we aim for in the long run.

2025 ICT Mentorship: Premium & Discount Price Delivery Intro2025 ICT Mentorship: Lecture 4_Premium & Discount Price Delivery Intro
Greetings Traders!
In this video, we dive into the fundamental concept of Premium and Discount Price Delivery—a crucial aspect of smart money trading that helps us understand how institutions approach the market with precision and efficiency.
Understanding Currency Pairs
Before we explore premium and discount dynamics, it's essential to grasp the basics of currency pairs. A currency pair, like EUR/USD or GBP/USD, represents the value of one currency against another. For example, EUR/USD shows how many U.S. dollars (the quote currency) are needed to purchase one euro (the base currency). Just like any other tradable asset, currency pairs fluctuate in value due to various economic and market factors.
Trading Is Part of Everyday Life
Believe it or not, everyone in the world is a trader. Whether you're buying groceries at a store or negotiating for goods and services, you're participating in trading activities daily. Some people aim to purchase items at a discount, while others can afford to pay a premium—it’s simply part of life.
However, banks and financial institutions take trading to another level. They don’t just trade haphazardly—they operate with extreme precision, aiming to make high-quality investments by executing trades at premium prices and targeting discount levels. This strategic approach allows them to capitalize on market inefficiencies and ensure profitable outcomes.
Why Premium and Discount Matter?
The concept of premium and discount price delivery is foundational for understanding how the market moves. By recognizing where the market is trading at a premium (overvalued) versus a discount (undervalued), traders can make more informed decisions and align their strategies with institutional order flow.
Stay tuned as we break down how to identify these zones on a chart and how to incorporate them into your trading strategy. Make sure to like, subscribe, and turn on notifications so you never miss an update!
Happy Trading,
The_Architect

Mastering ICT Concepts: The Ultimate Trading Strategy GuideA lot of people are drawn to ICT trading concepts because they offer a deep understanding of how the markets truly work. With this guide, I want to explain the most popular ICT strategies in a simple and detailed way to help traders navigate these concepts effectively. The Inner Circle Trader (ICT) methodology offers a suite of trading strategies that delve into market mechanics, focusing on institutional behaviors and liquidity dynamics. This guide explores five prominent ICT strategies: Fair Value Gaps (FVG), Power of Three (PO3), Inversion Fair Value Gaps (IFVG) with Liquidity Sweeps, Breaker Blocks, and the Silver Bullet Strategy. Each section provides an in-depth explanation, trading approach, key considerations, and designated spots for illustrative images.
🔍 1. Fair Value Gaps (FVG)
A Fair Value Gap (FVG) represents a price imbalance created when the market moves rapidly in one direction, leaving a gap between consecutive candlesticks. This gap signals inefficient pricing, which the market tends to revisit later to balance liquidity. Understanding FVGs is crucial as they reveal hidden institutional footprints.
How to Trade:
Identification: Spot an FVG when there is a three-candlestick formation where the second candle creates a gap between the high of the first candle and the low of the third candle.
Retracement Expectation: The market typically seeks to fill these gaps as it rebalances price inefficiencies.
Entry Strategy: Wait for price to return to the gap and enter in the direction of the initial impulse. Confirm the trade with market structure shifts or other confluence factors.
Targets: Use previous highs/lows, liquidity zones, or equilibrium levels (50% of the FVG) as potential targets.
Key Considerations:
Timeframes: Higher timeframes like 1-hour, 4-hour, and daily yield more reliable signals.
Volume Confirmation: High volume during the initial impulse strengthens the likelihood of a retracement.
Partial Fills: The market may not always fill the entire gap.
⚡ 2. Power of Three (PO3)
The Power of Three (PO3) describes how institutional players manipulate price action through three key phases: Accumulation, Manipulation, and Distribution. This strategy highlights how smart money engineers liquidity and misleads retail traders before delivering the intended price move.
How to Trade:
Accumulation Phase: Identify consolidation zones where price ranges sideways, often before major sessions (London or New York).
Manipulation Phase: Wait for false breakouts or stop hunts where price temporarily breaks out from the range before reversing.
Distribution Phase: Enter the trade in the opposite direction of the manipulation, targeting the liquidity created during the false move.
Entry Confirmation:
Market structure shifts after the manipulation phase.
Bullish or bearish order blocks aligning with the intended direction.
Fair Value Gaps in the distribution phase.
Key Considerations:
Patience: This strategy often requires waiting several hours for all three phases to complete.
Liquidity Zones: Look for equal highs or lows near the range to anticipate the manipulation move.
Time Windows: PO3 often plays out during high-volume sessions.
🔄 3. Inversion Fair Value Gaps (IFVG) with Liquidity Sweeps
Inversion Fair Value Gaps (IFVG) are advanced price inefficiencies that act as dynamic support or resistance zones. When price fills a traditional FVG, that zone can later serve as an IFVG—particularly when aligned with liquidity sweeps.
How to Trade:
Identify Original FVG: Locate an FVG that has already been filled.
Liquidity Sweep Trigger: Wait for price to sweep liquidity above or below a key level.
Inversion Zone: When price returns to the previous FVG, treat it as a new support or resistance zone.
Entry Confirmation: Watch for market structure shifts or rejection candles at the IFVG.
Key Considerations:
Confluence Zones: Combine IFVG with liquidity sweeps and order blocks.
Patience: Wait for price action confirmation before entering.
Stop Placement: Place stops below the IFVG in bullish setups or above in bearish setups.
🧱 4. Breaker Blocks
Breaker Blocks are zones where previous support or resistance levels are invalidated by a liquidity sweep, only to become reversal zones. They represent areas where smart money accumulates orders before delivering price in the opposite direction.
How to Trade:
Identify Liquidity Sweeps: Spot areas where price breaks above or below a key high/low before reversing.
Breaker Formation: The candle that invalidates the liquidity sweep forms the Breaker Block.
Entry Strategy: Wait for price to retrace into the Breaker Block and confirm the trade with rejection candles or market structure shifts.
Targets: Previous liquidity pools or opposing order blocks.
Key Considerations:
Higher Timeframes: Use 1-hour or 4-hour charts for the best results.
Volume Analysis: High volume during the breaker formation strengthens the signal.
Risk Management: Place stops beyond the breaker boundary.
🎯 5. Silver Bullet Strategy
The Silver Bullet Strategy is a time-based model designed to capitalize on institutional price delivery patterns during specific one-hour windows. This strategy focuses on liquidity sweeps and Fair Value Gaps within these timeframes.
How to Trade:
Time Windows: Target these key one-hour sessions:
London Open: 03:00 AM – 04:00 AM EST
New York AM Session: 10:00 AM – 11:00 AM EST
New York PM Session: 02:00 PM – 03:00 PM EST
Identify Liquidity Zones: Look for equal highs/lows or session highs/lows.
Execute Trades: Enter trades when price sweeps liquidity and rejects from an FVG or Breaker Block within the Silver Bullet window.
Targets: Use opposing liquidity pools or session extremes.
Key Considerations:
Strict Timing: Only trade within the designated time windows.
Confluence Factors: Combine with market structure shifts and order blocks.
Risk Management: Place stops beyond liquidity sweep wicks.
Conclusion
Mastering ICT trading strategies requires patience, precision, and continuous practice. These five strategies—FVG, PO3, IFVG with Liquidity Sweeps, Breaker Blocks, and the Silver Bullet—provide a comprehensive framework to align with institutional price delivery. Use confluence factors and practice in demo environments before applying these methods in live markets.
Happy Trading!
Note: This guide is for educational purposes only and not financial advice.
__________________________________________
Thanks for your support!
If you found this guide helpful or learned something new, drop a like 👍 and leave a comment, I’d love to hear your thoughts! 🚀

What Is ICT PO3, and How Do Traders Use It?What Is ICT PO3, and How Do Traders Use It?
The ICT Power of 3 is a strategic trading method that helps traders identify behaviour of ‘smart money.’ It dissects market movements into three distinct phases: accumulation, manipulation, and distribution. This article explores the intricacies of the Power of 3 strategy and its practical application in trading.
Understanding the ICT PO3 Trading Concept
The ICT Power of 3 (PO3), or the AMD setup, is a strategic trading framework developed by Michael J. Huddleston, better known as the Inner Circle Trader. This approach revolves around three critical phases: accumulation, manipulation, and distribution, which collectively help traders understand and anticipate market movements.
Accumulation Phase
During this phase, smart money or institutional investors accumulate positions within a price range, often leading to a period of low volatility and sideways movement. This stage sets the groundwork for future price movements by creating a base of support or resistance.
Manipulation Phase
The manipulation phase involves deliberate price moves by smart money to trigger stop losses and deceive retail traders. In a bullish scenario, prices may dip below the established range, while in a bearish market, prices might spike above the range. This phase is seen as being characterised by sharp, misleading price movements aimed at manipulating liquidity.
Distribution Phase
Following manipulation, the distribution phase sees smart money offloading their positions, leading to significant price movements in the intended direction. For bullish trends, this involves a strong upward move, whereas, in bearish conditions, it results in a sharp decline. This phase marks the realisation of the strategic positions built during the accumulation phase.
Understanding this ICT concept allows traders to align their strategies with the actions of institutional investors, potentially enhancing their ability to make informed trading decisions. The ICT PO3 strategy is versatile, applicable across different timeframes and financial instruments, making it a valuable tool for traders in various markets.
Below, we’ll discuss each of these three phases in more detail.
Accumulation Phase
The accumulation phase is a crucial initial stage within the Power of 3 trading strategy. It represents a period where institutional investors, often referred to as smart money, quietly build their positions in a particular asset. This phase is characterised by relatively low volatility and sideways price movement, typically near key support or resistance levels.
During accumulation, the market tends to range within a narrow band as large players gradually buy into the asset without significantly driving up its price. This steady acquisition reflects their confidence in the asset's future appreciation. Recognising the accumulation phase involves monitoring for signs such as low-volatile, ranging price action and potential increases in trading volume without major price changes.
Indicators of the accumulation phase include:
- Low Volatility: The asset trades within a tight range, showing little directional bias.
- Support Levels: Accumulation often occurs near historical support or resistance levels where the price is deemed under or overvalued by institutional investors.
- Increased Volume: There may be a gradual rise in volume as smart money accumulates positions, signalling their interest without causing sharp price movements.
Specifically, this range is also intended to trap retail traders on both sides of the market. In a bullish accumulation, for example, where the price will eventually break upwards, the range will trap bullish traders buying from the support level inside of the range. Given that these traders will most likely set their stop losses below the range, this paves the way for the next stage: manipulation of liquidity.
However, some traders will also take a short position in this range, anticipating that price will continue to break lower. These traders add fuel to the distribution leg discussed later.
The Manipulation Phase
The manipulation phase is a pivotal part of the ICT PO3 trading strategy. This stage is marked by deliberate actions from institutional investors to create market conditions that mislead and trap retail traders. It follows the accumulation phase, where positions are built, and precedes the distribution phase, where these positions are realised.
Characteristics of the Manipulation Phase:
- Deceptive Price Movements: During this phase, the price moves sharply in a direction opposite to the expected trend. In a bullish setup, prices might dip below the established range, while in a bearish setup, they might spike above the range. These moves are designed to trigger stop-loss orders, encourage breakout traders to enter positions and ultimately generate liquidity for the smart money’s large orders.
- Triggering Retail Traps: The primary goal is to shake out early traders by hitting their stop-loss levels. For instance, a sudden dip in a bullish market might make retail traders believe that the market is turning bearish, prompting them to close their positions.
- Creating Liquidity: By inducing these price movements, smart money creates liquidity that allows them to add to their positions at more favourable prices. This phase is crucial for building the necessary conditions for the subsequent distribution phase.
Recognising Manipulation:
- False Breakouts: Characterised by sharp, sudden moves that quickly reverse. These are often designed to lure traders into thinking a breakout has occurred.
- Price Action Signals: Price action that doesn’t align with the overall market structure or sentiment can be a sign of manipulation. This can be especially true after a long uptrend or downtrend, signalling potential exhaustion.
For example, in a bullish market, after a period of accumulation where prices have stabilised within a range, a sudden drop might occur. This drop triggers stop-loss orders and panics retail traders into selling. It also encourages some to trade what appears to be a bearish breakout. Smart money then buys these positions at lower prices, preparing for the distribution phase where they push the prices up sharply.
The Distribution Phase
The distribution phase is the final stage in the Power of 3 trading strategy, where smart money begins to offload their positions built during the accumulation phase. This phase follows the manipulation phase, and it is characterised by strong price movements in the direction opposite to the manipulation.
Key Characteristics of the Distribution Phase:
- Significant Price Movement: This phase involves substantial price changes as institutional investors begin to realise their positions. In a bullish scenario, this means a sharp upward movement; in a bearish scenario, a sharp decline.
- High Volume: The distribution phase is often accompanied by high trading volume, indicating that a large number of positions are being sold or bought back.
- Market Confirmation: During this phase, the true market trend that was obscured during the manipulation phase becomes evident. The price moves in the direction of the original accumulation, confirming the intent of the smart money.
- Retail Trader Participation: Many traders have been shaken out of their positions, including those who were wrong about the initial breakout’s direction and those who were correct but had their stop loss triggered by the manipulation phase. They now pile back into the trade, fueling this strong upward or downward leg.
Recognising the Distribution Phase:
- Price Action: Traders look for strong, sustained movements in price, often with large candles. For a bullish trend, this means a consistent upward movement; for a bearish trend, a consistent downward movement.
- Volume Analysis: Increased trading volume during these price movements indicates distribution.
- Breaking Market Structure: The high or low of the accumulation/manipulation phase will be traded through.
- Technical Indicators: Use of tools like moving averages and support/resistance levels can help confirm the transition into the distribution phase.
For example, in a bullish market, smart money begins to buy aggressively after the price has been manipulated downwards to create liquidity. This buying pressure pushes the price up sharply, signalling the start of the distribution phase. Traders can look for increased volume and price action breaking above previous resistance levels as confirmation.
Practical Application of ICT PO3
The ICT PO3 strategy can be effectively applied by traders through a structured approach involving higher timeframe analysis and keen observation of price movements. Here's how traders typically utilise this strategy:
Setting the Daily Bias
Traders often start by establishing their market bias for the day. This involves analysing higher timeframes to determine the overall market trend. Understanding whether the market is bullish or bearish sets the foundation for the day’s trading strategy.
Marking the Day's Open
After setting the bias, traders mark the opening price of the day. This price point is critical as it serves as a reference for potential manipulation and trading opportunities.
Identifying Manipulation
Traders look for price movements beyond the day's open and the established range boundaries. For a long bias, they observe for manipulation below the open, while for a short bias, they look above the open. This stage is crucial as it indicates where smart money is likely manipulating the market to create liquidity.
Entry Signals
While a trader can simply enter once price trades beyond the day’s open, many choose to confirm the trade. Using a 5-15 minute chart, they might look for signals such as:
- Price moving into a significant area of liquidity beyond a key swing high or low.
- A break of established market structure, such as price beginning to move above previous swing highs in a bullish setup (known as a change of character, or ChoCh).
- Chart patterns or candlestick patterns that indicate a reversal or continuation, such as a hammer/shooting star, wedge, quasimodo, etc.
- A moving average crossover that supports the expected price direction.
- Momentum indicators showing waning momentum in the manipulated direction.
Traders typically place stop losses beyond the manipulation high or low to potentially manage risk here.
Distribution Phase Opportunities
If an entry is missed during the manipulation phase, traders can look for opportunities during the distribution phase. Although this phase may offer a less favourable risk-to-reward ratio, it still provides potential trading opportunities. Traders might wait for a market structure break or ChoCh, followed by a pullback, setting stop losses either beyond a recent swing high/low or beyond the manipulation high or low.
ICT Power of 3 Example
On the GBPUSD 15m chart above, the day open acts as a support level, marking the accumulation phase. A candle wicks below the range, followed by a price break above the range, which then sharply reverses, indicating the manipulation phase. After taking liquidity, price rebounds sharply.
On the 5m chart, a break above the downtrend structure creates a change of character (ChoCh) before price pulls back and breaks above the manipulation high, signalling a bullish market shift. Subsequent pullbacks might be excellent entry points for traders who missed the manipulation phase entries before price marks up further.
The Bottom Line
Understanding and applying the ICT Power of 3 strategy can enhance a trader's ability to navigate market movements. By recognising the phases of accumulation, manipulation, and distribution, traders can better align their actions with institutional behaviours. To implement this strategy and optimise your trading experience, consider opening an FXOpen account for advanced trading tools and support of a broker you can trust.
FAQ
What Is PO3 in Trading?
The ICT Power of 3 (PO3) is a trading strategy developed by Michael J. Huddleston, known as the Inner Circle Trader. It involves three key phases: accumulation, manipulation, and distribution. These phases help traders understand market movements by aligning their strategies with institutional investors.
What Is the Power of 3 ICT Entry?
The Power of 3 ICT entry involves identifying optimal points to enter trades during the phases of accumulation, manipulation, and distribution. Traders typically look for signs of price manipulation, such as false breakouts, and then enter trades in the direction of the anticipated distribution phase.
How Does the Power of 3 Work?
The ICT Power of 3 can be an indicator of potential smart money involvement. It works by breaking down market movements into three phases:
1. Accumulation: Smart money builds positions.
2. Manipulation: Price moves are designed to deceive retail traders.
3. Distribution: Smart money offloads positions, leading to significant price movements in the intended direction.
How to Trade the Power of Three?
To begin Power of Three trading, traders first set their daily bias using higher timeframe analysis. They then mark the daily open and observe for price manipulation. Entry signals include breaks of market structure, liquidity grabs, and candlestick patterns. Traders set stop losses beyond manipulation highs or lows and can also look for entries during pullbacks in the distribution phase.
Trade on TradingView with FXOpen. Consider opening an account and access over 700 markets with tight spreads from 0.0 pips and low commissions from $1.50 per lot.
This article represents the opinion of the Companies operating under the FXOpen brand only. It is not to be construed as an offer, solicitation, or recommendation with respect to products and services provided by the Companies operating under the FXOpen brand, nor is it to be considered financial advice.

Liquidity Sweeps: A Complete Guide to Smart Money Manipulation!🔹 What is a Liquidity Sweep?
A liquidity sweep occurs when price temporarily moves beyond a key level, such as a previous swing high or low to trigger stop-losses and lure breakout traders into bad positions before reversing in the opposite direction. This is a classic smart money technique used to grab liquidity before initiating the real move.
Financial markets need liquidity to function, and institutions (smart money) can’t enter or exit large positions without it. Instead of chasing price like retail traders, they manipulate price to engineered levels where liquidity is resting, allowing them to fill their orders without causing massive slippage.
🔹 How Liquidity Works in the Market
To understand liquidity sweeps, it’s important to know where liquidity pools exist. These are areas where a high number of stop-loss orders and pending market orders are placed.
Stop-loss liquidity: Traders set stop-losses above swing highs and below swing lows. When price hits these levels, stop-loss orders trigger as market orders, adding fuel for big moves.
Breakout trader liquidity: Many traders enter buy trades when a high is broken and sell trades when a low is broken. Smart money often uses these breakout orders as liquidity before reversing the market.
Essentially, liquidity sweeps allow smart money to take the opposite side of retail traders’ positions before moving the market in their favor.
🔹 Identifying Liquidity Sweeps on the Chart
A valid liquidity sweep has three key components:
1️⃣ A Key Liquidity Zone:
Look for well-defined swing highs and lows where stop-losses are likely sitting.
Equal highs and equal lows are prime targets because many traders place stops there.
Areas with high trading activity (volume profile levels, POCs) are also potential liquidity pools.
2️⃣ A Quick Price Spike Through That Level:
Price briefly moves beyond a high or low, triggering stop-losses and luring breakout traders in the wrong direction.
This move often happens suddenly, with a sharp candle wick or a short-term breakout that quickly fails.
3️⃣ An Immediate Reversal (Rejection):
Price fails to hold above/below the liquidity level and reverses aggressively.
Strong rejection candles like long wicks, bearish engulfing (after a buy-side sweep), or bullish engulfing (after a sell-side sweep) confirm the sweep.
The stronger the rejection, the higher the probability that smart money just manipulated price to collect liquidity before the real move.
🔹 Types of Liquidity Sweeps
🔸 Buy-Side Liquidity Sweep (Bull Trap)
Price spikes above a key high, triggering stop-losses from short sellers and inducing breakout buyers.
If price fails to hold above that level and quickly reverses, it confirms the sweep.
This is a signal that price is likely to drop as smart money absorbs liquidity before selling off.
Example of a buy side liquidity sweep (BSL)
🔸 Sell-Side Liquidity Sweep (Bear Trap)
Price dips below a key low, triggering stop-losses from long traders and trapping breakout sellers.
If price fails to hold below that level and quickly reverses, it confirms the sweep.
This is a signal that price is likely to rise as smart money collects liquidity before pushing higher.
A liquidity sweep is not just a random wick, it’s a strategic price move designed to trap traders before a reversal.
Example of a sell side liquidity sweep (SSL)
🔹 Why Liquidity Sweeps Matter
Liquidity sweeps provide traders with some of the highest probability reversal signals because they:
✔ Show where institutions and smart money are active
✔ Confirm major support and resistance levels
✔ Help traders avoid false breakouts
✔ Provide excellent risk-to-reward setups
Once a liquidity sweep is confirmed, price often moves aggressively in the opposite direction, as smart money has finished collecting liquidity and is now driving price toward their true target.
🔹 How to Use Liquidity Sweeps in Your Trading
1️⃣ Identify Key Liquidity Zones
Mark previous swing highs and lows where traders are likely placing stop-losses.
Pay attention to equal highs/lows and tight consolidations, as these areas tend to hold a lot of liquidity.
Use volume profile tools to see where the highest liquidity clusters exist.
2️⃣ Wait for a Liquidity Sweep & Rejection
Don’t enter just because price broke a high/low, wait for confirmation.
A strong rejection candle (wick, engulfing pattern, pin bar, etc.) signals that the sweep was a trap.
Lower timeframes (5m, 15m) can help confirm entry after a sweep happens on higher timeframes.
3️⃣ Combine with Other Confluences
Liquidity sweeps are most effective when combined with:
✅ Fair Value Gaps (FVGs): Price often sweeps liquidity before filling an imbalance.
✅ Order Blocks: Smart money enters positions at order block levels after a sweep.
✅ Fibonacci Retracements: Sweeps often happen near the Golden Pocket (0.618 - 0.65).
✅ Volume Profile (POC): If a sweep happens near a Point of Control (POC), it adds extra confluence.
The more confirmations you have, the higher the probability of a successful trade!
🔹 Common Mistakes Traders Make with Liquidity Sweeps
Entering too early: A liquidity sweep needs confirmation. Wait for a clear rejection before trading.
Ignoring higher timeframes: The strongest sweeps happen on 1H, 4H, and Daily charts. Lower timeframes can be noisy.
Forgetting the invalidation rule: If price closes above/below the liquidity sweep level, the move may not be valid.
Chasing price after a sweep: Always look for an optimal entry (retracement to a key level) rather than impulsively entering.
🔹 Advanced Tips for Trading Liquidity Sweeps
📌 Use Time-of-Day Analysis:
Liquidity sweeps often occur before major sessions open (London, New York, etc.).
Many sweeps happen during high impact news releases, be cautious.
📌 Look for Repeated Sweeps at the Same Level:
If price sweeps liquidity multiple times without follow through, it increases the chance of a strong reversal.
A double or triple sweep is a powerful confirmation that smart money is manipulating price before a real move.
📌 Use Liquidity Sweeps for Entry & Exit Points:
Entering after a confirmed liquidity sweep can provide great risk-to-reward setups.
Use liquidity sweeps as take-profit targets if price is approaching a key high/low, expect a sweep before reversal.
📌 Final Thoughts: Mastering Liquidity Sweeps
Liquidity sweeps are one of the most powerful tools in a trader’s arsenal because they reveal smart money’s true intentions. By understanding how they work, traders can:
✅ Avoid being trapped by false breakouts
✅ Identify high-probability reversal points
✅ Follow smart money instead of fighting it
Next time you see price breaking a high or low, don’t immediately assume it’s a breakout. Look for the liquidity sweep if it happens, it could be a game changer for your trading strategy. 🚀
Also, check out our Liquidity sweep indicator!
__________________________________________
If you found this guide helpful or learned something new, drop a like 👍 and leave a comment. I’d love to hear your thoughts! 🚀
Make sure to follow me for more price action insights, free indicators, and trading strategies. Let’s grow and trade smarter together! 📈✨

2025 ICT Mentorship: Institutional Market Structure Part 22025 ICT Mentorship: Lecture 3_Institutional Market Structure Part 2
Greetings Traders!
In Lecture 3 of the 2025 ICT Mentorship, we dive deep into the core principles of market structure, focusing on how institutions truly move the market. Understanding this is essential for precision trading and eliminating emotional biases.
Key Insights from the Lecture
🔹 Distinguishing Minor vs. Strong Swing Points – Learn to differentiate between structural noise and true market shifts.
🔹 Marking Market Structure with Precision – Objectively analyze price action to refine your decision-making process.
🔹 Institutional Market Structure Techniques – Align with smart money to enhance accuracy and consistency.
Why This Matters
Mastering market structure allows traders to anticipate price movement, reducing impulsive trades and reinforcing a disciplined approach. By integrating institutional strategies, we position ourselves for more accurate and confident executions.
Stay focused, keep refining your skills, and let’s continue elevating our trading game.
Institutional Market Structure Part 1:
Enjoy the video and happy trading!
The Architect 🏛️📊

Institutional Market Structure: How to Mark It!2025 ICT Mentorship: Lecture 2
Video Description:
📈 Unlock the Secrets of Institutional Market Structure!
Hey traders! Welcome to today’s video, where we lay the foundation for mastering how the market truly moves. Understanding market structure is the key to improving your trading precision and analysis.
In this session, we’ll break down the difference between minor swing points and strong swing points—a crucial distinction for objective and accurate structure analysis. You’ll learn how to mark market structure properly, keeping emotions in check and aligning with solid trading psychology.
🎯 What You’ll Gain:
✅ Identify market structure like a pro
✅ Enhance your objectivity and reduce impulsive decisions
✅ Master institutional techniques for improved accuracy
If you’re ready to take your trading to the next level and build a strong foundation, hit play and let’s dive in!
💬 Don’t forget to like, comment, and subscribe for more game-changing insights. Share your thoughts below—I’d love to hear how this helps your trading journey!
Enjoy the video and happy trading!
The Architect 🏛️📊

Foundations of Mastery: 2025 Mentorship Begins!📢 Welcome to the 2025 Mentorship Program!
Greetings, Traders!
This is the first video of the 2025 Mentorship Program, where I’ll be releasing content frequently, diving deep into ICT concepts, and most importantly, developing structured models around them. My goal is to help you gain a deeper understanding of the market and refine your approach to trading.
Before we get started, I want to take a moment to speak to you directly.
💭 No matter where you are in your trading journey, I pray that you achieve—and even surpass—your goals this year.
📈 If you’re striving for consistency and discipline, may you reach new heights.
💡 If you’ve already found success, may you retain and refine your craft—because growth never stops.
🎯 If you’re just starting out, I pray you develop patience, discipline, and above all, accountability—because true progress comes when we own our failures and learn from them.
🔥 If you’ve been trading for years but still struggle with consistency, do not give up. The greatest adversity comes when you’re closest to success. Stay disciplined, stay dedicated, and keep pushing forward.
Above all, let this be a year where we grow together—not just as traders, but as individuals. May we foster humility, respect, and a learning environment where both experienced and new traders can share knowledge and thrive.
🙏 I pray over these things in the name of Jesus. Amen.
Let's have a great year!
The_Architect

Sensitivity of Sunday Opening Price in ICT Concepts!!In the context of ICT (Inner Circle Trader) trading concepts, the "Sunday Open Price" refers to the price at which a currency pair opens on a Sunday evening, usually during the Asian market session, which is considered a key reference point for identifying potential market imbalances and trading opportunities throughout the week, as it often marks the start of a new trend or price movement.

Trading EURUSD and NZDUSD | Judas Swing Strategy 17/01/2024Last Friday was an exciting day trading the Judas Swing strategy! We were fortunate to spot two solid opportunities, one on EURUSD and the other on NZDUSD. Both trades presented similar setups, and once they ticked all the boxes on our trading checklist, we didn’t hesitate to execute. In this post, we’ll walk you through the entire process, from setup to outcome and share key insights from these trades.
By 8:25 EST, we were at our trading desk, prepping for the session to kick off at 8:30 EST. During that brief wait, we marked our trading zones and patiently watched for liquidity resting at the highs or lows of the zones to be breached. It didn’t take long, NZDUSD breached its low within 20 minutes, while EURUSD followed suit just 40 minutes into the session. With the liquidity sweep at the lows complete, we quickly shifted our focus to spotting potential buying opportunities for the session ahead.
Even though we had a bullish bias for the session, we never jump into trades blindly. Instead, we wait for confirmation—a break of structure to the upside, accompanied by the formation of a Fair Value Gap (FVG). A retrace into the FVG serves as our signal to enter the trade. On this occasion, both currency pairs we were monitoring met these criteria perfectly. All that remained was for price to retrace into the FVG, setting us up to execute the trade with confidence.
Price retraced into the FVG on both EURUSD and NZDUSD, meeting all our entry requirements. We executed the trades risking 1% on each setup, putting a total of 2% on the line. Our target? A solid 4% return. The setup was clear, the risk was calculated, and we were ready to let the trades play out
After executing the NZDUSD trade, it was pure momentum—zero drawdown as the trade went straight into profit without hesitation. The same was true for EURUSD, which also faced minimal to no drawdown and quickly hit our take-profit target. Both trades wrapped up in just 25 minutes, netting us a solid 4% return. These are the kinds of sniper entries traders dream of!
But let’s be real, trading isn’t always this smooth. There will be times when you face deep drawdowns and even losses. The key is ensuring your strategy wins more often than it loses. And if your losses outweigh your wins, make sure your winners are big enough to cover those losses. Consistency and proper risk management are what keep traders in the game for the long haul
