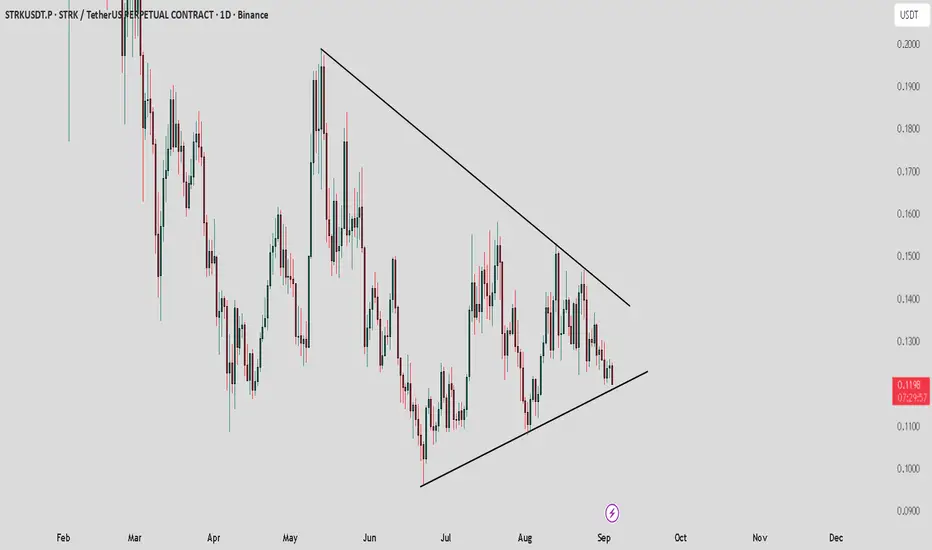
STRK / USDT : Near to support of symmetrical triangleSTRK/USDT is trading near the support of the symmetrical triangle.
Bullish scenario: If support holds, price could bounce toward the resistance at $0.13.
Bearish scenario: A breakdown from this support may drag price toward $0.096.
Always wait for confirmation before entering. Manage risk properly and trade according to market conditions.
IDEA
GOLD: market at a crossroads after the impulseOn the 1H chart, gold remains in an uptrend channel, but after testing the 3545–3550 zone, a corrective pullback is possible. The red lines represent a projected head-and-shoulders scenario, but the pattern is not yet confirmed - it remains only a forecast. Key levels to watch: 3510 as initial support and 3480 as a deeper target if price breaks the channel to the downside. As long as price holds above, the broader trend remains bullish.
From a fundamental perspective , weak ADP employment data provided short-term support, yet the market reaction was muted since dovish Fed expectations are already priced in. Stronger dollar data or rising Treasury yields could put renewed pressure on gold. Fed commentary in the coming days will be crucial for market direction.
Tactical plan: monitor the 3545–3550 zone where sellers may step in. A confirmed break below 3510 opens the way to 3480, but without a completed head-and-shoulders, the move remains speculative. Gold is notorious for punishing premature shorts, so caution is warranted.

JBLU: Breakthrough and growth potentialAn analysis of JetBlue Airways (JBLU) shares on the daily chart indicates the formation of a bullish pattern with a clear breakout of the resistance level. After consolidation and a rebound from significant support levels, the price broke through the upper boundary of the descending triangle, which is confirmed by an increase in trading volume. This breakout opens the way to a target level around $6.95, which corresponds to the 1.618 Fibonacci extension. Technical analysis indicators also confirm the strengthening of the bullish momentum, pointing to favorable prospects for further growth. We expect the upward movement to continue, with the previous resistance zone acting as a key support level after the breakout. Given the current dynamics and technical signals, JBLU shares are of interest to investors seeking medium-term profits.

CHWY in ConsolidationHi Traders!
In my previous post, I mapped out my long plan, and took profits around resistance at $42. Since then, CHWY has returned back to my entry area I am re-adjusting myself for another set up. Right now it is retesting the Daily CHOCH area again, and seems to be in consolidation. If the Daily CHOCH is valid, I would like to see a bullish engulfing, or a strong bounce to act as support.
If the CHOCH area fails, I will look for a re-entry around $36. That will bring price towards a Daily order block. Therefore, a bearish sentiment would be a close below $39, retests from below turning into resistance. No trade if it just chops between $39 & $40 with weak candles. This will avoid me getting caught in consolidation and chopping up my contracts.
*DISCLAIMER: I am not a financial advisor. The ideas and trades I take on my page are for educational and entertainment purposes only. I'm just showing you guys how I trade. Remember, trading of any kind involves risk. Your investments are solely your responsibility and not mine.*

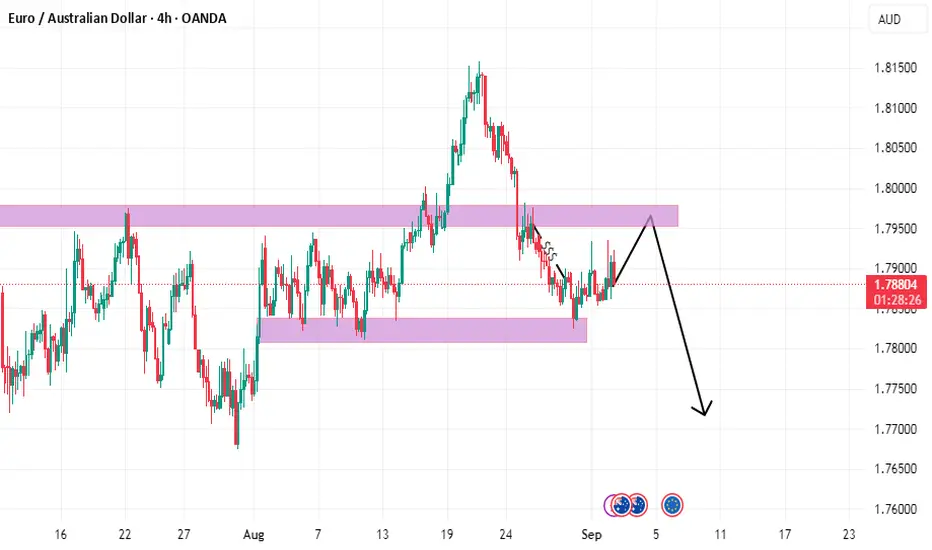
EURAUD What do you think?the general trend on the daily frame indicates an upward trend
so it will rise to take liquidity on 4h frame
then it will fall due to the formation of head and shoulders
and due to the strong resistance
Analysis JELLYJELLY/USDT. Steady Growth
This asset is currently in a sustainable long trend. Below the current price, we see the formation of a strong volume zone at $0,022–$0,0195. If tested with a reaction, further upward movement may be expected.
This publication is not financial advice.

GBPUSD BUY SETUP AGAIN LOOOOOOOOONGI explained before that the price will make an impulsive wave upward
as in this picture
and now It could make impulsive wave and retested as in picture
and now I Wait big impulsive wave uptrend
and the price break the flag and retested so I will buy with you

GBPUSD SETUP BUY AGAINWhat do you think?
in my opinion, the price will fall to demand area
AND THIS DEMAND AREA is strong as it could break downtrend line
so I will buy from this area ,but when the price make rejection from this area or when reflected
And you can look on this analysis in down

GBPUSD STRONG SIGNAL BUY SETUP LOOOOOOOOOOOOOOOOOONGWhat do you think?
we have head and shoulder
and have uptrend on high time frame reflect from real bottom after take liquidity
and the price made fake breakout
on another second shoulder the price reflect from strong support
and made engulfing candle
The price made bearish flag and is broken and retest on frame 4H which indicate an upward trend
so I expect the price will rise
what's your opinion?
Don't forget to follow me
and like . thank you

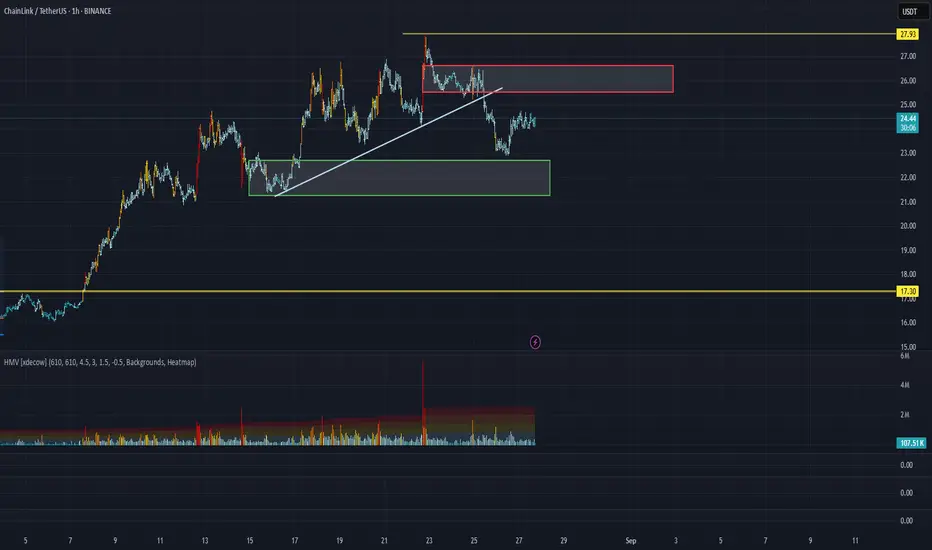
LINK/USDT Analysis. Short Setup
This asset has made a trend break to the downside. A strong volume zone has formed above the current price. If the price tests the $25.5–$26.6 range and shows a reaction, we consider short entries.
Retrace before continuationTRADENATION:XAUUSD
Gold is forming a HH (highhigh) and LH (lowerhigh) momentum. I would try and look if gold respects the 3370 support, if not the other support is at 3360. Lets be patient and see how gold moves.
For it to be legit we need a strong bullish candle to close after hitting 3370 or 3360 supports, then we can place a trade aiming for 3390-4100.

EURCHF SELL SETUP SIGNAL Hello everyone, if we focus on the chart, we will see a possible head and shoulders formation, and we will also see a bullish flag indicating a decline. We also have a consolidation area at the top that was broken downwards to continue the decline, in addition to the German GDP (Sabe), which indicates a decline in the Eurozone, especially the selfish economy, the strongest economy in the Eurozone, which supports our analysis.

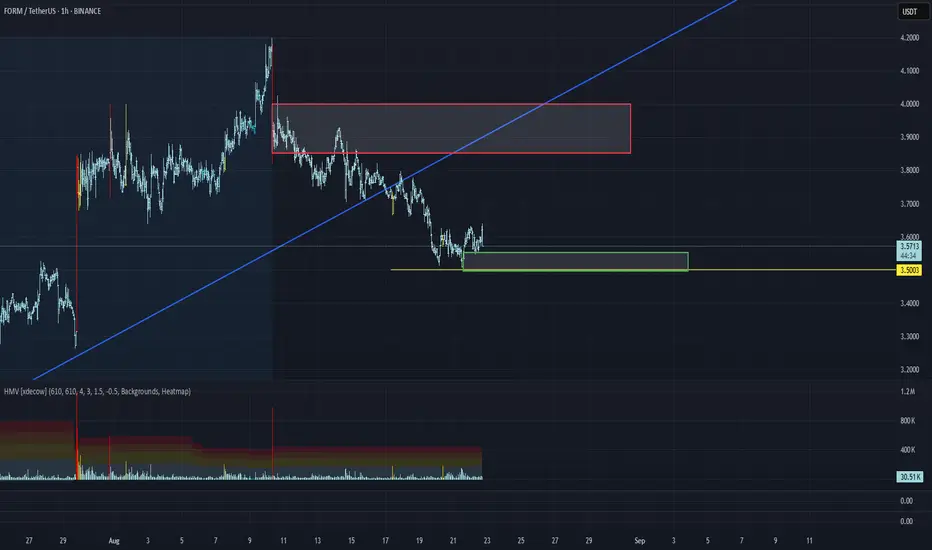
FORM/USDT Analysis. Two Interesting Trade Opportunities
This asset has broken its overall uptrend, and in the long term the potential remains directed towards $3–$2.7. However, during the current decline, we observe a strong divergence with cumulative delta: the price is falling while delta is rising, which indicates a possible strong limit buy.
Locally, we consider a long entry on a test of the $3.55–$3.5 zone if a reaction occurs. After that, if the price reaches the $3.85–$4 zone, we will consider a short position.
This publication is not financial advice.
SKL/USDT Analysis. Interesting Long Opportunity
We have previously provided analysis on this token, along with an update in the comments (the post is pinned).
At the moment, the price has entered an important buy zone, where a market buyer has appeared, and a graphical trend break has occurred.
We consider joining long positions on a retest of the local zone at $0.0315–$0.03. The initial target is $0.04.
This publication is not financial advice.

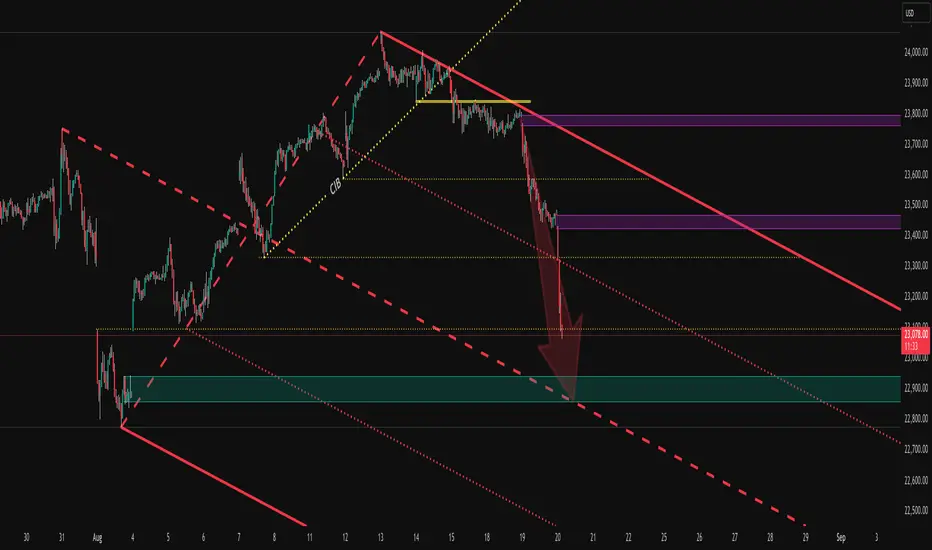
GOLD 4H - all eyes on 3350, death cross at workThe technical picture on gold strengthens the bearish case: on the 4H chart, a death cross (MA50 crossing MA200 downward) has formed, signaling short-term pressure from sellers. The key sell zone is 3350, where the 0.618 Fibonacci, descending trendline, and volume cluster converge. From here, a downward move is expected with first targets at 3311, then 3285, and extended potential towards 3270 (127.2–161.8 Fibo). Volume confirms declining buyer interest near local highs, while RSI shows reversal divergence, adding weight to the bearish scenario.
Fundamentally , gold is under pressure as the market factors in the possibility of more aggressive Fed actions if inflation risks persist. At the same time, safe-haven demand is weakening due to DXY stabilization. Geopolitics is not providing immediate triggers for gold hedging, which also cools investor interest.
Tactical plan: if 3350 acts as resistance, it opens an attractive short opportunity toward the mentioned targets. However, if price breaks and consolidates above 3350, the scenario must be reassessed as stop-hunting will begin.
Ironically, gold - the eternal store of value - acts like a teenager again: offended at 3350 and ready for a tantrum downwards.

NQ - If you're curious to where Nasdaq is going todayNot much to babble.
This is my intraday Chart.
TGT at the Centerline...where else? §8-)
Trade save. NO FOMO!!!
Gold: death cross doesn’t forgive bullsTechnically , gold is stuck around 3336–3354, right at the 0.705–0.786 Fibo cluster and strong volume resistance. But the key signal is a death cross: MA50 cutting below MA200. This bearish pattern strengthens the downside outlook. RSI remains weak, confirming lack of buying momentum. If 3336 breaks, targets lie at 3298 and 3282 (1.618 Fibo extension).
Fundamentally , gold lacks bullish support. The dollar may not be overly strong, but it stays stable thanks to Fed’s cautious policy. Oil near highs fuels inflation expectations, making gold less attractive. No new geopolitical shocks mean safe-haven demand stays muted.
Tactical plan : below 3354 pressure remains on sellers. Break under 3336 confirms downside with 3298 → 3282 targets. Only a close above 3354 would flip the short-term bias, but current MA structure and volume point to more weakness.
Bottom line: death cross is not a romantic metaphor - it’s a cold reminder that bulls are losing the fight.

USDJPY STRONG SIGNAL FOR BUYINGThe price face buying pressure
and it want to form head and shoulder
and it now on second shoulder
and reflect from order block and support so i think in buying

SKL/USDT Analysis — Key Decision Zones
This coin has been among the top gainers over the last three days.
Currently, it is in a correction phase and is approaching the local buy zone at $0.0414–$0.039. Given the weak price action, it is likely that we’ll see a reaction from this zone.
Above the current price, there is also a very important zone at $0.047–$0.0515, with significant volume-based profit-taking already positioned for short bias. Upon a test of this zone and a confirmed reaction, a short position could be considered.
This publication is not financial advice.

DXY: Dollar’s ready, but the starter pistol’s still silentDXY is holding in the 97.50–97.60 support zone, an area where buyers have stepped in multiple times. Current market structure suggests possible liquidity accumulation before an upside move. The key tactical trigger is a breakout and close above 98.76, opening the path to 100.28, then 101.84 where historical selling pressure has emerged. The long-term target, if all levels break in sequence, is 104.40. While price remains below 98.76, buyers have no confirmed advantage and any rally remains speculative.
Fundamentally , the dollar lacks unconditional support: US macro data is mixed and Fed policy remains uncertain. However, safe-haven demand and cautious risk positioning by large players create a backdrop for a potential upward correction.
Tactical plan: watch 97.50–97.60, a confirmed break above 98.76 activates a move towards 100.28 → 101.84 → 104.40. Failure to break cancels the idea until a fresh impulse emerges.
The dollar right now is like a boxer before stepping into the ring - warmed up, focused, but waiting for the bell.

NZDJPY BUY SETUPWe have an uptrend with a head and shoulders pattern and the price will definitely reach the target without much talk, so stay tuned.

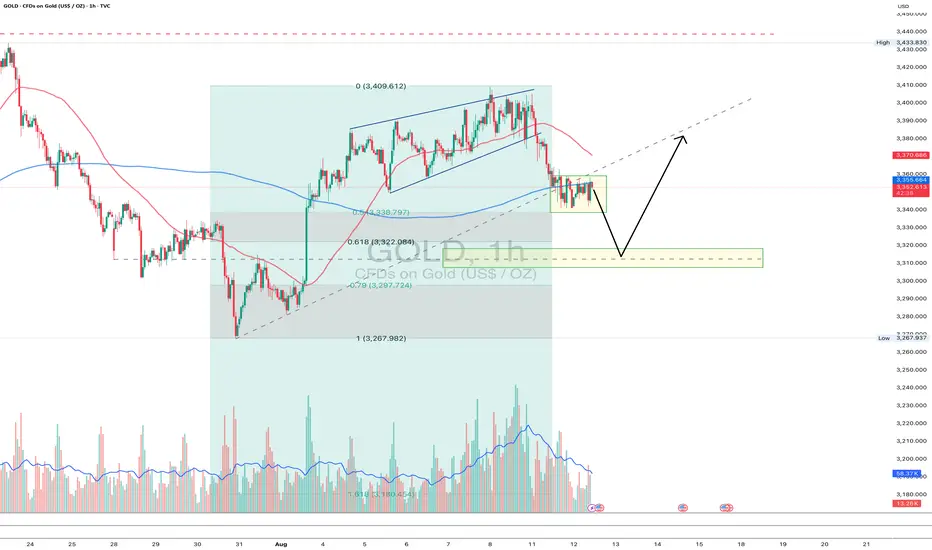
Gold 1H - test of 0.618 and possible reversalOn the hourly gold chart, price continues to correct after breaking out of the broadening channel. Current consolidation is forming below the 0.5 Fibo (3338), and the structure suggests a high probability of a drop toward the key 0.618 Fibo support zone at 3322–3310. This level also aligns with a previous major reversal point, adding to its significance. If the market reaches this zone and prints a reversal pattern, technical conditions will be set for a potential bullish move back toward 3370 and higher.
From a fundamental standpoint, gold trades in an environment of uncertainty, with the market assessing the Fed’s monetary policy outlook and reacting to shifts in inflation expectations. The absence of strong USD pressure leaves room for a recovery if large-scale buying appears near 3322.
Tactical plan: watch for price action in the 3322–3310 zone - a confirmed bullish signal could trigger longs targeting 3370 and 3400. A break below 3310 invalidates the bullish setup. As often happens with gold, the most interesting moves start right where most traders run out of patience.
GBPUSD SELL SETUPI EXPECT THE PRICE Will fall as we have bearish flag has been broken
and we have down trend and we have supply
