When Indexes Disagree: Evidence-Based Clues Heading Into 2026Market Context: Why Futures-Based Index Analysis Matters
When equity markets approach historical extremes, surface-level price action often hides important structural information. This is especially true when analyzing cash indices alone. Futures markets, by contrast, provide continuous pricing across all trading sessions, including the Globex (Extended Trading Hours) session, offering a more complete picture of participation, liquidity, and risk transfer.
By focusing on US equity index futures rather than cash indices, traders gain visibility into how markets behave outside regular trading hours — often where meaningful positioning occurs. This becomes particularly important when markets are near all-time highs and internal alignment begins to fracture.
In this analysis, attention is placed on the four most relevant US equity index futures:
E-mini S&P 500 Index Futures (ES)
E-mini NASDAQ 100 Index Futures (NQ)
E-mini Dow Jones Index Futures (YM)
E-mini Russell 2000 Index Futures (RTY)
Together, these markets represent large-cap growth, broad market exposure, industrial and value-oriented components, and small-cap participation. When these indexes move in harmony, trends tend to persist. When they diverge, conditions often become more fragile.
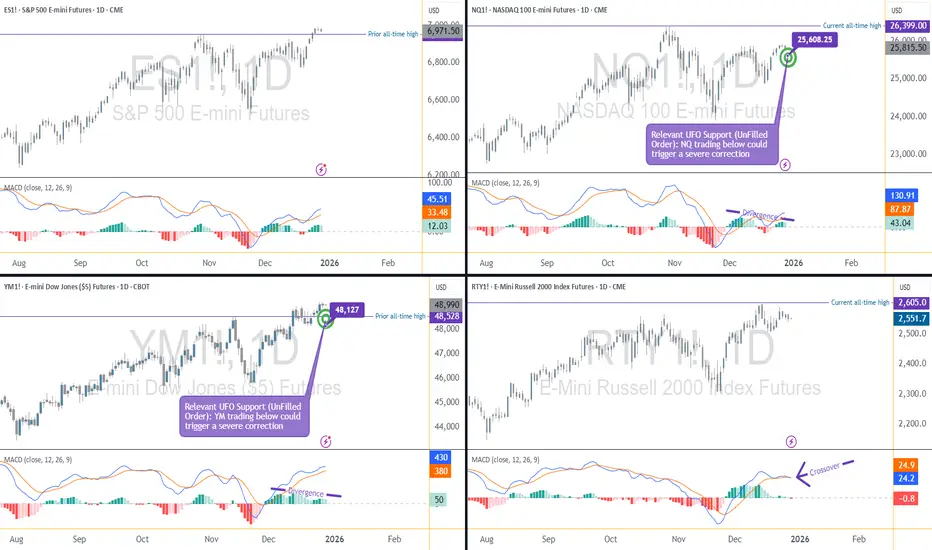
All-Time Highs in Focus: Who Is Leading and Who Is Lagging
A defining characteristic of the current environment is disagreement among indexes, despite elevated price levels.
The E-mini S&P 500 Index Futures (ES) has recently pushed to a new all-time high. This reflects ongoing strength in the broader market and confirms that headline risk appetite remains intact.
In contrast, the E-mini NASDAQ 100 Index Futures (NQ) has failed to confirm this strength. Despite previous leadership, NQ is currently trading below its all-time high. This matters because the NASDAQ is heavily weighted toward technology and growth-related stocks, including those linked to artificial intelligence (AI) — sectors that provided a significant portion of upside momentum throughout 2025.
Meanwhile, the E-mini Dow Jones Index Futures (YM) is trading above its prior all-time high. This is notable because the Dow has a more diversified sector composition and is less concentrated in high-growth technology names. Its relative strength suggests that current market resilience may be coming from areas outside of the technology complex.
Finally, the E-mini Russell 2000 Index Futures (RTY) remains below its all-time high. Small- and mid-cap stocks often act as a confirmation layer for broader economic participation. When large-cap indexes make new highs while small caps lag, it can signal uneven economic traction and rising internal imbalance.
This combination — ES and YM showing strength, while NQ and RTY lag — forms the foundation of the current intermarket tension.
Momentum Evidence: What MACD Is Revealing Across Indexes
Price alone rarely tells the full story near extremes. Momentum indicators, when used correctly, help evaluate the quality of participation behind price movement.
In this case, the MACD indicator reveals important divergences across multiple indexes.
The NQ is displaying a bearish momentum divergence, where price remains elevated but momentum fails to confirm. This suggests that upside participation is narrowing rather than expanding.
The YM — despite being one of the strongest indexes — is also showing a bearish divergence on MACD. This is particularly important because divergences forming in strong markets often precede broader shifts, not because price must reverse immediately, but because momentum strength is no longer accelerating.
The RTY presents the most advanced signal set. It is not only showing a bearish divergence, but also a MACD crossover, which can be interpreted as early-stage downside momentum attempting to assert itself.
The ES, while not currently exhibiting the same degree of momentum weakness, stands increasingly isolated. When leadership narrows to one index, risk becomes asymmetric rather than evenly distributed.
Structural Risk Zones: Interpreting UFO (UnFilled Orders) Support
Momentum divergences alone do not constitute actionable signals. They require structural confirmation.
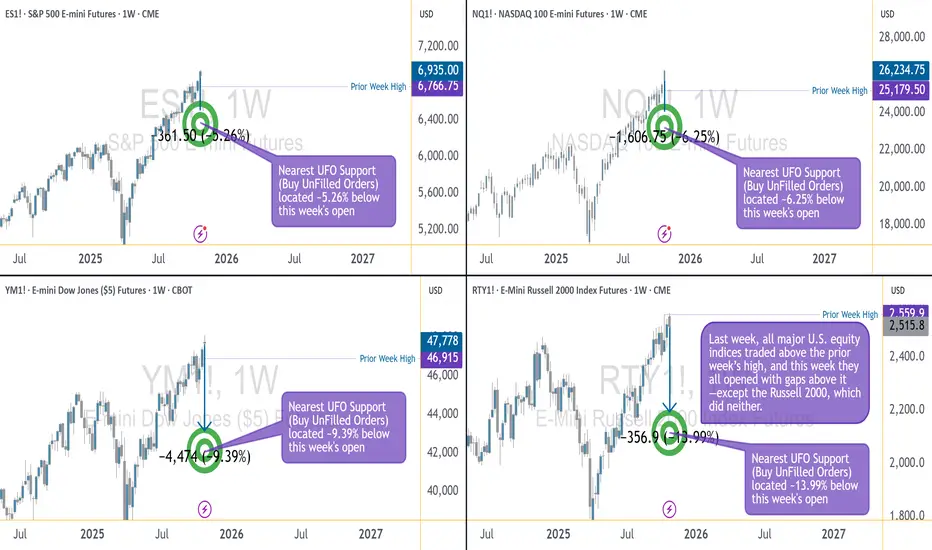
This is where UFO support and resistance levels (UnFilled Orders) become relevant. UFO zones represent areas where liquidity previously failed to transact fully, often acting as structural support or resistance when revisited.
In the current structure, two UFO support zones stand out due to their proximity to price and their relevance to both the strongest and weakest markets:
NQ: UFO support ending near 25,608.25
YM: UFO support ending near 48,127
These levels are significant because they sit directly beneath current price action. As long as price remains above these zones, structure remains intact despite momentum warnings.
However, a violation of such UFO supports would represent a meaningful shift. It would indicate that buyers previously willing to defend these levels are no longer present, allowing momentum divergences to express themselves more fully.
Conditional Scenarios: What Would Confirm a Broader Risk Shift
Rather than anticipating outcomes, evidence-based analysis focuses on conditions.
From a structural standpoint, bearish scenarios would gain credibility if:
NQ trades below 25,608.25, violating its nearby UFO support
YM trades below 48,127, removing structural support from the strongest index
Weakness emerging simultaneously in both the weakest and strongest indexes would suggest that divergence is resolving through price rather than consolidation. In such a case, broader downside expansion could develop, potentially manifesting as a sharp corrective phase.
Importantly, this framework does not assume that such a move must occur. It simply defines what conditions would matter if they do.
Illustrative Trade Framework (Educational Example Only)
For traders studying downside scenarios, a hypothetical bearish framework could be structured as follows:
Trigger: Confirmed daily close below relevant UFO support
Risk Definition: Invalidation above reclaimed structure
Objective: Next lower structural liquidity zone
Reward-to-Risk: Favorable only if structure breaks decisively
This framework is illustrative and intended solely to demonstrate how structure, momentum, and confirmation can align. It does not imply expectations or outcomes.
E-mini vs. Micro E-mini Contracts
All four equity index futures discussed — ES, NQ, YM, and RTY — are available in both E-mini and Micro E-mini formats. Both versions track the same underlying index and move tick-for-tick together. The difference lies in how risk is expressed.
ES / MES Tick size: 0.25 index points = $12.50 (ES) | $1.25 (MES)
NQ / MNQ Tick size: 0.25 index points = $5.00 (NQ) | $0.50 (MNQ)
YM / MYM Tick size: 1 index point = $5.00 (YM) | $0.50 (MYM)
RTY / M2K Tick size: 0.10 index points = $5.00 (RTY) | $0.50 (M2K)
Across all four indexes, Micro E-mini contracts represent one-tenth of the tick value of their E-mini counterparts.
Margin requirements vary by broker and market conditions. From a structural perspective:
ES / MES required margin = ~$22,500 (ES) | ~$2,250 (MES)
NQ / MNQ required margin = ~$33,500 (NQ) | ~$3,350 (MNQ)
YM / MYM required margin = ~$14,250 (YM) | ~$1,425 (MYM)
RTY / M2K required margin = ~$9,500 (RTY) | ~$950 (M2K)
This difference allows traders to express the same market thesis with far greater precision, especially when working around tight structural levels or conditional triggers.
With momentum divergences developing and key structural zones nearby, position sizing flexibility becomes critical. Micro E-mini contracts make it possible to:
Scale exposure gradually
Reduce concentration risk
Align risk more closely with invalidation levels
The analysis remains identical across E-minis and Micros — only the risk calibration changes.
Risk Management Considerations
Divergences can persist longer than expected, especially in strong trends. Acting without confirmation often leads to premature positioning.
Key principles include:
Waiting for structural validation
Defining risk before engaging
Managing exposure across correlated instruments
Avoiding overconfidence near historical extremes
Markets rarely turn because of opinion. They turn when structure and participation change.
Final Takeaway: Evidence Over Assumptions
As 2025 comes to a close, US equity index futures present a market that is strong on the surface but fractured underneath. Leadership is narrowing, momentum is diverging, and structural levels are increasingly relevant.
Whether these signals resolve through consolidation or correction remains unknown. What matters is that the evidence is now visible — and futures markets provide the clarity needed to observe it.
Data Consideration
When charting futures, the data provided could be delayed. Traders working with the ticker symbols discussed in this idea may prefer to use CME Group real-time data plan on TradingView: www.tradingview.com - This consideration is particularly important for shorter-term traders, whereas it may be less critical for those focused on longer-term trading strategies.
General Disclaimer
The trade ideas presented herein are solely for illustrative purposes forming a part of a case study intended to demonstrate key principles in risk management within the context of the specific market scenarios discussed. These ideas are not to be interpreted as investment recommendations or financial advice. They do not endorse or promote any specific trading strategies, financial products, or services. The information provided is based on data believed to be reliable; however, its accuracy or completeness cannot be guaranteed. Trading in financial markets involves risks, including the potential loss of principal. Each individual should conduct their own research and consult with professional financial advisors before making any investment decisions. The author or publisher of this content bears no responsibility for any actions taken based on the information provided or for any resultant financial or other losses.
Indexfutures
US2000 Momentum Rebuilds After Triangular MA Retest🚀 US2000 Bullish Setup – Triangular MA Pullback Play (Layered Entry Blueprint) 🚀
✨ Asset: US2000 – Small-Cap U.S. Index
📅 Trade Style: Day / Swing
🎯 Bias: Bullish Continuation confirmed through Triangular Moving Average Pullback
📌 Trade Plan – Clean & Clear
📈 Bullish Structure Confirmed
The price retest on the Triangular Moving Average shows buyers stepping in aggressively, signalling a strong continuation phase. This is where momentum traders and swing players gain the best advantage.
🧠 Thief Strategy – Layered Limit Entries (Multi-Order Method)
To manage volatility + trap liquidity like a pro, we use layered buy limits.
🔽 Buy Limit Layers (Flexible Based on Your Style):
2470
2480
2490
2500
(Feel free to add more layers based on your own capital, risk model, or spread environment.)
This layered technique helps you:
⚡ Catch deeper pullbacks
⚡ Reduce average entry cost
⚡ Beat market whipsaws
⚡ Accumulate position silently like a true OG
🛑 Stop Loss – Safety First
SL: 2450
Dear Ladies & Gentlemen (Thief OGs), adjust this SL as per your strategy, risk appetite, and volatility conditions.
This is not a forced SL — your account, your rules.
🎯 Target – Exit with Profits, Not with Ego
Our take-profit sits near:
TP: 2570
Why?
🔼 Moving averages above are acting as a strong dynamic resistance zone
🔼 Market nearing overbought territory
🔼 Potential bull trap zone, so escape elegantly with profits
Again, OGs — your TP is your own choice. Manage your bag with discipline.
📊 Market Psychology & Structure Insight
The US2000 typically reacts faster to sentiment compared to big indices like SPX or NASDAQ because small-caps absorb liquidity shocks quicker.
This bullish pullback presents a classic “buy the dip into MA” play — a favourite among swing traders.
🌐 Related Pairs To Watch (Correlation Keynotes)
💵 SP:SPX / AMEX:SPY (S&P 500)
Strong positive correlation
If SPX is bullish, US2000 usually follows with stronger momentum
Watch SPX’s 4H trend for confirmation
📈 NASDAQ:NDX / NASDAQ:QQQ (NASDAQ 100)
When tech rallies, small-caps often catch delayed momentum
A strong NASDAQ risk-on pulse boosts US2000 sentiment
📉 TVC:DXY (U.S. Dollar Index)
Inverse correlation
Weak DXY boosts equities (US2000 included)
If DXY drops, small-cap indices often pump harder
TVC:VIX (Volatility Index)
Direct risk-sentiment indicator
Falling VIX = bullish for US2000
Rising VIX = be cautious with new entries
💼 TVC:DJI (Dow Jones)
Large caps lead in stability
When Dow is stable/bullish → risk-on spillover increases small-cap flows
📝 Final Thought
This setup suits traders who love structured pullbacks, clean MA-based momentum, and layered entries. Manage risk, scale smart, and take profit with intention — not emotion.

When Generals Run and Soldiers Nap — The Market’s Odd ParadeEver seen an army march where the generals sprint ahead, but the soldiers just yawn and stay behind?
That’s exactly what’s happening in the U.S. futures battlefield right now.
The ES, NQ, and YM — our large-cap “generals” — opened the week above their prior highs, looking ready for victory speeches. But the RTY, representing small caps, is still lagging like it hit the snooze button.
The Breadth Problem
Healthy rallies need everyone on board. When small caps don’t join the charge, it’s like running a marathon with only one leg — you might move forward, but not for long.
That’s why this gap between the big guys and the small ones is called bearish divergence — momentum without muscle.
How Deep Could It Go?
Under the surface, liquidity pockets (UFO supports) show the “landing zones” below price:
ES: ~5% lower
NQ: ~6% lower
YM: ~9% lower
RTY: ~14% lower (!)
Translation: if the market trips, the generals may bruise a knee — but the soldiers could roll down the hill.
Tick, Margin, and Scale
CME index futures come in two flavors — E-minis for the pros, Micro E-minis for precision control:
S&P 500 (ES/MES): tick 0.25 → $12.50 / $1.25; margin ≈ $21K / $2.1K
Nasdaq 100 (NQ/MNQ): tick 0.25 → $5 / $0.50; margin ≈ $30K / $3K
Dow Jones (YM/MYM): tick 1 → $5 / $0.50; margin ≈ $13K / $1.3K
Russell 2000 (RTY/M2K): tick 0.10 → $5 / $0.50; margin ≈ $9K / $0.9K
(Approximate numbers, educational only.)
The Lesson
Breadth divergences don’t “predict” the end of the rally — they just whisper: “Careful, this parade’s out of sync.”
So before chasing the next breakout, remember:
even the best generals can’t win a war if their soldiers stay in camp.
Want More Depth?
If you’d like to go deeper into the building blocks of trading, check out our From Mystery to Mastery trilogy, three cornerstone articles that complement this one:
🔗 From Mystery to Mastery: Trading Essentials
🔗 From Mystery to Mastery: Futures Explained
🔗 From Mystery to Mastery: Options Explained
When charting futures, the data provided could be delayed. Traders working with the ticker symbols discussed in this idea may prefer to use CME Group real-time data plan on TradingView: www.tradingview.com - This consideration is particularly important for shorter-term traders, whereas it may be less critical for those focused on longer-term trading strategies.
General Disclaimer:
The trade ideas presented herein are solely for illustrative purposes forming a part of a case study intended to demonstrate key principles in risk management within the context of the specific market scenarios discussed. These ideas are not to be interpreted as investment recommendations or financial advice. They do not endorse or promote any specific trading strategies, financial products, or services. The information provided is based on data believed to be reliable; however, its accuracy or completeness cannot be guaranteed. Trading in financial markets involves risks, including the potential loss of principal. Each individual should conduct their own research and consult with professional financial advisors before making any investment decisions. The author or publisher of this content bears no responsibility for any actions taken based on the information provided or for any resultant financial or other losses.
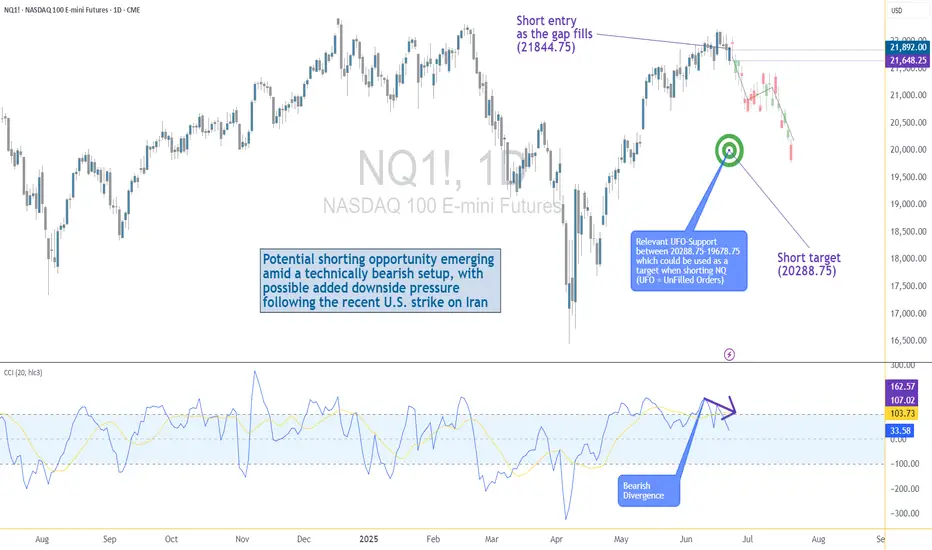
US–Iran Conflict Triggers a Potential Nasdaq Bearish Setup🟣 Geopolitical Flashpoint Meets Technical Confluence
The U.S. weekend airstrike on Iranian nuclear facilities has reignited geopolitical instability across the Middle East. While broader markets often absorb news cycles quickly, high-beta assets like Nasdaq futures (NQ) tend to react more dramatically—especially when uncertainty meets existing technical vulnerability.
Monday’s session opened with a notable gap to the downside, reflecting immediate risk-off sentiment among futures traders. While the initial drop is being retraced intraday, historical patterns suggest that such gap-fills can often serve as ideal shorting zones—particularly when other bearish signals confirm the narrative. The backdrop is clear: this is no ordinary Monday open.
🟣 Bearish Divergence on CCI Builds the Case
From a technical standpoint, the setup gains weight through a clear bearish divergence on the Commodity Channel Index (CCI) using a 20-period setting. While prices recently pushed higher, momentum failed to follow—an early indication that buyers may be running out of steam. This divergence appears just as price approaches the origin of Friday’s gap, a level that frequently acts as a resistance magnet in such contexts. This confluence of weakening momentum and overhead supply aligns perfectly with the geopolitical catalyst, offering traders a compelling argument for a potential reversal in the short term.
🟣 Gap Origin: The Line in the Sand
The origin of the gap sits at 21844.75, a price level now acting as potential resistance. As the market attempts to climb back toward this zone, the likelihood of encountering institutional selling pressure increases. Gap origins often represent unfinished business—zones where prior bullish control was suddenly interrupted. In this case, the added layer of global tension only strengthens the conviction that sellers may look to reassert dominance here. If price action stalls or rejects at this zone, it could become the pivot point for a swift move lower, especially with bearish momentum already flashing caution signals.
🟣 Trade Plan and Reward-to-Risk Breakdown
A potential short trade could be structured using 21844.75 as the entry point—precisely at the gap origin. A conservative stop placement would rest just above the most recent swing high at 22222.00, offering protection against a temporary squeeze. The downside target aligns with a prior UFO support area near 20288.75, where demand previously showed presence. This sets up a risk of 377.25 points versus a potential reward of 1556.00 points, resulting in a reward-to-risk ratio of 4.12:1. For traders seeking asymmetrical opportunity, this ratio stands out as a strong incentive to engage with discipline.
🟣 Futures Specs: Know What You’re Trading
Traders should be aware of contract specifics before engaging. The E-mini Nasdaq-100 Futures (NQ) represent $20 per point, with a minimum tick of 0.25 worth $5.00. Typical margin requirements hover around $31,000, depending on the broker.
For smaller accounts, the Micro Nasdaq-100 Futures (MNQ) offer 1/10th the exposure. Each point is worth $2, with a $0.50 tick value and much lower margins near $3,100.
🟣 Discipline First: Why Risk Management Matters
Volatility driven by geopolitical events can deliver fast gains—but just as easily, fast losses. That’s why stop-loss orders are non-negotiable. Without one, traders expose themselves to unlimited downside, especially in leveraged instruments like futures. Equally critical is the precision of entry and exit levels. Acting too early or too late—even by a few points—can compromise an otherwise solid trade. Always size positions according to your account, and never let emotion override logic. Risk management isn’t a side-note—it’s the foundation that separates professionals from those who simply speculate.
When charting futures, the data provided could be delayed. Traders working with the ticker symbols discussed in this idea may prefer to use CME Group real-time data plan on TradingView: www.tradingview.com - This consideration is particularly important for shorter-term traders, whereas it may be less critical for those focused on longer-term trading strategies.
General Disclaimer:
The trade ideas presented herein are solely for illustrative purposes forming a part of a case study intended to demonstrate key principles in risk management within the context of the specific market scenarios discussed. These ideas are not to be interpreted as investment recommendations or financial advice. They do not endorse or promote any specific trading strategies, financial products, or services. The information provided is based on data believed to be reliable; however, its accuracy or completeness cannot be guaranteed. Trading in financial markets involves risks, including the potential loss of principal. Each individual should conduct their own research and consult with professional financial advisors before making any investment decisions. The author or publisher of this content bears no responsibility for any actions taken based on the information provided or for any resultant financial or other losses.
"US30 Heist Alert: Thief Style's Bullish Plan to Steal Profits!"🌟 Salut! Ciao! Hola! Konnichiwa! 🌟
Dear Wealth Raiders & Market Bandits, 🤑💰✈️
Here’s our slick *Thief Trading Style* heist plan for the **US30 / Dow Jones Industrial Average Cash** Index, crafted with sharp technicals and fundamentals. 💥 Stick to the chart’s long entry strategy and aim to slip out near the spicy Yellow ATR Zone—a risky, overbought level where bears and traps lurk. 🏆💸 *Grab profits and treat yourself, you’ve earned it!* 💪🎉
**Entry 📈**: The heist kicks off! Watch for a breakout above the MA line (42600.0) to jump in—bullish riches await! 🤑 Set *buy stop orders* above the MA or *buy limit orders* near the most recent 15/30-min swing low/high for pullback entries. 🚨 Set an *alert* to catch the breakout signal!
**Stop Loss 🛑**: Yo, thieves, listen up! 🗣️ For buy stop orders, hold off on placing that stop loss until the breakout confirms. 🔊 Place it at the 8H recent/swing low (40850.0) for day/swing trades. Adjust SL based on your risk, lot size, and number of orders. Play it smart, or it’s your loot on the line! ⚠️🔥
**Target 🎯**: Aim for 44500.0 or bail before the target hits. 🏴☠️
**Scalpers, eyes here 👀**: Stick to long-side scalps. Big bankrolls can dive in; smaller ones, join the swing trade heist. Use *trailing SL* to lock in your haul. 💰
💸 **US30 Market Heist Outlook**: The index is neutral but leaning bullish, fueled by key drivers. ☝ Check the fundamentals, macroeconomics, COT reports, geopolitics, sentiment, intermarket analysis, and future trend targets for the full score. 🌎🔗
⚠️ **Trading Alert: News & Position Management** 📰🚫
News can shake the market hard. To protect your loot:
- Skip new trades during news releases.
- Use trailing stop-loss orders to secure running profits.
💖 Boost our heist plan! 🚀 Hit that *Boost Button* to power up our robbery squad. With *Thief Trading Style*, we’re snatching profits daily. 🏆🤝 Stay sharp for the next heist plan! 🤑🐱👤🤩
---
### Latest Real-Time Data (UTC+1, May 16, 2025) 📊
*Data sourced from reliable platforms like Financial Juice and official market feeds.*
**Indices** 📈
- US30 (Dow Jones): 42580.0 | +0.18% 😊
- S&P 500: 5720.5 | +0.12% 😄
- NASDAQ 100: 20150.2 | +0.25% 😊
- FTSE 100: 8250.3 | -0.05% 😐
---
### Latest COT Data (Updated Friday, May 9, 2025) 📑
*Commitment of Traders (COT) report for US30/Dow Jones futures, sourced from CFTC.*
- **Non-Commercial (Speculators)**:
- Long: 45,200 contracts | +2,500 😄
- Short: 38,900 contracts | -1,200 😊
- Net Position: +6,300 (Bullish bias) 🟢
- **Commercial (Hedgers)**:
- Long: 82,500 contracts | -1,000 😐
- Short: 90,700 contracts | +800 😐
- Net Position: -8,200 (Bearish hedge) 🔴
- **Open Interest**: 165,400 contracts | +1,200 😊
- **Key Insight**: Speculators are increasing bullish bets, while hedgers lean bearish, signaling potential volatility near resistance levels like the Yellow ATR Zone. ⚠️
---
💥 Join the *Thief Trading* crew, boost the plan, and let’s raid the markets together! 🤑🚀

HK50 Heist Alert: Snatch the Bullish Loot & Escape the Red Zone!🌎 Greetings, global fortune hunters! Bonjour, Shalom, Salut, Hola! 🌟
Dear Cash Commanders & Market Marauders, 💰⚡️
Forged in the 🔥 Rogue Trader’s crucible of technical and fundamental sorcery 🔥, here’s our sly scheme to plunder the HK50 “HongKong50” Index Market. Stick to the chart’s blueprint, homing in on long entries. Our endgame? Sneak out near the perilous ATR Red Zone, where overbought signals, consolidation, trend reversals, and traps await, with bearish outlaws ready to pounce. 🏴☠️💸 “Lock in profits and spoil yourself, traders—you’re unstoppable!” 🎉💥
**Entry 📈**: The safe’s wide open! Grab the bullish treasure at any price—the raid’s in motion!
For sharper moves, place buy limit orders on a 15 or 30-minute chart at the most recent swing low or high. Hot tip: set chart alerts to stay one step ahead!
**Stop Loss 🛑**:
📍 Rogue SL anchored at the recent swing low on the 4H timeframe (22700.00) for day or swing trades.
📍 Adjust SL based on your risk tolerance, lot size, and number of open orders.
**Target 🎯**: Aim for 24700.00—or slip away early if the market turns dicey!
🧲 **Scalpers, stay sharp!** 👀: Focus on long-side scalps only. Big bankroll? Jump in now! Smaller stack? Team up with swing traders for the heist. Use trailing SL to guard your gold 💰.
💵 **HK50 Market Heist (Swing Trade Breakdown)**: Sitting in a neutral zone with a bullish spark, driven by key market currents. ☝
🗞️ **Dig into the details**: Explore Fundamental Insights, Macroeconomic Trends, COT Reports, Geopolitical Shifts, Sentiment Signals, Intermarket Connections, Index-Specific Factors, Positioning, and Future Targets for the full picture! 👉🔗🌍
⚠️ **Trading Alert: News & Position Tactics** 📰🚨
News events can rattle markets like a tempest. To protect your profits:
- Steer clear of new trades during news releases.
- Deploy trailing stop-losses to secure gains and shield open positions.
💖 **Power up our raid!** 💥 Tap the Boost Button 💥 to amplify our profit-snatching prowess. Join the Rogue Trading Style posse and rake in riches daily with finesse. 🏆🤝🚀
See you at the next market ambush—stay vigilant! 🤑🐱👤🎯

Russell continues downhillThe Russell 2000 small-cap index having failed to maintain support at 1968, a short futures position might be worth adding to. We wouldn't start one here, though.

Dow bull not yet ragingSomebody whispered "new bull market!" into our ear overnight. Bull or no, we think DJIA futures have a bit further to pull back from recent overbought levels before the stampede begins in earnest.
Traders who agree can either short the September Dow futures, as here, or pick up some AMEX:DOG or $SDOW.

NAS100 Outlook 2/12I see reasons for indices to continue to appreciate. Looking to take out a significant HTF high before my bias switches bearish . CPI on tuesday. will be trading after that occurs.

NAS Outlook 1/22Bearish on indices, looking to see if last week's high holds. watching intraday for trade opportunities.

NAS100 Outlook 1/15Looking for indices to fall early and give a good entry for longs, to then chase the buyside.

US500 Outlook 1/15Looking for indices to fall early and give a good entry for longs, to then chase the
buyside.

US500 Outlook 1/8Seeing potential weakness across the indices. expecting it to trade a bit higher however. See NAS idea for further analysis.

NAS Outlook 1/85 minutes ago Seeing reasons for NAS to go down this week, however, this is at odds with DXY and the two are usually somewhat inversely correlated. Will be seeing what opportunities actually present, but this is what i see at the present moment. Slow news week till thursday so dont be surprised by a mon-wed consolidation/liquidity range building following friday's expansion.

US30 Outlook 1/8Seeing weakness in the indices, looking for price to continue upwards to fill efficiencies before the potential reversal. Slow news week, not expecting anything major before thursday.

$SPX - Reversal comin next quarter.... Maybe. At..3250?Above is the monthly
The biggest thing I see After my analysis is the possibility of it getting down to the support level of the breaker that formed at the beginning of the pandemic. It has bounced off current breakers but has yet to close abnove a brreak of structure leading m,e to beleive it will find the lowest pointy at thast pandemic high breakers candle low price of 3280 (ish) before we see a bullish movement again or even a break of structure. I think this quarter (what's left of iot) and next quarter is going to be tough.
Below is the Daily
It's the secoind quarter nexxt year that's going to be the true test in my opinion. But this is my take on the trusty Standard and poor. just by logive and reasoning. Trendlines are phantoms, price will brersk through those without thin kking about trendlines because price doesn't know what it is, but it does remember price points, so the low of the High pandemic breaker I think will be the last or first quarters low point. We'll have 90 from there to make a good swing high.
The daily briefly breaks structure but immediately closes bnelow structure righjt after. This just has slow growth written on it for at least 6-8 weeks.
OANDA:SPX500USD
CME_MINI:ES1!
FINRA:NANO_SHORT_VOLUME
CBOE:NANOS
CME_MINI:ES1!
\ CME_MINI:ESG1!


Nasdaq bearish tonePrice of Nasdaq in 2021 was the powerhouse and create a lot of wealth. We see that price has started to decline from the top of 16,500. A potentially renounce could happen around 14,400 before coming down lower to 13,500
We are in the view of overall bearish sentiment in Nasdaq

HSI To be Strong in the next 6 monthsHSI has start to bottom up showing that confidence in Hong Kong market has start to show in the current market.
Price has broken up above box to show that immediate target to be 25,600.
We should expect price continue to consolidate along 23,000 - 26,400 and eventually start to go back up to 30,000 in the next 6-8 months time.
This favours heavily sold stock in China especially those blue chips and poise a strong recovery in the months to come.
We have an initial target at 28,000 - 29,000

nifty technical analysis looking strong 21-01-22technical analysis of nifty for monday.....trading with physiology ......

M2K set up for a super rare 4:1 R:R and possible crash!The Russell Micro is set up with a SUPER rare short opportunity here and possible crash. The 4H has made its third trend lower is under it's VWAP from highs and has put in a doji on the lows. The trade here is a pullback to 2065.5 with a stop at 2085.5 target at 1980 giving a 1:4 risk to reward ratio. I haven't seen a short setup like this in US equities in a VERY long time... as in, August 2008.

By May 24, 2021 it's all over! US (world) Index final collapseThis is the Dow Industrial Average - Weekly. (Price & Time)
This is only a 2-D Time Slice of a high(er) dimensional wave analysis (see - attachment), with standard Price projection onto the Time axes. (Will add the rest as time allows.)

us100Hello traders, here is the analysis from our team :
sell: 11098
target #1 11095
Target: 11085
Stop : 11111
Money management : 11095
Part #1 of spread trade.
Let us know in the comment section below if you have any questions.😉
