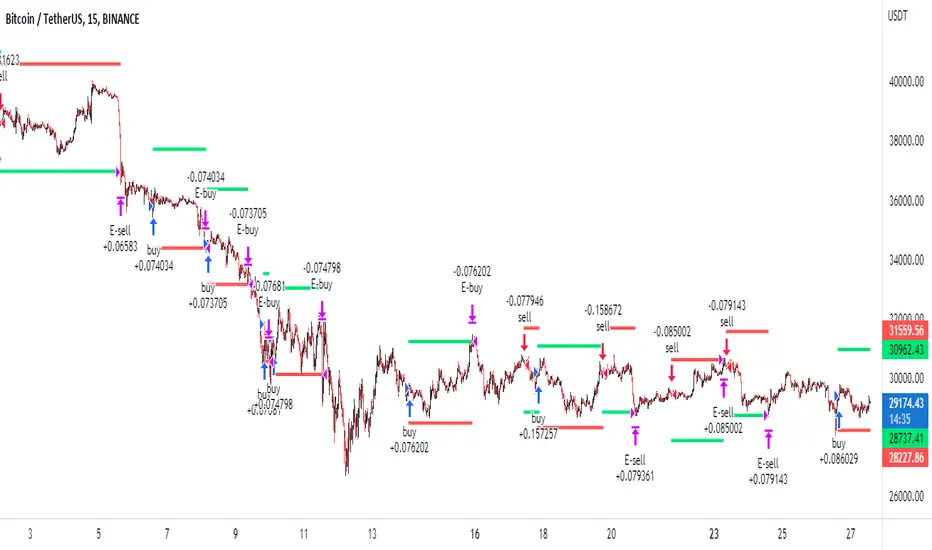
Strategy Development: Price Levels & Time ProcessingI’m currently working on a trading script designed to identify optimal stop-loss and take-profit levels based on market structure and volatility.
Day TF
Short entry: $101,460.15 with a stop-loss at $105,330.08
TP levels tested down to $82,110
Despite it played out ok I still need additional validation that will come with time. Point is to keep enhancing the script so most of the time price does not pass 5th take profit considering latest periods between consecutive Long & Short signals.
3H TF
Alternatively, I picked different timeframe for another layer of performance evaluation from another perspective.
Long entry: $84,201.84 with a stop-loss at $82,967.61
TP levels tested up to $90,372.97
Blue TP means the closing price reached the level, while gray - did not.
⏱ TIMING
Many traders focus on price levels but overlook the time duration between long and short signals. However, understanding how long trends last is just as crucial as knowing where price might go.
Why does this matter?
If your strategy enters a long trade too soon after a short trade, you might be catching a dead-cat bounce rather than a real reversal.
If your signals occur too frequently, the system may be overreacting to market noise rather than identifying meaningful trend shifts.
Tracking the duration of trend phases helps you align with market cycles rather than getting whipsawed by short-term fluctuations.
The results will be viewed carefully and will be used to improve the logic (code-wise) for better trend detection; stop-loss placements to avoid unnecessary stop-outs; refined entry timing.
The end goal is to make the strategy learn from both aspects of past data - price and time to completely eliminate a need for any user inputs.
Please, let me know:
How you incorporate time-based analysis (other than fixed cycles) into your trading.
If you would want this strategy available for public.
Indicator-strategy

How I made 6/1 on MA this morningI use the same strategy every morning to make money. No emotions involved. The risk to reward was 6/1.

LONG Strategy I Use With The Logical Trading Indicator V.1In this post I want to explain how I use the Logical Trading Indicator V.1 that I published as a community script here on TradingView. The following strategy is what I use on a daily basis with a number of different assets, primarily crypto and FOREX, but can work with just about any asset with a chart.
This post is not specific to one particular timeframe, but I made the chart on the 1HR as that is the timeframe that the default settings were keyed in on. It is based on a LONG strategy. A SHORT trade would be just the opposite, which I will also make a post about as well.
When I sit down to the charts, I set my alerts so the indicator tells me when to trade so that I can go about my day and make my moves with the alerts hit. This keeps me with a mechanical strategy that I can use to help keep my emotions out of the trade.
Steps I take to prepare for a LONG trade:
STEP 1: Set alert and watch for a bullish cross of the basis line. This indicates that the trend is changing and to be on the lookout for momentum change as well as the BUY signal.
STEP 2: Set alert and watch for the next BUY signal. This happens when the price is above the basis line and the ATR meets the multiple set in the settings. So by default it is set to 2x multiple. So when the price jumps 2x the ATR figure, that means we are getting some serious bullish momentum and it is time to enter a long trade.
STEP 3: Although this indicator works on a trailing stop loss strategy, it's always good risk management practices to set what I call an emergency stop loss. This protects your capital in-case everything just goes wrong. I set my emergency stop loss inside or just to the outside of the lower bollinger band range. This gives your trade room to move and go in the direction that it is indicating, but protects you incase the market turns quickly and you aren't paying attention.
STEP 4: Set alert and watch for Take Profit signals. This happens when the price closes inside the upper bollinger band range, which also indicates an 'overbought' range similar to an RSI. The signal fires when the next candle closes below the band. This let's you know the momentum has changed and it could be a great time to take at least 50% or more of your position off the table.
STEP 5: Set alert and watch for a bearish cross of the basis line. This indicates that the trend is starting to change and is when I usually close out the rest of the trade.
STEP 6: You can set an alert to let you know when the SELL signal fires. This is the absolute LAST chance to get out in profit. This is the trailing stop loss signal that is built into the indicator. With my particular strategy, I am usually out of the trade at this point, but if I didn't get a chance to do anything when I got the bearish basic cross, I am definitely closing everything out when I see that SELL signal. This is also when you could be looking into flipping bearish and taking a SHORT trade, then it's just the opposite.
I hope this helps answer some questions that people might have about how to use the Logical Trading Indicator V.1!

How to Trade the Markets - Step 1 - Creating a LifelineHello,
In this video series i will be walking you through my new approach on how i am currently trading the markets.
Step 1 - Creating a Lifeline
We need to create a lifeline that factors no more than 2% on a stop loss playing the current daily candle. I will show you how to enter and factor in a stop loss for security in your capital.

Pure trendline breakout strategy; Manticore Investems
Pure trendline break strategy is based on indicators:
Tradelines with Breaks (FREE) - TwB
Position entry signals, trendline breakout. We look for signals on the ~h4 interval.
We take a position on lower intervals when we see entry signals there as well.
Order block Detector (FREE) - ObD
Generates us support and resistance for the price (red - sell, green - buy)
Pivot Based Trailing Maxima & Minima (FREE) - Pbt
Helps determine the current trend of the market on a given interval, serves as an add-on
informing us about market trends. In the green zone - buy, red - sell.
SuperOSC (FREE) - sOSC
Informs us about the strength of the market at a given moment (on a specific candle)
In addition:
LuxAlgo Price Action Concept (PREMIUM).
Strategy description:
Basically we trade after large signals generated on h4/d1 intervals.
When we take a position we look for the optimal place to enter from m15-h1.
We use resistances and supports as SL/TPs.
Trading style: scalping / daytrading.
Ideal entry setup:
1) Signal generated on the h4/d1 TwB interval.
2) ObD secure our position / ObD do not interfere with a potential sell or buy
3) The trend set by Pbt agrees with the direction we are playing. (Green zone - buy / Red zone - sell).
4) The candle after which we enter is not drawn on the sOSC
Examples below:
H4 interval buy signal:
1) Pbt - Green buy zone
2) TwB - upward signal
3) sOSC - the candle that generated the buy signal did not cross the dashed lines
When we take a position we go down to lower intervals to best estimate SL:TP
H1 interval:
H1 interval buy signal:
1) Pbt - Green buy zone
2) TwB - upward signal
3) sOSC - the candle that generated the buy signal did not cross the dashed lines
Estimation of risk and timing of exit:
Risk estimation:
1) We use ObD to determine the optimal risk, they serve as resistance to the price.
2) We set positions below the buy / sell zones from Pbt
3) We go to lower intervals, set SL under the TwB level of the opposite trendline
Determining take profit:
1) We play out positions to supports or resistances generated by ObD
2) We close the position when we see that after the close of the h4/h1 candle the sOSC is drawn above or below the dashed line
3) We can close positions when we see that the movement is losing strength and there are opposition signals to our position on low intervals.
It works best to close positions after reaching ObD supports/resistances in conjunction with a drawn-out sOSC.
LuxAlgo Price Action Concept indicator (PREMIUM), serves as an aid in determining the strength of a given support or resistance (the higher the %, the stronger the resistance)

Sniper & Strategy Update with Sine Version 5 by TradcityproSniperTrading permite detectar los momentos exactos de compra y venta obteniendo un buen rendimiento.
Como aplicarlo:
* Realice una compra cuando el indicador de COMPRA aparezca en la pantalla.
* Realice una venta cuando el indicador de VENTA aparezca en la pantalla.
More Info:
www.youtube.com

How to use EMA8 and EMA89 in your trading.Here I have shown how the EMA8 and EMA89 can lead to good results by using the EMA89 as a baseline and applying the rule, buys above the average and sells below. To find entries look for pullbacks to the average of breakdown and breakout of order blocks, things like inside bar to find momentum should also find results, you could experiment with oscillators in order to find these pullbacks easier. However most of the entries will usually give some good price action and this is important to keep an eye when using this strategy, you want likely reversals so use candles to enter that typically have a higher % chance of changing direction, things like engulfing candles and pinbars, not only will this keep the risk low, it will enable better rewards and consistency. Hope someone out there can find some use of this post :)

NNDM possible profit strategyBuy shares strategy -
Dip Buy NNDM at $2.98 yellow 8 EMA LINE
RISK 5% -> Stop Loss $2.91
TARGET 1 Reward: 10.4% Sell $3.29
TARGET 2 Reward: 13.4% Sell $3.38
________________________________________________________________________________________________________________
In order for NNDM to make a serious move north, bullish volume needs to kick in. Volume holds the weight of price up, it validates price. Here i am using several variables to justify a possible buy. This is a day chart. I am using the EXTENDED FIBONACCI RETRACEMENT to acquire my target lines.
What I Like -
*The candlestick formations; there is a push to break prior support/now resistance at $3.06. (yellow horizontal line) Notice how many times $3.06 was opened or touched in the past, going back to Jan 24, 2022, Feb 24, mar 8th, 14th 15th, and so forth...VERY IMPORTANT PRICE for NNDM. Now, with the 8ema and the red 34ema, the candles are using those as a springboard to push north. That's why bullish volume is so important to accomplish that.
*RSI is trending somewhat bullish; at a value of 57, the RSI, being a momentum indicator, suggests more room for running north
*8 EMA AND 34 EMA; The 8 ema has just crossed north over the 34 ema, suggesting that this stock price is ready to move bullish. Finding these crosses can be parabolic bullish moves!
What I Don't Like -
*Stochastic indicator is quite Overbought; While some investors suggest using the Stochastic as an overbought/oversold indicator, others suggest using it as a momentum indicator. The ideal stochastic indication would be both the RSI and Stochastic at the bottom of their respected graph moving upwards, suggesting an overall SENTIMENT that the bullish move is underway.
*VOLUME is not ideal; as stated above, we need more volume to come in
*Let's see what happens*
DISCLAIMER - I am not a professional trader. These are merely my thoughts and possible moves; i enjoy watching these stocks validate my process or slap me across the face lol. If you are in need of professional assistance with your trades, don't look here. I am not that guy.

TRADE USING AXE STRATEGY In this idea, we are using AXE strategy.
What is AXE Strategy?
Axe is an algotrading strategy developed by our professional trading experts and programming team. This strategy is based on how buyers and sellers behave in the market.
The high win-rate of this strategy makes us confident that it will be used by many high-profile traders all around the globe.
Visit our website for more information and how to access to AXE Strategy.
High Accuracy VIX trading strategyThis is a strategy that uses a strategy that normally sucks with range markets, which by inverting the conditions, makes a highly profitable strategy.
Leave feedback for me!
Keep in mind that the source code that I used is just an edit of someone else's. The strategy itself is not specifically associated with the code used, and was just meant to give a visual of the strategy.
This is not financial advice.

BTC STrategy with 3 signals divergences and 30 minutes chartHere is an exemple of my best strategy at the moment.
Work on every pairs i try.
Perfect on 30' chart.
The Rulls:
1- First RED/ Green Big point
2- Bear or Bull signal (In the same indicator)
3- D and divergence (Green or Red) with torys rsi
4- VMC Dot Red or Green
All of them need to be align.
Take the position with the stop limit at the last (Highest / Lowest price) depend on long or short
Risk reward x3 if align not perfect and x5 if aligne perfect.
Enjoy.
Tell me if you succes with it.

Script Addon - Stepped TP with trailing TPThis is a proof of concept for a Trading View Script Addon for stepped and trailing Take Profit levels. A great risk management tool.
It will give you 3 TakeProfit levels and one StopLoss that will rise as TP targets are hit. You can set the TP levels as % of the price as is common for many trading tools. The additional trailing for the third TP level is an extra that will give your strategy a little advantage when there are big moves in the price action.
This is not giving you better entries, just moderating your exits.
With this addon you can make more out of your entries, while not having to get stuck in it with your full position.
This works best in sideways markets, but due to the trailing addon it can profit from bigger moves as well.
Let me know if you want this added to your strategy or indicator.
Cheers,
Robert

How to Trade & Sell Options?-Take a look into this short post on options trading and get the basic essentials you need to form an idea of how things work in options market.

EURAUD LONGHi guys!
According to the strategy ( check my script page for more info) a new sell signal arrived on AUD.
The most opposite coin is EUR, the one to buy.
So, long on EURAUD, SL 5 times ATR20
TP1 EMA50
TP2 EMA 100
Enjoy your wallet!
Tari.

GBPUSD LONGHi guys!
According to the strategy (you can find it on my scrpit page), a GBP buy signal arrived. The most opposite caoin is USD, SL is 5 times ATR20, TP1 and Tp2 EMA50 and EMA100.
Enjoy your wallet!
Tari.

Nifty Futures Positional Trade SetupI recently published a linear regression Channel breakout Screener. This is a mix with RSI crossovers i.e when price closes above the midline and RSI crosses over 60 and vice versa!
Few other Linear Regression ideas also discussed in the screener write up , check them out!

ETH: Losing Momentum, What do I see.ETH has traded inside a small bullish trend over the past few days establishing higher highs/lows. ETH continues to trade in this pattern however has lost momentum facing the upper bound of the 2000-2200 resistance zone.
Analysis: ETH is beginning to enter a critical point in its cycle where a major movement is likely. First, we see that price overall has been setting lower highs. Second, while the 1700-1500 support zone has held it has been tested 3 times now with strong impulses to drive the price up. These conditions favor some sort of large-scale move either downward breaking the 1.7-1.5k support zone or upward to test 2400, and 2800 resistance zone.
What do I see?
As ETH is in a minor bull trend and as such we can expect the price to continue to rise. However, there are indications of a reversal. These being testing 2200 resistance and an overall bearish environment. As such I am waiting to see ETH break out of 2200 and then 2400 to suggest a large-scale bullish movement. or for eth to be rejected and look for setups again inside the support zone.
Best of luck, Like/Follow for more.

ETH - Panic? Confidence? What Next/Strategy Recently ETH has exited its bull trend and made a minor pull back into the 2200-2200 support zone. Currently, ETH trades inside a horizontal with support at 2075 and resistance at 2200.
What's next? Given the conditions, there is a lot of negative momentum surrounding ETH at the moment. A. price has broken below one of the set lows in the bull trend (2200) B. Price most recently was bearish until finding support around 2075.
Strategy: 2000 and 2200 are absolutely critical in this position. As such I am looking at 2 things. 1, Price to break below 2000 both a previously tested low and a low in the bull trend. in which I will look to buy around 1500-1700. 2, for price to break above 2200 with at least a solid 4h candle. In this position, targets would be 2300 then 2600, and 2800.
Best of Luck, Like/Follow For More.

ETH in rough waters? What do I see. ETH has broken out of its previous horizontal channel breaking the 2200 - 2000 support zone and driving price as low as 1700.
However, the bears have broken and support was found at 1700 allowing a minor reversal to test the now 2000-2200 resistance level.
What do I see? well in a micro perspective we can see that there was both a reversal at the 1700 and a rejection at the 2000 as such we can see a slight horizontal channel forming in the range of 1700-2000 as price was not able to break above or below these numbers when tested.
I will look for buy setups on 2 conditions. A. price to break with a full daily candle over the 2000 indicating a possible bull trend reversal. B. when price tests the support range of 1700-1500 likely with other confirming factors such as low RSI, MACD, etc. in this position I would likely look for a short-term buy as price gathers support for a potential retest.
Best of luck, follow for more.

EURGBP For Scalpers Hi,
Welcome to our Analysis, we are on the 2H chart of EURGBP
Senko B Line acting as a Support
0.382 FIB retracement Acting as a Support
50 EMA acting as a Support in 30 min Time frame
Short Time Scalping
For Scalpers

CAKE, divergence and explaination on where it would goCAKE's price is going up but the volume is low, this indicates a divergent situation. RSI is overpriced, this could be a phenomenon called power zone, where the price will keep going up due to retail's excitement. so, based on my analysis the price will keep going up until $46-47 and then going down to the trend line i draw. im using snr and trend line drawings, and i use RSI and Volume indicator for this analysis. i hope my analysis could help you to make your decision, best of luck to y'all

Macro strategy based on RSI and Alt Dominance on BTCUSDTHi traders,
There's been a lot of discussion about RSI and overbought/oversold levels. Very little testing and data though. Though it might be interesting to show this strategy that runs on high timeframes, has as much profit as buy-&-hold at half the drawdown. It's on BINANCE:BTCUSDT
This experiment started when we started testing clasic RSI strategies: buy when it's below 30 and sell when it's above 70. It was a profitable strategy but could not touch buy-&-hold in the past year with +330%. In fact the classic RSI strategy on the daily would have brought you "only" +74.1% on the 1D chart.
The reason? In an ascending market high RSI is a measure of intesity of the move rather than the deliminator of a level. So high RSI is good. Remember in 2017 RSI topped out at 95+ only. Selling at 70 would have been a mistake.
So the idea was to take RSI as a measure of intensity and try and come up with a strategy that:
- has us in a position most of the time
- when the top nears it takes us out & quickly catches the dip
- has a limited dropdown, up to 10%
- as always is simple to extecute
- can compete with buy-&-hold in results
The strategy: for the past year the experiment lead to this strategy that yields close to what buy-&-hold does and we noticed it warning of topping out before 11.1. It returned +334.55% in the last year.
We open a position when: RSI is above 50
We close a position when: RSI is above 85 AND Alts Dominance is up by 3% in the last day
No stop loss or take profit - only market based conditions
Why does this strategy work? It seeks out a bull market and is looking to be in a positon as much as possible. By using Alts Dominance in the close condition we see that we are in the last phase of the Money Flow Cycle and altcoins might be outperforming Bitcoin in the next period. Should the bounce for Bitcoin be fast we are at ready to jump back into the market.
Currently we are in a position that oppened on the 11th at the dip. I will update here on how it progresses. This is all on spot.

TradingView - Pullback Strategy with 89% Winning Rate Hey Guys,
I would like to show you my Pullback Strategy. As you can see below, the winning rate is 89% which is pretty good. I realized that the best market for this strategy is the index market, like DAX , NASDAQ, S&P500 etc.
I have not so much experience with backtesting results. Therefore I want to post it here. Maybe someone can tell me if the strategy is good enough to trade with real money.
Please, let me know what you think! :)
