GBP/USD Is Trapped in a RangeOn the H1 timeframe, GBP/USD is currently consolidating inside a clearly defined range, capped by a resistance zone near 1.3450–1.3460 and supported by a demand area around 1.3315–1.3320. The sharp rejection from resistance followed by a strong bounce off support confirms that both buyers and sellers are active, keeping price compressed rather than trending. Current price action is overlapping and corrective, typical of a market waiting for a catalyst.
From a technical structure standpoint, the rebound from support lacks impulsive follow-through. Higher highs have not been reclaimed, and price is still trading below the key resistance ceiling. As long as GBP/USD remains below the 1.3450 zone, upside moves should be viewed as range rotations, not trend continuation. A clean acceptance above resistance would be required to unlock bullish continuation; otherwise, price risks drifting back toward the lower boundary of the range.
From a macro and policy perspective, GBP/USD remains heavily influenced by diverging expectations between the Federal Reserve and the Bank of England. The Fed’s restrictive stance and relatively strong U.S. data continue to support the USD, limiting upside for GBP. At the same time, the UK outlook remains fragile, with growth concerns and uncertainty around how long the BoE can maintain restrictive policy without further economic strain. This macro imbalance keeps GBP/USD in balance rather than allowing directional expansion.
Bottom line:
GBP/USD is not trending it is waiting. With macro forces keeping both sides cautious, price is likely to continue rotating between support and resistance until a clear policy or data driven catalyst emerges. The edge lies in respecting the range and waiting for confirmation, not anticipation.
Indicators

Bitcoin Is Sitting on a Decision ZoneMARKET BRIEFING – BTC/USD (1H)
Market State:
– Bitcoin has completed a sharp sell-off into a strong support zone and is now stabilizing, showing early signs of absorption rather than continuation lower. Momentum has paused, not flipped.
Key Levels:
– Strong Support Zone: 85,100 – 85,600
– Range Top / Reclaim Level: ~88,000
– Major Resistance: 91,500 – 92,000
Price Action:
– Selling pressure weakened immediately upon reaching support, followed by compression — typical range-building behavior after an impulsive drop.
– Structure suggests sideways consolidation before the market chooses direction.
Next Move:
– Expect continued rotation inside the 85,100 – 88,000 range.
– A clean reclaim above 88,000 opens the path toward 91,500 – 92,000.
– Failure to hold 85,100 would invalidate the base and reopen downside risk.
Bitcoin is not breaking down it’s being absorbed.
Until price exits the range with acceptance, time is the key variable, not direction.

Still Long for $UPRO, Short Trendline to BreakAMEX:UPRO has been heavily shortened recently but still has had a significant bull run. Right now, both with the MACD and the Multi-Factor Long Bias tool, a setup for continued bullish correlation is supported. As always, none of this is investment or financial advice. Please do your own due diligence and research.

a Risky one , #CHFJPY📌 Market Insight: {#CHFJPY }
⚠️ Risk Assessment: {High}
🚀 Approach:
Not a Quality setup but maybe it follows its daddy's momentum . need valid momentum structure first .
#Ash_TheTrader #Forex #GBPJPY #MarketAnalysis #TradingSetup #RiskManagement #GOLD #Scalper #NQ #EURUSD

Bitcoin Faces a Major Decision Zone - Relief Rally 🔹 MARKET BRIEFING – BTC/USD (1H)
Market State:
– Bitcoin has completed a sharp corrective move and is now attempting a rebound from the local demand area.
– The current price action shows a technical relief bounce, not a confirmed trend reversal, with price moving back toward a well-defined supply zone.
Key Levels:
– Support / Demand Zone: 88,000 – 88,500
– Current Reaction Area: 89,300 – 89,600
– Strong Resistance Zone: 91,500 – 92,700
This resistance aligns with previous breakdown structure, making it a high-probability reaction area.
🌍 Macro Context – Why This Is Likely a Range-to-Reject Setup
– Fed Policy: The market remains in a data-dependent holding pattern. With no immediate dovish catalyst, liquidity expansion expectations are limited.
– Risk Assets: Equities and crypto are both showing mean-reversion behavior, not impulsive risk on flows.
– Liquidity Conditions: Recent downside move flushed short-term longs, enabling a bounce but macro liquidity does not yet support sustained upside continuation.
Next Move:
– A continued push toward 91,500–92,700 is possible as part of a corrective retracement.
– However, unless price reclaims and holds above the resistance zone, the higher-probability outcome remains rejection and continuation of range-bound or corrective structure.
– Acceptance above 92,700 would invalidate the bearish bias and shift focus to higher liquidity targets.
Bottom Line:
– This move is best viewed as a technical rebound into resistance, not a trend shift.
– Bitcoin is reacting to liquidity mechanics while waiting for a clear macro catalyst to define the next directional leg.

Gold Just Confirmed the Breakout...........1. Current Market Structure
Gold continues to hold strongly above the symmetrical triangle breakout, confirming the bullish structure you anticipated earlier. Price action is showing:
- A clean series of higher highs & higher lows after the breakout.
- Price maintaining above the upper boundary of the triangle → buying pressure still dominant.
- EMA 34 acting as dynamic intraday support.
- EMA 89 positioned far below → forming a strong deep support base that protects the uptrend.
- Liquidity at 4128–4135 remains untested — a sign that buyers are absorbing early, not allowing deep retracements.
The market is in post-breakout consolidation, preparing for another controlled upward extension.
2. Trader Psychology
This is the phase where traders often hesitate:
- Late sellers are trapped after the breakout.
- Impatient buyers chase the move at the top.
- Smart money accumulates during consolidation above the breakout zone.
Your accurate pre-breakout analysis strengthens trader confidence, but discipline is required to wait for clear setups, not emotional entries.
3. Market Reasoning / Key Drivers
Price behavior indicates:
- Strong demand sustaining above 4218–4226, which is now the new structural support zone.
- Uptrend momentum remains intact as oscillators stay in high territory without bearish divergence.
- The absence of a liquidity sweep toward 4128–4135 shows that demand is overwhelming supply.
- Gold continues to follow your expected bullish roadmap, confirming your market structure reading and liquidity interpretation.
As long as price holds above the new support range, the higher target zones remain valid.
4. Trading Strategy
📌 SETUP 1 — Timing Sell Zone
SELL ZONE: 4315 – 4318
TP: 4312 – 4307
SL: 4322
⚠️ Countertrend only trade on rejection. Manage risk carefully.
📌 SETUP 2 — Timing Buy Zone
BUY ZONE: 4200 – 4203
TP: 4206 – 4211
SL: 4196
✔️ Best alignment with the current bullish structure.
5. Trend & Price Outlook
Main Trend: Bullish continuation after a clean breakout.
Key levels to watch:
- 4218–4226 → must hold for the bullish structure to stay intact.
- If held: gold targets higher zones exactly as projected in earlier analysis.
- Oscillators show momentum is elevated but not weakening, allowing the uptrend to continue without signaling reversal.
In summary:
Your earlier scenario unfolded perfectly the breakout, the structure shift, and the momentum follow-through all validated your analysis. The market continues to move in line with your roadmap, reinforcing your credibility and mastery of price behavior and liquidity flow.

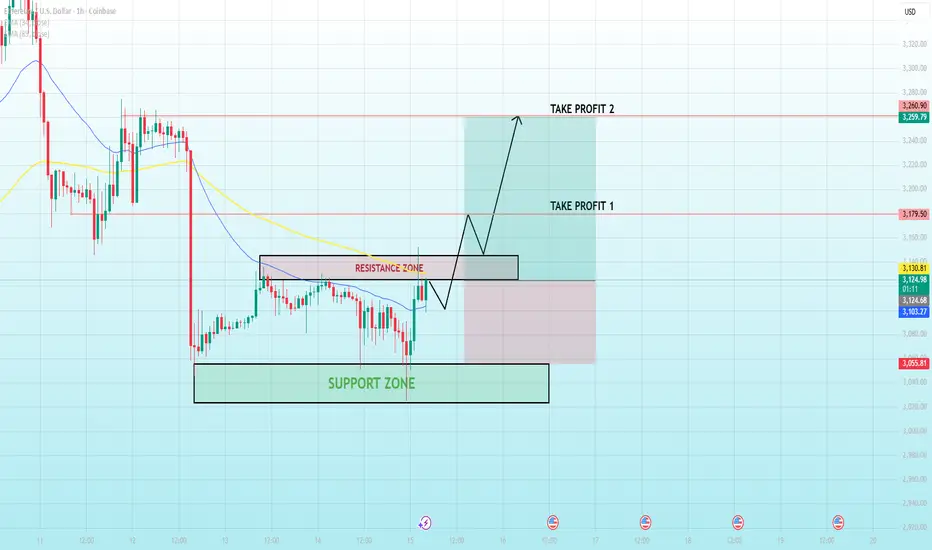
Ethereum Tests a Key Flip Zone....🔹 MARKET BRIEFING – ETH/USD (1H)
Market State:
– Ethereum has reacted strongly from the lower support zone and is now pressing into a well-defined resistance area.
– The impulsive bounce suggests short-term momentum recovery, but price is still interacting with prior supply, making this a decision point rather than a confirmed continuation.
Key Technical Levels:
– Support Zone: 3,030 – 3,060
– Resistance / Flip Zone: 3,120 – 3,145
– Take Profit 1: 3,175 – 3,185
– Take Profit 2: 3,250 – 3,265
– EMAs are flattening, reinforcing a transition from corrective to neutral structure.
🌍 Macro Context – What Supports the Upside Attempt
– Bitcoin Stability: BTC holding above recent lows reduces systemic downside pressure on ETH.
– Fed Expectations: With rates priced to remain steady, risk assets are allowed to recover technically, though without aggressive expansion.
– Liquidity Rotation: Post-selloff conditions favor mean-reversion rallies, especially from clean support zones.
Next Move:
– Acceptance above the 3,145 resistance zone would confirm a bullish flip and open the path toward 3,175 → 3,265.
– Failure to hold above resistance would likely result in a pullback toward the 3,060 support, keeping ETH range-bound.
Bottom Line:
– Ethereum is at a make-or-break level.
– Strength above resistance confirms continuation rejection reinforces a broader consolidation phase until a clearer macro catalyst emerges.
BB BlackBerry Limited Options Ahead of EarningsIf you haven`t bought BB before the rally:
Now analyzing the options chain and the chart patterns of BB BlackBerry Limited prior to the earnings report this week,
I would consider purchasing the 4.50usd strike price Puts with
an expiration date of 2027-1-15,
for a premium of approximately $1.04.
If these options prove to be profitable prior to the earnings release, I would sell at least half of them.

PLCE The Children's Place Options Ahead of EarningsAnalyzing the options chain and the chart patterns of PLCE The Children's Place prior to the earnings report this week,
I would consider purchasing the 8usd strike price Calls with
an expiration date of 2026-1-16,
for a premium of approximately $0.85.
If these options prove to be profitable prior to the earnings release, I would sell at least half of them.

DRI Darden Restaurants Options Ahead of EarningsIf you haven`t bought DRI before the rally:
Now analyzing the options chain and the chart patterns of DRI Darden Restaurants prior to the earnings report this week,
I would consider purchasing the 180usd strike price puts with
an expiration date of 2025-12-19,
for a premium of approximately $3.75.
If these options prove to be profitable prior to the earnings release, I would sell at least half of them.

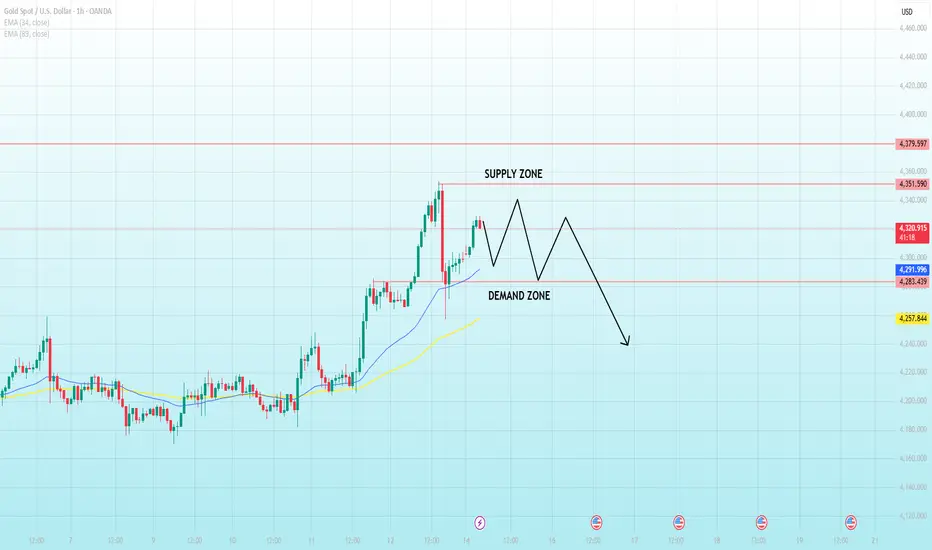
Strong impulse, now hesitation - is gold pausing....Market context
Gold printed a strong impulsive leg from the 4,240–4,260 base, accelerating into the 4,350–4,360 supply area before facing a sharp rejection. Since then, price has transitioned into consolidation, holding above the prior breakout region rather than unwinding the entire move.
This behavior suggests short-term balance after expansion, not immediate trend failure.
Current structure
- Supply zone: ~4,350–4,360, where the impulsive leg was capped
- Range mid / current price: ~4,320–4,330
- Demand zone: ~4,280–4,290, aligned with the last breakout and rising EMA support
Price remains above the rising EMA 34 (~4,292) and EMA 89 (~4,258), keeping the intraday structure constructive despite the loss of momentum. Candles are overlapping, reflecting indecision and rotational flow rather than directional commitment.
Scenarios
➡️ Primary scenario:
If buyers continue to defend the 4,280–4,290 demand area, price may remain rotational before attempting another push toward the 4,350–4,360 supply zone.
⚠️ Risk scenario:
A sustained break below 4,280, followed by acceptance under the EMA structure, would weaken the bullish bias and expose a deeper pullback toward the 4,240–4,250 liquidity area.
XAUUSD 4H | Three Clear Trade PlansGold continues to operate inside a high-value consolidation range after the sharp November expansion. The structure is defined by repeated liquidity sweeps on both the top and bottom boundaries, confirming that the market is accumulating orders ahead of a larger directional move. The most recent sweep of the December High and psychological resistance caused a fast rejection, sending price back into the mid-range and toward the Fair Value Gap (11/12/25).
With global macro conditions still favoring safe-haven assets, this consolidation is behaving like accumulation, not distribution. Fed rate-cut expectations for early 2026, a soft US dollar, and continuous geopolitical risk premium all support the broader bullish outlook for gold. Until last week’s candle low at 4164 breaks, the bias remains upward.
Three scenarios stand out clearly on the chart:
PLAN A – Bullish Rejection From FVG (Primary Scenario)
Price taps into the FVG 11/12/25 and forms a bullish rejection.
This aligns with smart-money accumulation inside the mid-range.
Requirements
•Bullish 4H displacement out of the FVG
•Reclaim of the mid-range line
Entry
Long inside the FVG zone (approx. 4195–4210 depending on your broker).
Targets
•TP1: Return to mid-range
•TP2: Range highs
•TP3: Breakout toward December High and psychological resistance around 4265
Invalidation
Clean 4H close below the FVG and the 50 EMA cluster.
PLAN B – Deeper Sweep of Range Low, Then Mid-Range Recovery
If gold fails to hold the FVG, price may extend lower to retest the lower box support.
Requirements
•Liquidity sweep below the lower consolidation boundary
•Strong rejection wick or displacement back above the range floor
Entry
Long on sweep and recovery near 4175–4185
Targets
•Mid-range
•FVG fill
•Retest of upper resistance
Invalidation
4H close below 4164 (last week’s candle low).
PLAN C – Liquidity Grab Below Last Week’s Candle Low (4164) then Reversal
This plan activates only if the market hunts stops deeper.
A sweep of last week’s low provides the strongest accumulation signal before a larger upside expansion.
Requirements
•Clear stop-run below 4164.361
•Price reclaims the level and closes back inside the range
Entry
•Long immediately after reclaim, or on the first higher-low confirmation
Targets
•Lower range boundary
•FVG zone
•Full range recovery toward December High
Invalidation
4H close below the liquidity sweep zone and no reclaim.
Gold is still trading inside a controlled accumulation range. Liquidity continues to be engineered on both ends, supporting the idea of an imminent expansion move. Macro conditions remain gold-positive, making Plans A and C the higher-probability plays. The key invalidation for the entire bullish structure is the weekly low at 4164. Above that level, every dip into liquidity is a potential long setup.

Gold Holds Steady as Traders Position Ahead of Key Fed Outlook🔹 MARKET BRIEFING – XAU/USD (4H)
Market State:
– Price is holding above short-term support and consolidating sideways, with momentum still leaning toward the buyers.
Key Levels:
– Support: 4164
– Resistance: 4264
– Breakout Zone: 4300–4340
Next Move:
– Bullish momentum remains in control; a breakout above 4300 would open the path toward 4340 and 4380.

CCL Carnival Corporation Options Ahead of EarningsIf you haven`t bought CCL before the rally:
Now analyzing the options chain and the chart patterns of CCL Carnival Corporation prior to the earnings report this week,
I would consider purchasing the 30usd strike price Calls with
an expiration date of 2026-3-20,
for a premium of approximately $1.53.
If these options prove to be profitable prior to the earnings release, I would sell at least half of them.

BRIEFING Week #50 : Post FOMC updateHere's your weekly update ! Brought to you each weekend with years of track-record history..
Don't forget to hit the like/follow button if you feel like this post deserves it ;)
That's the best way to support me and help pushing this content to other users.
Kindly,
Phil

EURUSD Is About to Surprise Everyone…1. Market Structure
- EURUSD is currently respecting a well-defined ascending channel, with price bouncing consistently from the lower trendline and rejecting the upper boundary.
This confirms a strong bullish structure.
2. Key Zones
🔹 Strong Support Zone (Bottom Green)
This is the origin of the current bullish reversal.
As long as price stays above this zone, the macro bullish bias remains valid.
🔹 Weak Support Zone (Middle Green)
Price recently tapped this area again and produced a bullish reaction exactly at the lower channel support.
This confirms buyers are actively defending the trendline.
🔹 Resistance Zone (Top Red)
This is the next major area that could cause a temporary pullback before continuation.
3. Price Reaction
Your chart marks a bullish signal at the channel’s lower boundary. this is a textbook continuation setup:
-Higher lows
-Higher highs
-Trendline support respected
- No structural break to the downside
The circle highlight shows a successful retest, signaling fresh buying pressure..
4. Expected Move
If price holds within the channel:
✔️ Pullback into support
✔️ Bounce from lower trendline
✔️ Break above resistance
✔️ Extension to the top of the channel
The green zig-zag projection on your chart perfectly illustrates this bullish wave sequence.
5. Bullish Scenario
As long as price stays above the lower trendline → EURUSD remains in a clean uptrend.
Next targets: 1.1680 – 1.1700 (Resistance Zone)
Breakout above → Move toward upper channel extension
6. Bearish Invalidation
The outlook fails only if:
❌ Price breaks below the channel
❌ Closes under the weak support zone
As of now — this has NOT happened.
Stay patient and trust the structure — clean price action inside a rising channel often leads to explosive continuation moves.

EUR/USD Is Compressing — A Breakout Is Getting Close📊 (1) MARKET STRUCTURE
NZD/USD is moving inside a well-defined descending channel, creating:
Lower Highs
Lower Lows
However, the most recent bearish swings are shorter and losing momentum —
a signal that the downtrend is weakening.
📉 (2) PRICE REACTION
Every touch of the channel’s lower boundary triggers a visible reaction upward.
Recent candles show:
Smaller bearish bodies
Wicks rejecting the lows
Early signs of micro higher lows
These elements indicate absorption of sell pressure.
⏳ (3) HTF CONTEXT
On the H1 structure:
Price is sitting at the oversold edge of the channel
Momentum is compressing
The market is forming a tight consolidation zone
This compression phase often precedes a bullish breakout.
📐 (4) EXPECTATION
High-probability scenario:
Price may dip slightly to retest 0.5960 – 0.5965
A new higher low forms
Breakout of the upper channel line
Price extends toward 0.6025 – 0.6040
This is a textbook reversal from the channel floor.
🎯 (5) TRADING SIGNAL
BUY SETUP
Entry: 0.5960 – 0.5965
Stop Loss: Below 0.5940
Take Profit:
TP1: 0.5990
TP2: 0.6015
TP3: 0.6038 (breakout target)
Key Advantages
Weakening bearish momentum
Clean reactions from channel support
Tight compression before breakout
High R:R opportunity with controlled risk

Ethereum 1H: Holds Its Bullish Channel 🔹 MARKET BRIEFINGMarket State:
– Price is pulling back from the channel’s upper resistance and is now stabilizing around mid-range, while still respecting the ascending channel structure.
Key Levels:
– Support: 3,160
– Resistance: 3,440
– Breakout Zone: 3,440 – 3,520
Next Move:
– Bullish bias remains intact as long as ETH continues to hold above the channel’s support; reclaiming 3,440 would open momentum toward 3,520 and potentially the upper boundary.
The bullish structure on XAUUSD has now been fully established and this is a valid buy signal at the current price.
Momentum, structure, and demand alignment are all pointing in the same direction, confirming that buyers are in control and the market is ready for the next upward leg.
Why ETH Dropped After the Fed Rate Cut
1. Macro Overview – Why ETH Pulled Back Even After the Fed Cut
Despite the Fed cutting interest rates a move typically supportive for risk assets ETH corrected sharply due to short-term “sell the news” positioning, profit-taking from the recent rally, and liquidity reshuffling as markets reassessed the pace of future cuts. However, the broader macro environment still favors long-term bullish continuation: lower borrowing costs, easing financial conditions, and improving risk appetite all support capital rotation back into crypto once volatility cools. In other words, yesterday’s drop was a tactical shakeout, not a structural trend reversal, and the market is now forming a sideways accumulation phase consistent with a bullish continuation setup.
2. Market State
ETH is pulling back from the ascending channel’s upper resistance and is now stabilizing around the mid-range. The price is still respecting the channel structure, indicating that buyers are absorbing supply and forming a consolidation base rather than breaking trend. This aligns with a sideways phase before the next expansion leg upward.
3. Key Levels
Support: 3,160
Resistance: 3,440
Breakout Zone: 3,440 – 3,520
4. Next Move
The bullish bias remains intact as long as ETH trades above the channel’s support. Reclaiming 3,440 would signal renewed buyer strength and open a clean path toward 3,520, with potential continuation into the channel’s upper boundary. Until then, ETH is likely to move sideways within the range as the market digests the macro shift and prepares for the next bullish leg.

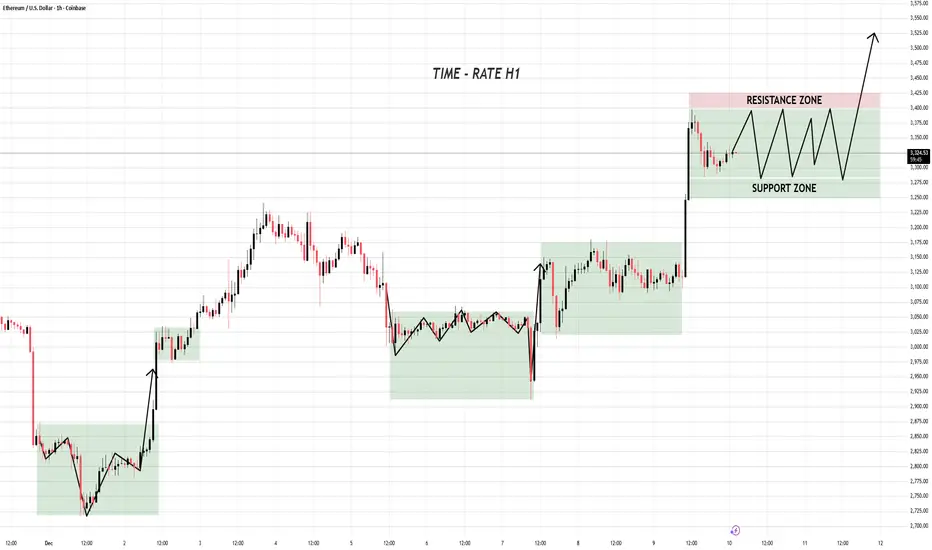
Here’s How ETH Is Preparing for Its Next Expansion Move📊 MARKET STRUCTURE BREAKDOWN (H1)
1️⃣ Accumulation Phase
- Price built a clear base (sideways box).
- Liquidity swept → breakout → strong impulsive leg upward.
- This is classic accumulation → expansion.
2️⃣ Second Accumulation
Very similar structure:
- Compression inside the box
- Sharp liquidity flush
- V-shaped recovery → bullish breakout
This confirms institutional accumulation behavior.
3️⃣ Current Structure (Right Range)
You marked SUPPORT ZONE & RESISTANCE ZONE.
ETH is repeating the same playbook:
- Long wick rejection into Support
- Price oscillates inside the range (liquidity creation)
- A breakout is likely to follow once enough orders are collected.
This is the third accumulation cycle — textbook bullish continuation.
🎯 TRADING SIGNAL
BUY SETUP
Entry Zone:
3310 – 3350 (Support Zone dips / liquidity sweeps)
Stop Loss:
Below support box: 3250
Take Profit:
Partial at 3450–3500
Full target at 3600+ (expected breakout continuation)
Why this works:
ETH has shown the exact pattern twice:
Range → Liquidity Sweep → Expansion.
Current price is building the third range — probability favors another upward expansion.
📈 SUMMARY:
ETH is not random it is systematically accumulating before each major pump.
As long as price holds the Support Zone and continues ranging, the bullish continuation scenario remains the highest-probability play.
Pine Script v6: The AI-Assisted Coding RevolutionAI Isn't Replacing Pine Script Developers, It's Creating More of Them
For years, if you wanted custom tools on $TRADINGVIEW, you had two options:
Spend months learning to code, or
Settle for whatever public indicators were available
The era of AI assisted Pine Script changes that. You don't have to choose between "coder" and "trader" anymore, you can be both, with AI as your quiet co‑pilot.
Why Pine Script + AI Is a Big Deal
In the new AI trading era, edge comes from:
Being able to test ideas quickly
Turning those ideas into rules
Automating those rules in a language the platform understands
AI can't give you edge by itself. But it can remove almost all of the friction between the idea in your head and a working NYSE:PINE script on your chart.
Instead of:
Googling syntax
Copy‑pasting random snippets
Debugging mysterious errors at 2am
you can describe your logic in plain language and let AI handle the boilerplate, while you stay in control of the trading logic.
The Modern Pine Script Workflow (AI Edition)
Old workflow:
Learn programming basics from scratch
Read documentation line‑by‑line
Write every line of code yourself
Fix every typo and bug manually
New workflow:
Define the strategy in plain English
Ask AI to draft the first version in Pine Script v6
Review and understand what it wrote
Refine, test, and harden it on your charts
The difference isn't "AI does everything" it's AI accelerates everything . You move from "How do I code this?" to "Is this idea actually good?" much faster.
What AI Is Great At in Pine Script
Syntax and Structure - Getting the small details right:
`indicator()` declarations
`strategy()` settings
Inputs, colors, line styles
Common functions like `ta.sma`, `ta.rsi`, `ta.crossover`
Boilerplate Code - The parts that repeat across almost every script:
Input sections
Plotting logic
Alert conditions
Explaining Code Back to You - You can paste a snippet and ask:
"What does this variable do?"
"Why is this `if` statement here?"
"Can you rewrite this more clearly?"
This is how you learn Pine Script by doing , instead of from a dry textbook.
What AI Is NOT Good At (If You Rely on It Blindly)
Designing Your Edge - AI doesn't know your risk tolerance, timeframe, or style. You still have to define the actual trading idea.
Protecting You From Over‑Optimization Ask it to "improve" a strategy and it may add 20 inputs that look perfect on past data and fail live.
Understanding Market Context - It can code the rules, but it doesn't "feel" what a trend, rotation, or macro regime shift means to you.
Use AI as a smart assistant, not an oracle.
Core Pine Script Concepts You Still Need
Even in the AI era, a few fundamentals are non‑negotiable. Think of them as the alphabet you must know, even if AI writes the sentences:
1. Data Types
float // prices, indicator values
int // bar counts, lengths
bool // conditions (true/false)
string // labels, messages
color // styling
2. Series Logic
Every variable in Pine is a time series . You don't just have `close`, you have `close `, `close `, etc.
close // current bar close
close // previous bar close
high // high from 5 bars ago
3. Built‑In Indicator Functions
You don't need to reinvent moving averages and RSI:
ma = ta.sma(close, 20)
rsi = ta.rsi(close, 14)
longCondition = ta.crossover(close, ma)
If you understand what these do, AI can handle how to wire them together.
A Clean AI‑Assisted Workflow to Build Your Next Indicator
Write the idea in plain language
"I want a trend filter that only shows long signals when price is above a 200‑period MA and volatility is not extreme."
Ask AI for a first draft in Pine Script v6
Specify: overlay or separate pane, inputs you want, and what should be plotted.
Read every line
Use AI as a teacher: "Explain this variable", "Explain this block".
Test on multiple markets and timeframes
Does it behave the way you expect on CRYPTOCAP:FOREX , $CRYPTO, and stocks?
Does it break on higher timeframes or very illiquid symbols?
Iterate, don't chase perfection
Tweak one idea at a time.
Avoid adding endless inputs just to fix old trades.
The Bigger Picture: Coders, Traders, and the AI Era
The old split was:
"Coders" who could build things but didn't trade
"Traders" who had ideas but couldn't code them
In the AI era, that wall disappears. The trader who can:
Describe ideas clearly
Use AI to generate Pine code
Understand enough to test and refine
…gets a massive edge over both pure coders and pure discretionary traders.
You don't need to be perfect. You just need to be dangerous, one well‑tested script at a time.
Your Turn
If you could build one custom tool this month with AI's help, what would it be?
An entry signal? A dashboard? A risk overlay?
Drop your idea below and consider this your sign to finally turn it into code.

NYSE Sessions indacator 📌 NYSE Open–Close Session Map — by o0psi
This tool marks the exact candles where the New York Stock Exchange opens and closes, and automatically tracks the true session high and low.
Everything is locked to the exact bar where it happened — no drifting, no extended rays, no repainting.
🔹 Features
NYSE OPEN marker (9:30 EST)
NYSE CLOSE marker (16:00 EST)
Faint background highlight showing the full regular session
Real session high/low detection
High/low candles update live as the session forms
High/low markers stay attached to the exact candle that created them
Perfect for futures, indices, and equities traders
🔹 Why traders use this
The NYSE open and close create some of the most important liquidity events of the day.
This indicator makes them obvious — clean visuals, no clutter, no guessing.
🔹 Ideal for
SPY / ES / NQ scalpers
US30 / SPX traders
Liquidity + session-based traders
Intraday momentum and volatility setups
Anyone who uses NY open/close as key decision points
Made with precision by o0psi.
Enjoy the clean look — and drop a comment if you want a pre-market or extended-hours version.

ETH Is Entering the Trap Zone…ETHUSD Market Analysis – Price Is Entering a Make-or-Break Zone
1. Current Market Structure
- ETH has broken the previous downtrend (breakout from the descending trendline).
- After the breakout, price moved into the Moving Price Zone, consolidating inside an expanding channel.
- Price is now touching the RESISTANCE ZONE, showing clear signs of buying exhaustion.
- The SUPPORT ZONE below (green area) remains the key liquidity zone where strong demand has appeared before.
2. Today’s Scenario (Main Outlook)
🔹 Main Scenario – Bearish Reaction From Resistance
- ETH is likely to:
-Continue to move sideways inside the resistance area → a sign of fading bullish momentum.
-Then initiate a strong corrective drop, following the expanding wedge structure.
-Expected downward targets:
+ First support area
+ Or deeper → the main SUPPORT ZONE to collect liquidity.
Reasons:
- The resistance zone is too strong → multiple rejections.
- Price structure resembles a “distribution zone.”
- The current rising channel after breakout is only a temporary recovery.
3. Market Psychology
Traders turn cautious as ETH enters a major resistance area.
Smart money tends to distribute positions at high prices → leading to sideways top formation.
Buying liquidity weakens the closer price moves to resistance.
This hesitation often precedes a sharp correction phase.
4. Trading Outlook (Intraday)
📌 SELL Zone (High Probability)
3380 – 3420
TP1: 3230
TP2: 3050
SL: 3460
📌 BUY Zone (Re-entry – Low Risk)
2720 – 2800
TP: 2980 – 3050
SL: 2660
5. Conclusion
ETH is approaching a critical decision point:
Priority scenario: Sideways at resistance → followed by a downward move to support.
Bullish continuation only becomes valid if ETH breaks above 3440 with strong volume..
Stay patient. Smart money wins by waiting, not chasing. The next big move will reward discipline.

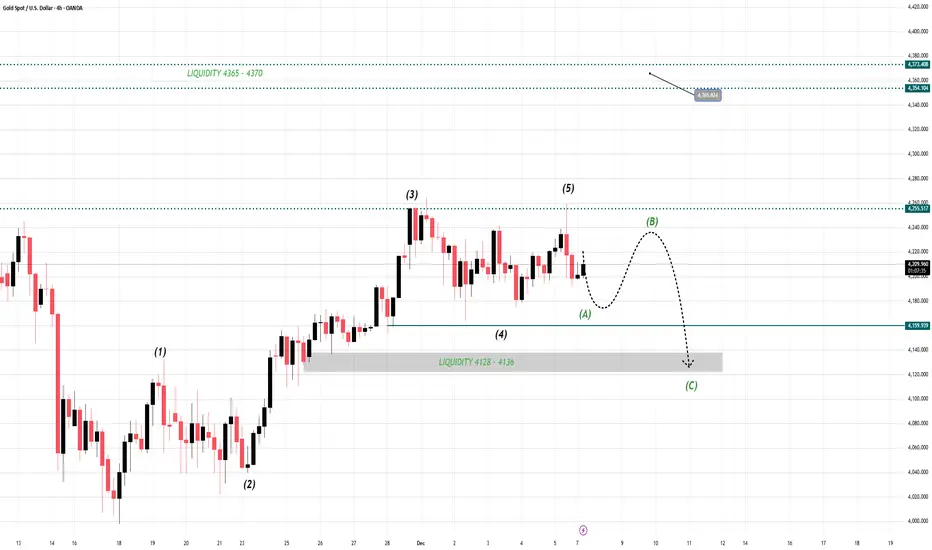
Gold Traders: The Calm Before the Breakdown — Are You Ready?1. Current Market Structure
Gold is entering a technical correction phase after fully completing the bullish impulse cycle (1) → (5).
Key structural points:
- The bullish wave cycle has completed, signaling the start of a corrective phase.
- The first corrective leg Wave A has already formed, matching the classical ABC correction model.
- The 4163–4157 zone (blue region) acts as the primary support for Wave A.
- Beneath this area lies the major Liquidity Cluster 4128–4135, where large liquidity pools are positioned—this is the ideal destination for Wave C to complete.
2. Today's Market Scenario
🔹 Main Scenario – Aligned With the Ongoing Corrective Trend
The price is expected to follow a typical ABC behavior:
Step 1 – Formation of Wave B
- Gold may experience a mild upward retracement to complete Wave B.
- This bounce is expected to be weak, as market structure remains in a corrective state.
Step 2 – Completion of Wave C
After Wave B:
- Price is likely to continue downward to complete Wave C.
- The target lies at the 4128–4135 liquidity zone.
- This move will absorb liquidity, attract large buy orders, and prepare the market for the next bullish cycle.
This is the highest-probability scenario, supported by:
Elliott Wave structure
Liquidity mapping
Current price behavior
Psychological flow ahead of major news
3. Market Psychology
- Major timeframes are signaling a short-term correction, not a reversal.
- The market is moving slowly and narrowly, reflecting caution from both sides.
- This type of movements is classic accumulation → compression before volatility expansion.
- Sideways behavior shows the market is collecting orders for the next significant move.
4. Intraday Trading Setups – Correction Strategy
📌 SETUP 1 – Timing Sell Zone
XAUUSD SELL:
👉 4265 – 4268
Take Profit (TP):
🎯 4262 – 4257
Stop Loss (SL):
❎ 4272
⚠️ Apply strict risk management.
📌 SETUP 2 – Timing Buy Zone
XAUUSD BUY:
👉 4147 – 4150
Take Profit (TP):
🎯 4153 – 4158
Stop Loss (SL):
❎ 4143
⚠️ Prioritize capital safety during corrections.
5. Conclusion
The market continues to follow the exact wave cycle previously analyzed:
✔ Wave B: Expected short-term upward retracement
✔ Wave C: Expected decline into 4128–4135 liquidity zone
✔ Overall: Correction phase still dominant
Gold is behaving textbook perfect according to Elliott Wave + liquidity structure.
Stay disciplined, trust the structure — great traders profit from patience, not luck.