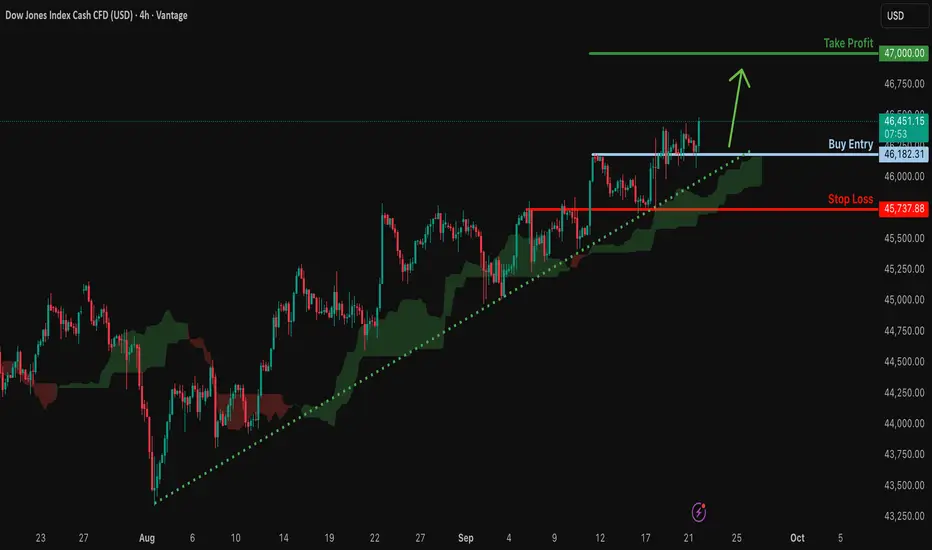
Bulllish continuation?Dow Jones (DJ30) has bounced off the support level which acts as a pullback support and could potentially rise from this level to our take profit.
Entry: 46,182.31
Why we like it:
There is a pullback support.
Stop loss: 45,737.88
Why we like it:
There is an overlap support level.
Take profit: 47,000
Why we like it:
There is a swing high resistance level.
Enjoying your TradingView experience? Review us!
Please be advised that the information presented on TradingView is provided to Vantage (‘Vantage Global Limited’, ‘we’) by a third-party provider (‘Everest Fortune Group’). Please be reminded that you are solely responsible for the trading decisions on your account. There is a very high degree of risk involved in trading. Any information and/or content is intended entirely for research, educational and informational purposes only and does not constitute investment or consultation advice or investment strategy. The information is not tailored to the investment needs of any specific person and therefore does not involve a consideration of any of the investment objectives, financial situation or needs of any viewer that may receive it. Kindly also note that past performance is not a reliable indicator of future results. Actual results may differ materially from those anticipated in forward-looking or past performance statements. We assume no liability as to the accuracy or completeness of any of the information and/or content provided herein and the Company cannot be held responsible for any omission, mistake nor for any loss or damage including without limitation to any loss of profit which may arise from reliance on any information supplied by Everest Fortune Group.
Indices
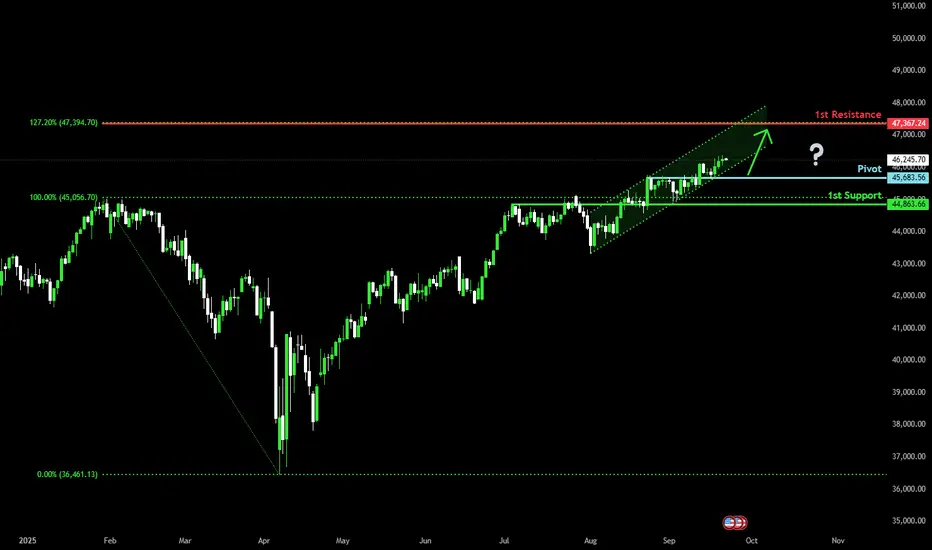
Bullish momentum to extend?Dow Jones (US30) is falling towards the pivot and oculd bounce to the 1st resistance.
Pivot: 45,683.56
1st Support: 44,863.66
1st Resistance: 47,367.24
Disclaimer:
The above opinions given constitute general market commentary, and do not constitute the opinion or advice of IC Markets or any form of personal or investment advice.
Any opinions, news, research, analyses, prices, other information, or links to third-party sites contained on this website are provided on an "as-is" basis, are intended only to be informative, is not an advice nor a recommendation, nor research, or a record of our trading prices, or an offer of, or solicitation for a transaction in any financial instrument and thus should not be treated as such. The information provided does not involve any specific investment objectives, financial situation and needs of any specific person who may receive it. Please be aware, that past performance is not a reliable indicator of future performance and/or results. Past Performance or Forward-looking scenarios based upon the reasonable beliefs of the third-party provider are not a guarantee of future performance. Actual results may differ materially from those anticipated in forward-looking or past performance statements. IC Markets makes no representation or warranty and assumes no liability as to the accuracy or completeness of the information provided, nor any loss arising from any investment based on a recommendation, forecast or any information supplied by any third-party.
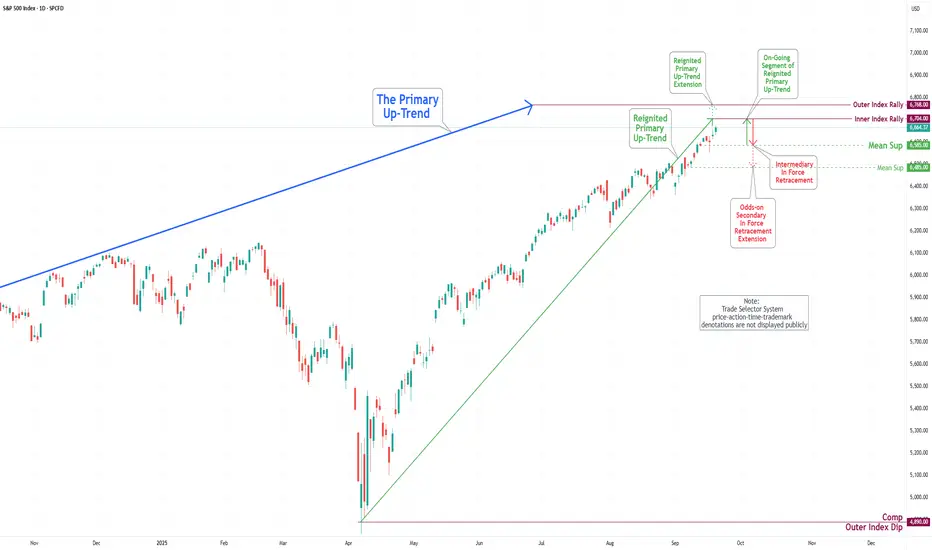
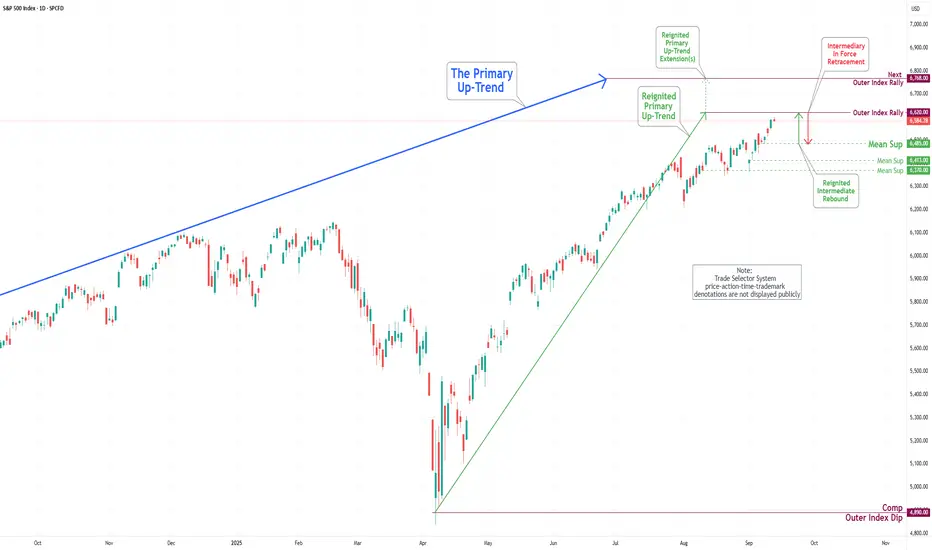
S&P 500 Daily Chart Analysis For Week of Sep 19, 2025Technical Analysis and Outlook:
In the trading session of the previous week, the S&P 500 Index demonstrated a significant upward price movement following a severe drawdown on Tuesday. The index successfully reached the Outer Index Rally level of 6620 and is currently progressing towards the established target of the Inner Index Rally at 6704, with the potential for further upward momentum to extend to the Outer Index Rally level of 6768.
It is essential to acknowledge that upon achieving the target of the Inner Index Rally at 6704, the expected price action is likely to initiate a substantial pullback, which is projected to aim for the target Mean Support level of 6585 and may extend to the Mean Support at 6485. Nonetheless, this primary segment of intermediary In Force Retracement pullback is likely to facilitate a considerable rebound, allowing for a subsequent retest of the Outer Index Rally level of 6704.
NAS100 H4 | Bullish continuation in playUS100 has bounced off the buy entry at 23,984.23, which is a pullback support and could rise from this level to the upside.
Stop loss is at 23,721.86, which is an overlap support.
Take profit is at 24,853.60, which aligns with the 61.8% Fibonacci projection.
High Risk Investment Warning
Trading Forex/CFDs on margin carries a high level of risk and may not be suitable for all investors. Leverage can work against you.
Stratos Markets Limited (tradu.com ):
CFDs are complex instruments and come with a high risk of losing money rapidly due to leverage. 65% of retail investor accounts lose money when trading CFDs with this provider. You should consider whether you understand how CFDs work and whether you can afford to take the high risk of losing your money.
Stratos Europe Ltd (tradu.com ):
CFDs are complex instruments and come with a high risk of losing money rapidly due to leverage. 66% of retail investor accounts lose money when trading CFDs with this provider. You should consider whether you understand how CFDs work and whether you can afford to take the high risk of losing your money.
Stratos Global LLC (tradu.com ):
Losses can exceed deposits.
Please be advised that the information presented on TradingView is provided to Tradu (‘Company’, ‘we’) by a third-party provider (‘TFA Global Pte Ltd’). Please be reminded that you are solely responsible for the trading decisions on your account. There is a very high degree of risk involved in trading. Any information and/or content is intended entirely for research, educational and informational purposes only and does not constitute investment or consultation advice or investment strategy. The information is not tailored to the investment needs of any specific person and therefore does not involve a consideration of any of the investment objectives, financial situation or needs of any viewer that may receive it. Kindly also note that past performance is not a reliable indicator of future results. Actual results may differ materially from those anticipated in forward-looking or past performance statements. We assume no liability as to the accuracy or completeness of any of the information and/or content provided herein and the Company cannot be held responsible for any omission, mistake nor for any loss or damage including without limitation to any loss of profit which may arise from reliance on any information supplied by TFA Global Pte Ltd.
The speaker(s) is neither an employee, agent nor representative of Tradu and is therefore acting independently. The opinions given are their own, constitute general market commentary, and do not constitute the opinion or advice of Tradu or any form of personal or investment advice. Tradu neither endorses nor guarantees offerings of third-party speakers, nor is Tradu responsible for the content, veracity or opinions of third-party speakers, presenters or participants.

UK100 H4 | Bearish reversal off pullback resistanceBased on the H4 chart analysis, we can see that the price has rejected off the sell entry at 9,246.71, which is a pullback resistance and oculd potentially drop from this level to the take profit.
Stop loss is at 9,340.97, which is a multi-swing high resistance.
Take profit is at 9,107.27, which is a swing low support.
High Risk Investment Warning
Trading Forex/CFDs on margin carries a high level of risk and may not be suitable for all investors. Leverage can work against you.
Stratos Markets Limited (tradu.com ):
CFDs are complex instruments and come with a high risk of losing money rapidly due to leverage. 65% of retail investor accounts lose money when trading CFDs with this provider. You should consider whether you understand how CFDs work and whether you can afford to take the high risk of losing your money.
Stratos Europe Ltd (tradu.com ):
CFDs are complex instruments and come with a high risk of losing money rapidly due to leverage. 66% of retail investor accounts lose money when trading CFDs with this provider. You should consider whether you understand how CFDs work and whether you can afford to take the high risk of losing your money.
Stratos Global LLC (tradu.com ):
Losses can exceed deposits.
Please be advised that the information presented on TradingView is provided to Tradu (‘Company’, ‘we’) by a third-party provider (‘TFA Global Pte Ltd’). Please be reminded that you are solely responsible for the trading decisions on your account. There is a very high degree of risk involved in trading. Any information and/or content is intended entirely for research, educational and informational purposes only and does not constitute investment or consultation advice or investment strategy. The information is not tailored to the investment needs of any specific person and therefore does not involve a consideration of any of the investment objectives, financial situation or needs of any viewer that may receive it. Kindly also note that past performance is not a reliable indicator of future results. Actual results may differ materially from those anticipated in forward-looking or past performance statements. We assume no liability as to the accuracy or completeness of any of the information and/or content provided herein and the Company cannot be held responsible for any omission, mistake nor for any loss or damage including without limitation to any loss of profit which may arise from reliance on any information supplied by TFA Global Pte Ltd.
The speaker(s) is neither an employee, agent nor representative of Tradu and is therefore acting independently. The opinions given are their own, constitute general market commentary, and do not constitute the opinion or advice of Tradu or any form of personal or investment advice. Tradu neither endorses nor guarantees offerings of third-party speakers, nor is Tradu responsible for the content, veracity or opinions of third-party speakers, presenters or participants.

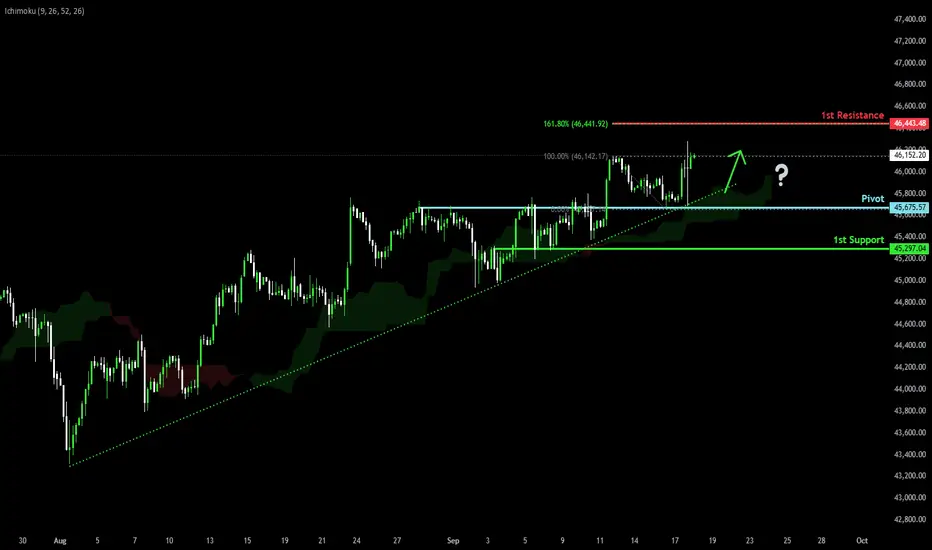
Bullish momentum to extend?Dow Jones (US30) has bounced off the pivot, which has been identified as a pullback support and could potentially rise to the 1st resistance which aligns with hte 161.8% Fibonacci extension.
Pivot: 45,675.57
1st Support: 45,297.04
1st Resistance: 46,443.48
Disclaimer:
The above opinions given constitute general market commentary, and do not constitute the opinion or advice of IC Markets or any form of personal or investment advice.
Any opinions, news, research, analyses, prices, other information, or links to third-party sites contained on this website are provided on an "as-is" basis, are intended only to be informative, is not an advice nor a recommendation, nor research, or a record of our trading prices, or an offer of, or solicitation for a transaction in any financial instrument and thus should not be treated as such. The information provided does not involve any specific investment objectives, financial situation and needs of any specific person who may receive it. Please be aware, that past performance is not a reliable indicator of future performance and/or results. Past Performance or Forward-looking scenarios based upon the reasonable beliefs of the third-party provider are not a guarantee of future performance. Actual results may differ materially from those anticipated in forward-looking or past performance statements. IC Markets makes no representation or warranty and assumes no liability as to the accuracy or completeness of the information provided, nor any loss arising from any investment based on a recommendation, forecast or any information supplied by any third-party.
SHORT ON NASNAS has created a nice rising channel (bearish reversal pattern) and is starting to push outside of the channel to the downside.
I will be selling nas to the previous low looking to catch 800-900 points.

DAX, FTSE Update: Bears Regain ControlMomentum has finally come my way, which has seen bears reclaim control of the DAX and FTSE 100. And I suspect they'll retain control for a while longer. Today I update my levels and outlook for both markets.
Matt Simpson, Market Analyst at City Index and Forex.com (part of StoneX).

Heading into 38.2% Fibonacci resistance?UK100 is rising towards the pivot which acts as an overlap resistance that lines up with the 38.2% Fibonacci retracement and could reverse to the multi swing low support.
Pivot: 9,240.23
1st Support: 9,128.22
1st Resistance: 9,327.92
Disclaimer:
The above opinions given constitute general market commentary, and do not constitute the opinion or advice of IC Markets or any form of personal or investment advice.
Any opinions, news, research, analyses, prices, other information, or links to third-party sites contained on this website are provided on an "as-is" basis, are intended only to be informative, is not an advice nor a recommendation, nor research, or a record of our trading prices, or an offer of, or solicitation for a transaction in any financial instrument and thus should not be treated as such. The information provided does not involve any specific investment objectives, financial situation and needs of any specific person who may receive it. Please be aware, that past performance is not a reliable indicator of future performance and/or results. Past Performance or Forward-looking scenarios based upon the reasonable beliefs of the third-party provider are not a guarantee of future performance. Actual results may differ materially from those anticipated in forward-looking or past performance statements. IC Markets makes no representation or warranty and assumes no liability as to the accuracy or completeness of the information provided, nor any loss arising from any investment based on a recommendation, forecast or any information supplied by any third-party.

UK100 H4 | Bullish bounceBased on the H4 chart analysis, we could see the price fall to the buy entry of 9,236.24, whichis an overlap support that is slightly above the 50% Fibonacci retracement and could bounce from this level to the upside.
Stop loss is at 9,178.92, whichis a pullback support that is slightly below the 127.2% Fibonacci extension.
Take profit is at 9,340.36, which acts as a multi swing high resistance.
High Risk Investment Warning
Trading Forex/CFDs on margin carries a high level of risk and may not be suitable for all investors. Leverage can work against you.
Stratos Markets Limited (tradu.com ):
CFDs are complex instruments and come with a high risk of losing money rapidly due to leverage. 65% of retail investor accounts lose money when trading CFDs with this provider. You should consider whether you understand how CFDs work and whether you can afford to take the high risk of losing your money.
Stratos Europe Ltd (tradu.com ):
CFDs are complex instruments and come with a high risk of losing money rapidly due to leverage. 66% of retail investor accounts lose money when trading CFDs with this provider. You should consider whether you understand how CFDs work and whether you can afford to take the high risk of losing your money.
Stratos Global LLC (tradu.com ):
Losses can exceed deposits.
Please be advised that the information presented on TradingView is provided to Tradu (‘Company’, ‘we’) by a third-party provider (‘TFA Global Pte Ltd’). Please be reminded that you are solely responsible for the trading decisions on your account. There is a very high degree of risk involved in trading. Any information and/or content is intended entirely for research, educational and informational purposes only and does not constitute investment or consultation advice or investment strategy. The information is not tailored to the investment needs of any specific person and therefore does not involve a consideration of any of the investment objectives, financial situation or needs of any viewer that may receive it. Kindly also note that past performance is not a reliable indicator of future results. Actual results may differ materially from those anticipated in forward-looking or past performance statements. We assume no liability as to the accuracy or completeness of any of the information and/or content provided herein and the Company cannot be held responsible for any omission, mistake nor for any loss or damage including without limitation to any loss of profit which may arise from reliance on any information supplied by TFA Global Pte Ltd.
The speaker(s) is neither an employee, agent nor representative of Tradu and is therefore acting independently. The opinions given are their own, constitute general market commentary, and do not constitute the opinion or advice of Tradu or any form of personal or investment advice. Tradu neither endorses nor guarantees offerings of third-party speakers, nor is Tradu responsible for the content, veracity or opinions of third-party speakers, presenters or participants.

Potential bullish continuation?DJ30 is falling towards the support level, which is pullback support that is slightly above the 50% Fibonacci retracement and could bounce from this level to our take profit.
Entry: 45,688.53
Why we like it:
There is a pullback support that is slightly above the 50% Fibonacci retracement.
Stop loss: 45,306.39
Why we like it:
There is a pullback support that lines up with the 78.6% Fibonacci retracement.
Take profit: 46,177.16
Why we like it:
There is a swing high resistance level.
Enjoying your TradingView experience? Review us!
Please be advised that the information presented on TradingView is provided to Vantage (‘Vantage Global Limited’, ‘we’) by a third-party provider (‘Everest Fortune Group’). Please be reminded that you are solely responsible for the trading decisions on your account. There is a very high degree of risk involved in trading. Any information and/or content is intended entirely for research, educational and informational purposes only and does not constitute investment or consultation advice or investment strategy. The information is not tailored to the investment needs of any specific person and therefore does not involve a consideration of any of the investment objectives, financial situation or needs of any viewer that may receive it. Kindly also note that past performance is not a reliable indicator of future results. Actual results may differ materially from those anticipated in forward-looking or past performance statements. We assume no liability as to the accuracy or completeness of any of the information and/or content provided herein and the Company cannot be held responsible for any omission, mistake nor for any loss or damage including without limitation to any loss of profit which may arise from reliance on any information supplied by Everest Fortune Group.

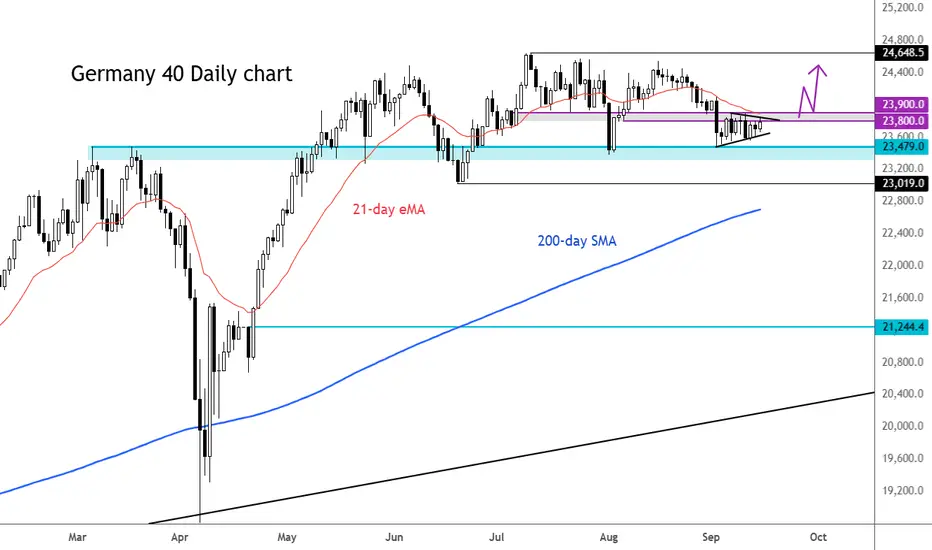
DAX potential breakout immanent While most other major indices have been busy breaking records, the DAX has not been doing much, instead continuing to consolidate its big gains from the past when it was outshining other markets. But with sentiment remaining positive towards European and global markets, the risks remain skewed to the upside, especially given that the long-term support area of around 23,500 is holding firming. The index needs to clear short-term resistance in the 100-point band between 23,800 to 23,900 to potentially trigger follow-up technical buying above that zone. That's the bullish signal I am certainly waiting for now.
By Fawad Razaqzada, market analyst with FOREX.com
S&P 500 Daily Chart Analysis For Week of Sep 12, 2025Technical Analysis and Outlook:
In the previous trading session, the S&P 500 Index exhibited a substantial upward movement, reaching and completing the Outer Index Rally 6543, and it is striding towards our current designated target: Outer Index Rally 6620, as detailed in the prior S&P 500 Daily Chart Analysis.
It is critical to recognize that upon reaching this momentous target, the resulting price action is anticipated to initiate a significant pullback targeting the Mean Support level of 6485. This pullback is likely to facilitate a considerable rebound, allowing for a subsequent retest of the Outer Index Rally level of 6620.
Dow Jones support levels to watchThe Dow was the star of the show yesterday. After chopping sideways for a few days above the 45,000 mark – a crucial resistance level taken out back in late August – we’ve finally got that breakout everyone was waiting for. Thursday's push through the resistance around 45,760 is a strong signal that the bulls are still in charge. As long as we hold above that level on any retest, the uptrend looks very healthy. If we slip back below, yes, things could get a bit messy, but honestly, the broader structure still screams bullish. The 45,000 level remains the real line in the sand – lose that and the tone changes, but for now, I’d be surprised if we don’t see higher highs from here.
By Fawad Razaqzada, market analyst with FOREX.com

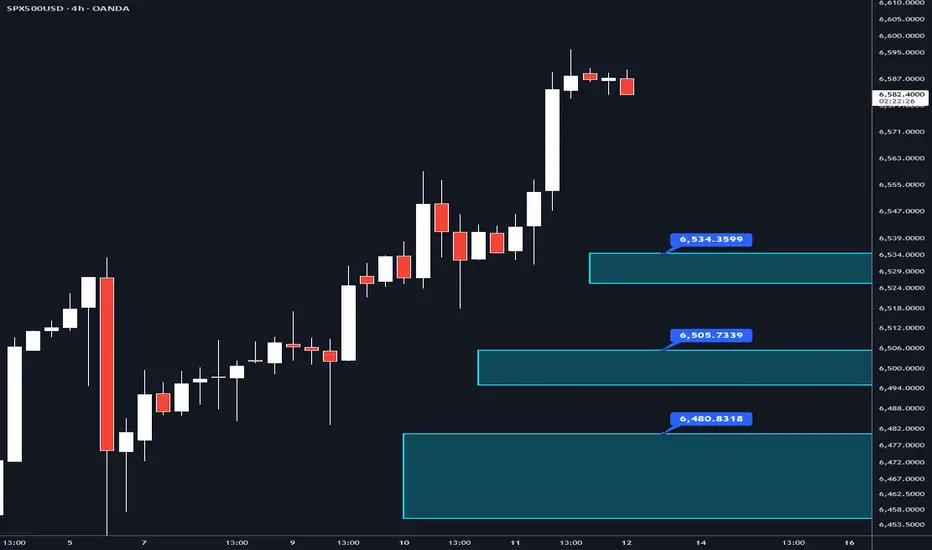
SPX500USD – Important Levels Below (Watch for Next Week)The S&P 500 is holding near all-time highs. When markets sit at extremes, it’s useful to map out where the structure lives underneath. These are levels that:
Could act as strong support if price pulls back (buy interest).
Or, if broken, could accelerate downside momentum into deeper zones.
Here are some confluent areas to keep in mind for next week (as today is Friday):
6.525 – 6,534 → Weekly vWAP, weekly time POC, and a poor low.
6,495 - 6,506 → Naked weekly POC and naked daily POC.
6,455 – 6,479 → Naked daily, naked weekly, monthly vWAP, daily naked POC, weekly naked POC, current monthly POC, and weekly time naked POC. So clearly the biggest level to watch!
Why these matter: when multiple levels overlap (VWAP, POC, HTF highs/lows, etc, liquidity often pools there. That makes them “decision points” — either support for a bounce or, if broken, fuel for a larger move down.
If you’re new to terms like VWAP or POC, don’t worry — they can be confusing at first. Leave a comment and I’ll happily explain, or DM me if you prefer to ask privately.
This post is for educational purposes only. It is not financial advice or a trading signal.
DAX, FTSE 100 Futures OutlookI've been monitoring the FTSE and DAX for potential swing highs in recent days. And I suspect they may be close, if not seen, already.
Matt Simpson, Market Analyst at City Index and Forex.com (StoneX)

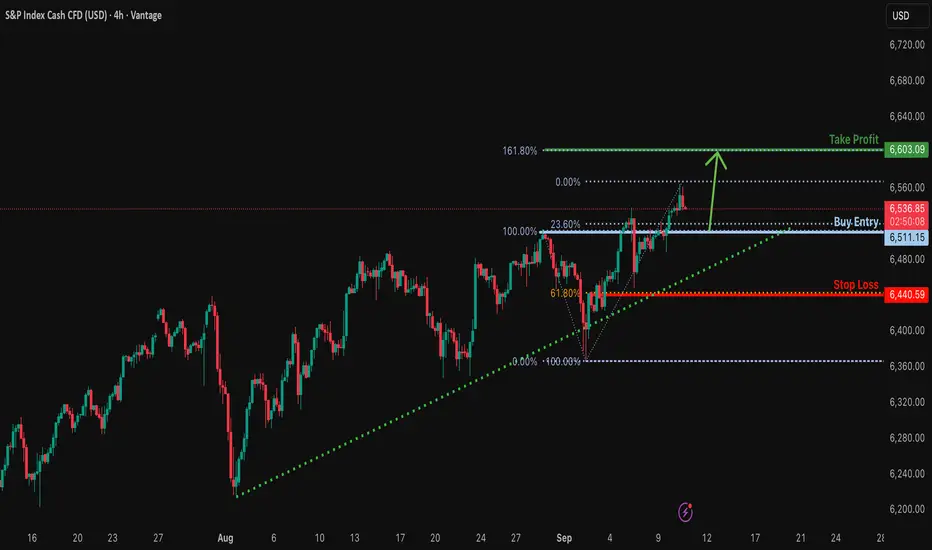
Bullish continuation setup?S&P500 is falling towards the support level, which is a pullback support that aligns with the 23.6% Fibonacci retracement and could bounce from this level to our take profit.
Entry: 6,511.15
Why we like it:
There is a pullback support that aligns with the 23.6% Fibonacci retracement.
Stop loss: 6,440.59
Why we like it:
There is a pullback support that aligns with the 61.8% Fibonacci retracement.
Take profit: 6,603.09
Why we like it:
There is a resistance level at the 161.8% Fibonacci extension.
Enjoying your TradingView experience? Review us!
Please be advised that the information presented on TradingView is provided to Vantage (‘Vantage Global Limited’, ‘we’) by a third-party provider (‘Everest Fortune Group’). Please be reminded that you are solely responsible for the trading decisions on your account. There is a very high degree of risk involved in trading. Any information and/or content is intended entirely for research, educational and informational purposes only and does not constitute investment or consultation advice or investment strategy. The information is not tailored to the investment needs of any specific person and therefore does not involve a consideration of any of the investment objectives, financial situation or needs of any viewer that may receive it. Kindly also note that past performance is not a reliable indicator of future results. Actual results may differ materially from those anticipated in forward-looking or past performance statements. We assume no liability as to the accuracy or completeness of any of the information and/or content provided herein and the Company cannot be held responsible for any omission, mistake nor for any loss or damage including without limitation to any loss of profit which may arise from reliance on any information supplied by Everest Fortune Group.
HCLTECH 3Hour Time frameHCL Technologies (HCLTECH) 3-Hour Snapshot
Current Price: ₹1,470.00
Change: +1.72% from the previous close
Intraday Range: ₹1,432.10 – ₹1,471.90
Volume: 2,495,658 shares traded
Market Cap: ₹3.97 trillion
P/E Ratio: 23.39
Beta: 1.04 (indicating moderate volatility relative to the market)
🔎 Key Levels
Resistance:
R1: ₹1,471.90 (recent high)
R2: ₹1,490.00 (next resistance zone)
Support:
S1: ₹1,432.10 (immediate support)
S2: ₹1,400.00 (next support level)
📈 Technical Indicators
RSI (14): 62.15 — Neutral to slightly bullish
MACD: Positive, indicating upward momentum
Moving Averages:
5-period SMA: ₹1,455.00 — Buy signal
50-period SMA: ₹1,440.00 — Buy signal
200-period SMA: ₹1,400.00 — Buy signal
📌 Market Sentiment
Catalysts: Positive momentum following recent gains and analyst upgrades.
Sector Performance: IT sector showing strength, with HCL Technologies leading gains among peers.
Options Activity: Significant trading in call options at ₹1,470 strike price, indicating bullish sentiment.
📅 Outlook
Bullish Scenario: A breakout above ₹1,471.90 could lead to a push toward ₹1,490.00 and higher.
Bearish Scenario: A drop below ₹1,432.10 may test support around ₹1,400.00.
Overall Bias: Moderately bullish, with positive momentum but facing near-term resistance.

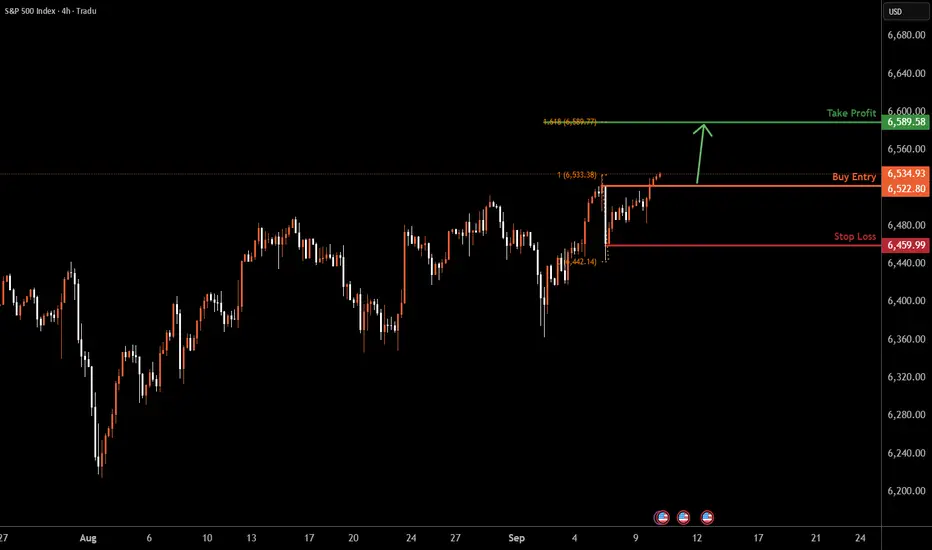
SPX500 H4 | Bullish continuationBased on the H4 chart analysis, we can see that the price has reacted off the buy entry which is a pullback support and could potentially rise from this level to the upside.
Buy entry is at 6,535.17, which is a pullback support.
Stop loss is at 6,459.99, which is a pullback support.
Take profit is at 6,589.58, which lines up with the 161.8% Fibonacci extension.
High Risk Investment Warning
Trading Forex/CFDs on margin carries a high level of risk and may not be suitable for all investors. Leverage can work against you.
Stratos Markets Limited (tradu.com ):
CFDs are complex instruments and come with a high risk of losing money rapidly due to leverage. 65% of retail investor accounts lose money when trading CFDs with this provider. You should consider whether you understand how CFDs work and whether you can afford to take the high risk of losing your money.
Stratos Europe Ltd (tradu.com ):
CFDs are complex instruments and come with a high risk of losing money rapidly due to leverage. 66% of retail investor accounts lose money when trading CFDs with this provider. You should consider whether you understand how CFDs work and whether you can afford to take the high risk of losing your money.
Stratos Global LLC (tradu.com ):
Losses can exceed deposits.
Please be advised that the information presented on TradingView is provided to Tradu (‘Company’, ‘we’) by a third-party provider (‘TFA Global Pte Ltd’). Please be reminded that you are solely responsible for the trading decisions on your account. There is a very high degree of risk involved in trading. Any information and/or content is intended entirely for research, educational and informational purposes only and does not constitute investment or consultation advice or investment strategy. The information is not tailored to the investment needs of any specific person and therefore does not involve a consideration of any of the investment objectives, financial situation or needs of any viewer that may receive it. Kindly also note that past performance is not a reliable indicator of future results. Actual results may differ materially from those anticipated in forward-looking or past performance statements. We assume no liability as to the accuracy or completeness of any of the information and/or content provided herein and the Company cannot be held responsible for any omission, mistake nor for any loss or damage including without limitation to any loss of profit which may arise from reliance on any information supplied by TFA Global Pte Ltd.
The speaker(s) is neither an employee, agent nor representative of Tradu and is therefore acting independently. The opinions given are their own, constitute general market commentary, and do not constitute the opinion or advice of Tradu or any form of personal or investment advice. Tradu neither endorses nor guarantees offerings of third-party speakers, nor is Tradu responsible for the content, veracity or opinions of third-party speakers, presenters or participants.
JPN225 H4 | Potential bullish continuationBased on the H4 chart analysis, we could see the price fall to the buy entry of 43,018.02, which is a pullback support that aligns with the 50% Fibonacci retracement and could bounce from this level to the upside.
Stop loss is at 42,488.03, which is a pullback support that is slightly below the 61.8% Fibonacci retracement.
Take profit is 43,887.74, which is a multi swing high resistance.
High Risk Investment Warning
Trading Forex/CFDs on margin carries a high level of risk and may not be suitable for all investors. Leverage can work against you.
Stratos Markets Limited (tradu.com/uk ):
CFDs are complex instruments and come with a high risk of losing money rapidly due to leverage. 65% of retail investor accounts lose money when trading CFDs with this provider. You should consider whether you understand how CFDs work and whether you can afford to take the high risk of losing your money.
Stratos Europe Ltd (tradu.com/eu ):
CFDs are complex instruments and come with a high risk of losing money rapidly due to leverage. 66% of retail investor accounts lose money when trading CFDs with this provider. You should consider whether you understand how CFDs work and whether you can afford to take the high risk of losing your money.
Stratos Global LLC (tradu.com/en ):
Losses can exceed deposits.
Please be advised that the information presented on TradingView is provided to Tradu (‘Company’, ‘we’) by a third-party provider (‘TFA Global Pte Ltd’). Please be reminded that you are solely responsible for the trading decisions on your account. There is a very high degree of risk involved in trading. Any information and/or content is intended entirely for research, educational and informational purposes only and does not constitute investment or consultation advice or investment strategy. The information is not tailored to the investment needs of any specific person and therefore does not involve a consideration of any of the investment objectives, financial situation or needs of any viewer that may receive it. Kindly also note that past performance is not a reliable indicator of future results. Actual results may differ materially from those anticipated in forward-looking or past performance statements. We assume no liability as to the accuracy or completeness of any of the information and/or content provided herein and the Company cannot be held responsible for any omission, mistake nor for any loss or damage including without limitation to any loss of profit which may arise from reliance on any information supplied by TFA Global Pte Ltd.
The speaker(s) is neither an employee, agent nor representative of Tradu and is therefore acting independently. The opinions given are their own, constitute general market commentary, and do not constitute the opinion or advice of Tradu or any form of personal or investment advice. Tradu neither endorses nor guarantees offerings of third-party speakers, nor is Tradu responsible for the content, veracity or opinions of third-party speakers, presenters or participants.

NAS100 H4 | bullish momentum to extendNAS100 has reacted off the buy entry at 23,720.82, which is a pullback support and could bounce from this level to the take profit.
Stop loss is at 23,572.15, which is a pullback support.
Take profit is at 24,065.29, which lines up with the 61.8% Fibonacci projection and the 138.2% Fibonacci extension.
High Risk Investment Warning
Trading Forex/CFDs on margin carries a high level of risk and may not be suitable for all investors. Leverage can work against you.
Stratos Markets Limited (tradu.com ):
CFDs are complex instruments and come with a high risk of losing money rapidly due to leverage. 65% of retail investor accounts lose money when trading CFDs with this provider. You should consider whether you understand how CFDs work and whether you can afford to take the high risk of losing your money.
Stratos Europe Ltd (tradu.com ):
CFDs are complex instruments and come with a high risk of losing money rapidly due to leverage. 66% of retail investor accounts lose money when trading CFDs with this provider. You should consider whether you understand how CFDs work and whether you can afford to take the high risk of losing your money.
Stratos Global LLC (tradu.com ):
Losses can exceed deposits.
Please be advised that the information presented on TradingView is provided to Tradu (‘Company’, ‘we’) by a third-party provider (‘TFA Global Pte Ltd’). Please be reminded that you are solely responsible for the trading decisions on your account. There is a very high degree of risk involved in trading. Any information and/or content is intended entirely for research, educational and informational purposes only and does not constitute investment or consultation advice or investment strategy. The information is not tailored to the investment needs of any specific person and therefore does not involve a consideration of any of the investment objectives, financial situation or needs of any viewer that may receive it. Kindly also note that past performance is not a reliable indicator of future results. Actual results may differ materially from those anticipated in forward-looking or past performance statements. We assume no liability as to the accuracy or completeness of any of the information and/or content provided herein and the Company cannot be held responsible for any omission, mistake nor for any loss or damage including without limitation to any loss of profit which may arise from reliance on any information supplied by TFA Global Pte Ltd.
The speaker(s) is neither an employee, agent nor representative of Tradu and is therefore acting independently. The opinions given are their own, constitute general market commentary, and do not constitute the opinion or advice of Tradu or any form of personal or investment advice. Tradu neither endorses nor guarantees offerings of third-party speakers, nor is Tradu responsible for the content, veracity or opinions of third-party speakers, presenters or participants.

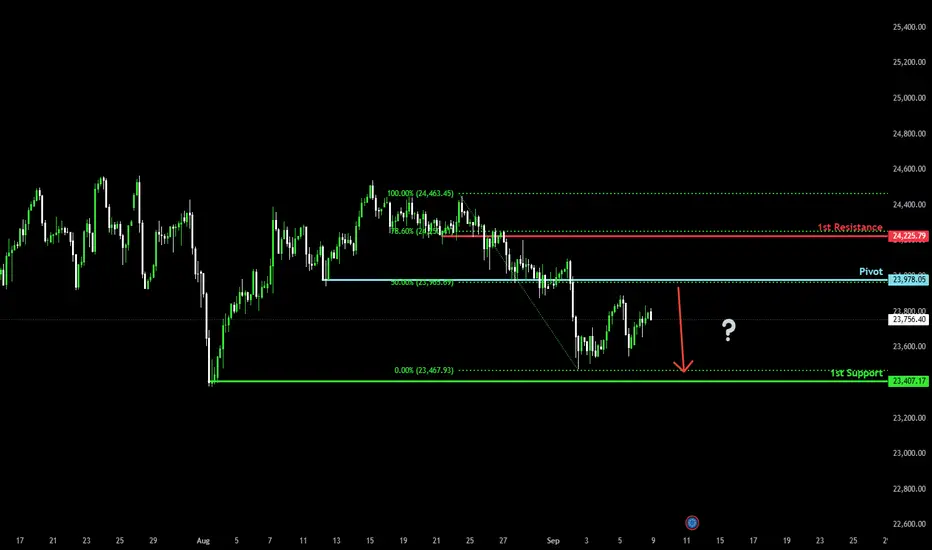
Bearish reversal signal on H4 chart?DAX40 (DE40) is rising towards the pivot and could reverse to the 1st support, which has been identified as a swing low support.
Pivot: 23,978.05
1st Support: 23,407.17
1st Resistance: 24,225.79
Disclaimer:
The above opinions given constitute general market commentary, and do not constitute the opinion or advice of IC Markets or any form of personal or investment advice.
Any opinions, news, research, analyses, prices, other information, or links to third-party sites contained on this website are provided on an "as-is" basis, are intended only to be informative, is not an advice nor a recommendation, nor research, or a record of our trading prices, or an offer of, or solicitation for a transaction in any financial instrument and thus should not be treated as such. The information provided does not involve any specific investment objectives, financial situation and needs of any specific person who may receive it. Please be aware, that past performance is not a reliable indicator of future performance and/or results. Past Performance or Forward-looking scenarios based upon the reasonable beliefs of the third-party provider are not a guarantee of future performance. Actual results may differ materially from those anticipated in forward-looking or past performance statements. IC Markets makes no representation or warranty and assumes no liability as to the accuracy or completeness of the information provided, nor any loss arising from any investment based on a recommendation, forecast or any information supplied by any third-party.
DAX, FTSE 100 Technical OutlookThe DAX is on the ropes and considering a break of support. If bears succeed, it could signal a deeper pullback for the FTSE 100.
Matt Simpson, Market Analyst at City Index
