BTC - Path of least resistance and maximum painI'm not a conspiracy nut but giving room for belief in conspiracy theories, let's say the entire crypto market is a "washing machine" for various fronts. It just doesn't have any practical utility right now, that makes the world a better and safer place. The possibilities are endless but let's just say it hasn't been leveraged for any noble cause, yet. Sakamoto Natoshi would be turning in his grave should he know what his noble invention was being used for, if indeed it was a noble act from the get go.
Bottomline, it has a shade to it's existence, and as such can only be construed to serve malicious intentions of governments, authorities and the rich.
So it is always bound to opt the path of least resistance and maximum pain, as far as common folk are concerned, i.e. acting against them.
Now stepping into reality, considering common folk, retail traders and institutions who are involved in this charade.
Common folk: I meet people constantly who have never heard of bitcoin, also people who learnt about it's existence just now in 2024!
A subset of this common folk with some grasp of how world economics work and an appetite for risk want a piece of the action.
Retail Traders: I'm not sure if the term "retail traders" also encompasses the so called "whales". I'm assuming not. So let's say everyone working with a portfolio value of 1BTC or less. From this category (at least the sensible and well educated) never expected what happened in the first 3 months of 2024.
But now that we are where we are, they also want a piece of the action(including myself), knowing very well they could be too late at the scene.
Institutions: All the hedge funds and their 60+ grandpa managers who do not understand technology are also now a part of this charade, in addition to various tech companies and their CEOs, playing we know it all.
"Apparently" the whole rally is attributed to the ETF inflows from said institutions. And somehow there is this sense of unshakable faith in the air, if these institutions are already invested, BTC is bound for the moon and it can never look back again. There are preposterous articles on how any price below 70k was a buy!
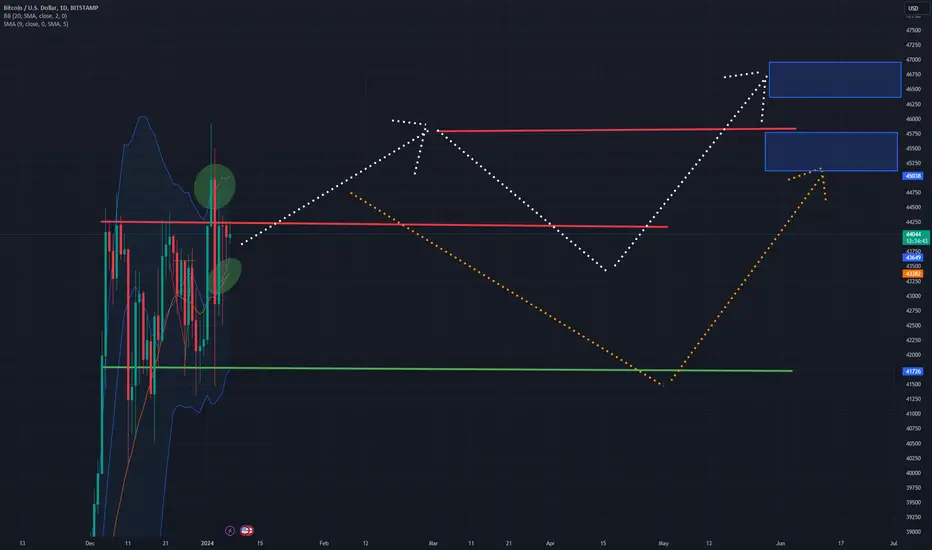
Everything mentioned so far isn't an established fact! Let's now turn to tangible facts we know, our dear charts! Hoping and praying to the good lord, that this data is also not fabricated.
The 12 month candle on the left is as big as it's ever gotten. We still have 7 months left to go until the candle closes. And looking at the volume, we are at 450k on this particular exchange, compared to an average of ~2 million on previous full candle.
Assuming half a million traffic per quarter, this volume does make a lot of sense but what it doesn't correlate to, is the ETF's inflows. If anything, it should be double or triple the average based on all the news about the kind of money that's been inflowing. Very skeptical!
If I were any sensible and should I consider myself in the position of a market maker, I see a lot of paths testing and breaking supports(the beaten path), rather than price discovery(the road not taken). Because,
-who dares to buy any further?!
-retail is already late to the party, don't want that portfolio eroding
-institutions are "supposedly" already invested, who are they going to sell it too? They should be idiots to buy it all over again all the way to 100k, coz if nobody wants to buy now, who's gonna buy at 100k?!
-halving has reduced the supply, there is less supply for the next 3 quarters than the previous 12 month candles and it makes sense to buy/sell lower again than at the 100k or 130k area
On the contrary, looking at the perspective of taking bitcoin away from the common folk's reach, it does make sense to drive the price into the 6 figures. But then again, if you take it away from the common folk's reach, how is the so called "evil system", that's basically designed to prey on simple minds, supposed to work?!
I know, I know, I'm rambling! The point is, I don't see this going to the moon any time soon! And I could be completely wrong about this and may have already fallen for the trap that's set for all of us! Time will only tell.
Heartfelt thanks to anyone who's managed to reached thus far, please leave a like if you did like the read or teach me a swear word in your mother tongue down in the comments, for wasting your time! Peace!
Institutional

Eurusd Trading setup institutional tacticshello traders this is my 1:20 Risk reward trading setup
discipline: institutional tactics
if you like my free signals hit the like button , follow ,subscribe and show some love ❤️
wish you good luck and good trading

GBPUSD short setuphello traders this my trading setup
Strategy : institutional tactics
If you like my idea please hit the like button, follow and show some love
wish you good luck and good trading

ETHUSDT: A big move in making! Dear Traders,
First small bullish correction and then drop towards $2500 region, which will remain a key area for most of the institutional sellers. We also need to have different bias, where price may not make any corrections and just continue dropping from current area. Good Luck and Trade Safe.

75: BTC Hits Target of $62K, What Can We Expect Next?Bitcoin has once again surged to new heights, hitting the anticipated target of $62,000. As traders, it's crucial to reassess our strategies and expectations in light of this milestone.
Technical Analysis: Following an extended bullish run, it's reasonable to anticipate a slowdown and a potential pullback. Taking profits at this juncture might be a prudent move. Key support levels to monitor are at $46,000 and $30,000, which have historically demonstrated significance in Bitcoin's price action.
Upside Potential: Despite the possibility of a slowdown, the bullish momentum remains palpable. With institutions continuing to pour funds into the market, the upside potential remains considerable. Setting our sights on $95,000 as the next major target seems justified, considering the ongoing institutional interest and broader market sentiment.
Institutional Influence: It's essential to acknowledge the increasing involvement of institutional players in the cryptocurrency space. While their influx of capital has undoubtedly contributed to Bitcoin's meteoric rise, it's worth noting that their positions are continuously growing. This suggests that the current bullish trend may still have room to evolve further.
Price Action Outlook: While a pullback would align with traditional market dynamics, Bitcoin has repeatedly defied expectations with its volatility and resilience. Hence, while a clean pullback is a plausible scenario, there's also the possibility of the upward trajectory persisting.
In summary, while it's prudent to prepare for a potential slowdown and consider taking profits, the overall outlook for Bitcoin remains bullish. With institutional interest showing no signs of abating, the path to $95,000 seems increasingly plausible. However, it's essential to remain vigilant and adaptable in response to evolving market dynamics.

BTC - Institutional Accumulation Zone Signals Trend ReversalThe Bitcoin futures market is showing signs of a potential reversal short-term bearish impulse, with institutional traders accumulating positions in a newly identified accumulation zone. This zone, marked on the chart, represents an area where large buyers have been actively buying BTC futures contracts.
The accumulation zone has been formed after a period of consolidation and sideways trading, following a sharp downtrend. The fact that institutional traders are accumulating in this zone suggests that they believe the downtrend is coming to an end and that a new uptrend is about to begin.
Furthermore, we should observe a key resistance level marked on chart, which can adds further credence to the bullish outlook. This breakout would signal that the sellers have been exhausted and that the buyers are now in control.
If the price action can continue to trade above the resistance level, it will be a strong indication that the downtrend has ended and that a new uptrend is underway. Traders should watch for a retest of the resistance level as a potential buying opportunity.

GBPNZD BULLISH RUN????Creating bullish structure on the daily and 4H, we have buyside liquidity above and a clear high that needs to be taken, using ltf confirmation we could see serious bullish moves to the upside

BTCUSD - INSTITUTIONAL BUYING ZONE1. A breakout is about to happen at the support level.
2. A false breakout is when the institutions enter the market at respective level either support or resistance level.
3. But big institutions resist the breakout by buying huge quantities there forming a false breakout.
4. It was the right time to follow their footsteps.

BCTUSD - INSTITUTIONAL BUYING ZONE1. A breakout is about to happen at the support level.
2. A false breakout is when the institutions enter the market at respective level either support or resistance level.
3. But big institutions resist the breakout by buying huge quantities there forming a false breakout.
4. It was the right time to follow their footsteps.

Ethereum - INSTITUTIONAL BUYING ZONE1. A breakout is about to happen at the support level.
2. A false breakout is when the institutions enter the market at respective level either support or resistance level.
3. But big institutions resist the breakout by buying huge quantities there forming a false breakout.
4. It was the right time to follow their footsteps.

Supply in Control |GBPUSD exhibit a sell momentumafter the tap rejection on the supply zone a sell momentum took place which could indicate a possibility of a sell sentiment.
I expect GBPUSD to sell to 1.25968 liquidity .

Adoption: Institutions' Positive Sentiment Awaiting BTC ETFsAdoption: Institutions' Positive Sentiment Awaiting BTC ETFs
Dear Esteemed Traders,
One reason why Bitcoin price could go above $4600 in the next three months is the increasing institutional adoption of the cryptocurrency. According to a survey by Bitwise, almost 90% of financial advisors plan to buy Bitcoin after the approval of spot BTC ETFs. This could create a huge demand for Bitcoin and drive its price higher. Additionally, some institutions such as MicroStrategy, Tesla, and Square have already invested billions of dollars in Bitcoin and are holding it as a reserve asset. This could reduce the supply of Bitcoin and increase its scarcity value.
Another reason why Bitcoin price could go above $4600 in the next three months is the positive technical outlook of the cryptocurrency. Bitcoin is currently trending bullish on the four-hour time frame, with the 50-day and 200-day moving averages sloping up. The RSI is also within the neutral zone, indicating that the price has room to grow without being overbought or oversold. Moreover, Bitcoin has formed an ascending triangle pattern on the weekly chart, which is a bullish continuation pattern that suggests a breakout to the upside. If Bitcoin can break above the resistance line of the triangle, it could reach record highs, according to the measured move technique.
Of course, these are not the only factors that could affect the price of Bitcoin in the next three months. There are also some risks and uncertainties that could cause the price to drop, such as regulatory hurdles, market volatility, cyberattacks, and competition from other cryptocurrencies. Therefore, it is important to do your own research and analysis before making any investment decisions.
Disclaimer: This is not investment advice. The information provided is for general information purposes only. No information, materials, services, or other content provided on this page constitutes a solicitation, recommendation, endorsement, or any financial, investment, or other advice. Seek independent professional consultation in the form of legal, financial, and fiscal advice before making any investment decision.
Kind Regards,
Ely
DAILY ANALYSIS // Jan 5, 2024 [ #EURUSD ]Hey traders! 👋 Today's scoop on EURUSD:
🔍 Swing Check: The recent swing didn't convincingly close high up.
🚀 Looking for Longs: For potential gains, watch out for a higher high inside. It signals a shift in direction, making it a good time to consider going long.
Stay sharp, watch those charts, and happy trading! 🌐💰 #ForexTips #EasyTrading #EURUSDUpdate
D |
4H |
15M |


potential reversal zone D1 or D2|EURUSD at weakly supply zone 1.06500 and 1.05241 liquidity taking creates the weekly supply zone thus expecting a reversal to 1.08307 or 1.07596 - 1.06534 demand zone

Weekend Market Maker Buy Model in ETHPrice's trades a 4h BISI + 4h OB as part of a second accumulation in a possible MMSM in the 1D timeframe. This is important because it frames the context behind the trade idea. I'm ultra-cautious about this because it's the weekend, and price can do whatever.

Market Maker buy model on ETHGood day, today im following this scenario maybe to taking place in ETH this week.
However this is a "set up" only if the prices makes a Market Maker Reversal on the Key level (Breaker Block 4h + C.E NWOG).

$COUR showing Relative Strength Keep an eye on this one as it's showing a lot of Relative Strength and Accumulation.
It recently broke into its stage 2 up trend and it's resisting the general market moves and showing signs of institutional demand.
Given the current market conditions, this may continue to range between 17.5 to 18.5.
We might see a flush of late buyers and might see a dip to the ~16.5/3 area.

GBPUSD potential Sell On Liquidity GrabGBPUSD is on bearish sentiment expecting more sell off after taking liquidity at 1.27147 or 1.27410 in to the supply zone expecting GU to reach a target 1.26243 demand zone

Virgin Galactic (SPCE) - Q2 Interest - Potential Accumulation 📊 Fundamental Analysis:
Virgin Galactic has been gaining attention in the market due to a positive Q2 performance. The company's strong quarterly results have sparked interest among investors, potentially indicating positive growth prospects ahead.
📈 Technical Analysis:
The chart above illustrates a potential Wyckoff accumulation phase for SPCE. The price action appears to be forming a classic Wyckoff pattern, suggesting a potential bullish reversal. We've seen a series of higher lows forming over time, indicating increasing buying interest.
🔄 Anticipating the Spring Phase:
The final confirmation for the Wyckoff accumulation pattern often comes with the "Spring" phase, which involves a liquidity grab at the bottom. In this case, we're watching for a potential dip to the 0.272 Fibonacci level around $2.36. This could act as the liquidity grab, setting the stage for a potential bullish move.
📈 Bullish Confirmation:
To confirm the bullish scenario, we're looking for a higher high (an outbreak) in the price action, potentially around the $8 to $10 range. This breakout would validate the accumulation phase and signal a potential trend reversal.
🔍 Key Levels to Watch:
Support: 0.272 Fibonacci at $2.36
Breakout Confirmation: $8 to $10 range
Let's discuss in the comments below! What are your thoughts on SPCE's potential accumulation phase and breakout scenario? Share your insights!

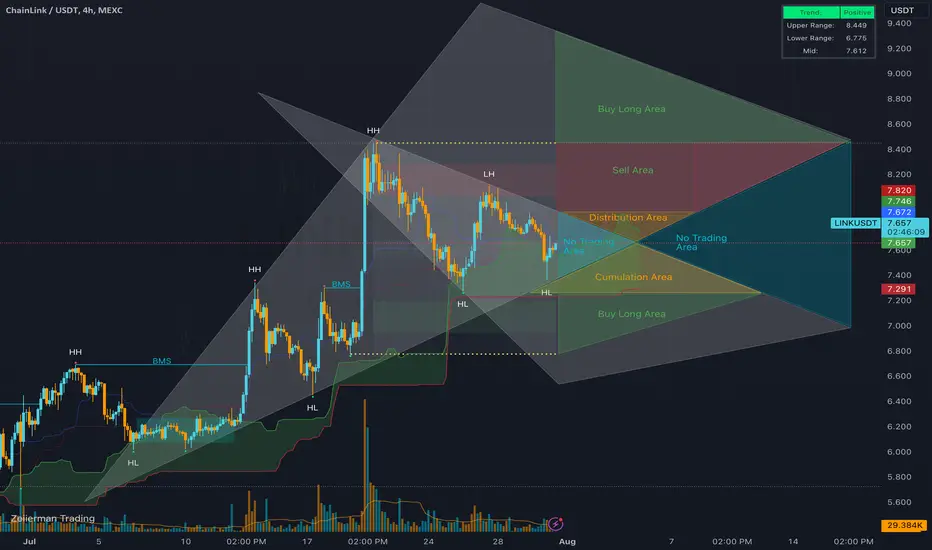
Can Someone Make an Institutional Script?I need someone to make a script that can constantly update its drawings and move these triangle area's around in real time so that i dont have to constantly change the triangles constantly, which requires a lot of time. If somebody could make a pine script that automates these drawings up to 30-100 periods in the futures then that would be a very powerful institutional trading tool!
#gold/USD long setup on 4h chartHello guys I wish you best.
This setup is made by SMC concepts, I hope it helps you.
Quick reminder (there is no 💯 accurate in trading).
Like if you this idea thanks.
Cheers 🥂.
