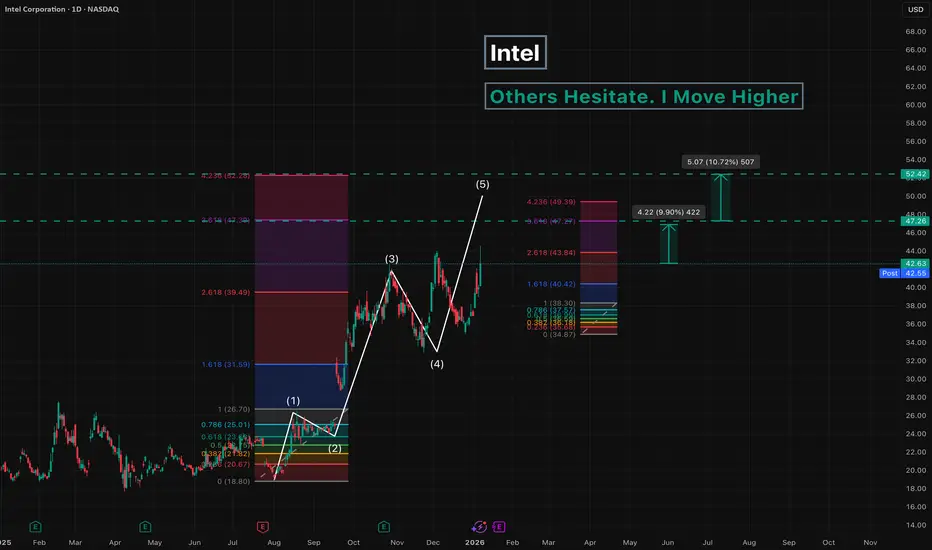
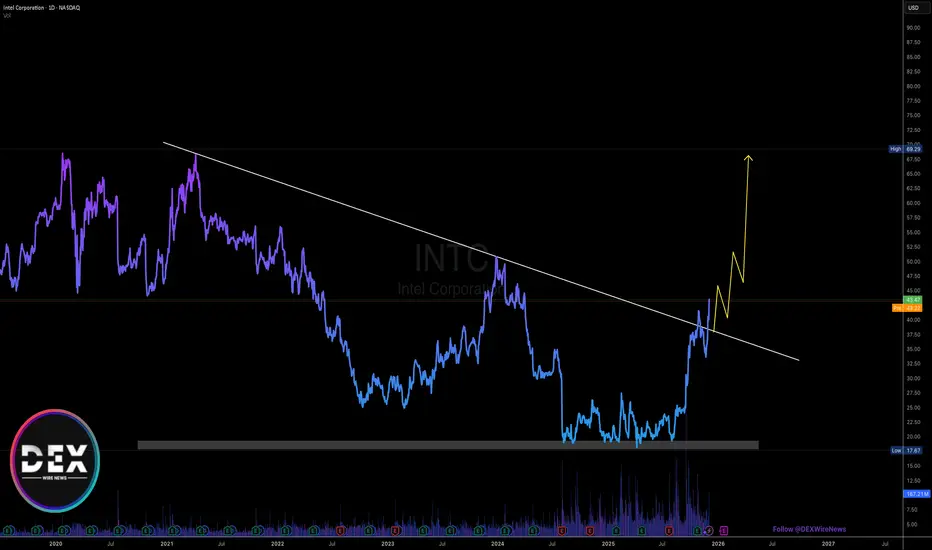
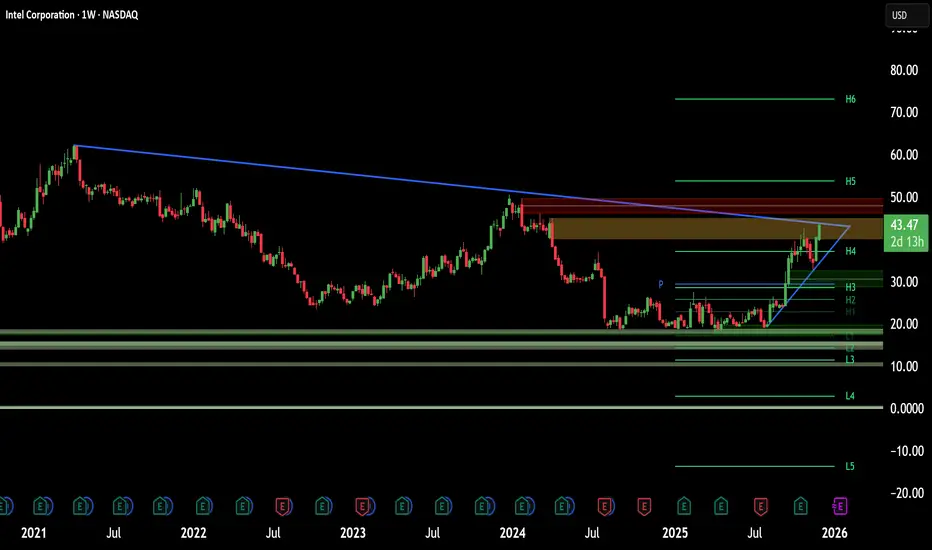
Intel - Others Hesitate. I Move HigherSince August 2025, Intel has been in an uptrend.
Only the final fifth wave remains to be completed.
The upside potential is estimated at 10-23% .
Key targets:
47
52
---
Please subscribe and leave a comment.
You’ll get new information faster than anyone else.
---
INTC
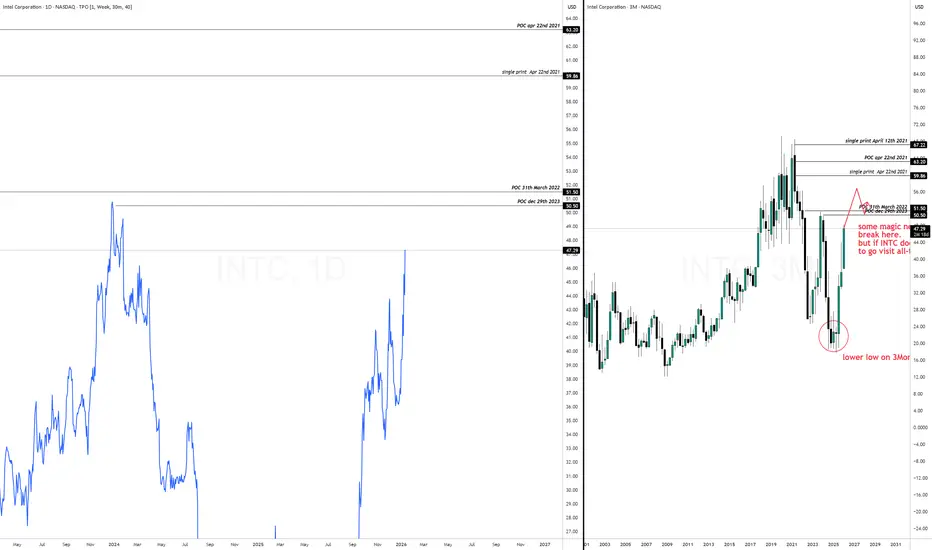
INTC 1/13/2026Next targets are $50.50 POC Dec 29th 2023 and $51.50 POC POC March 31th 2022
then we should be having some period of consolidation followed by a move to all time high. Weekly and Monthly charts will show us the outcome.
Caution advised as we had printed lower low on a 3-month chart (long term chart)
Intel - Here comes the bullish breakout!💾Intel ( NASDAQ:INTC ) will soon break out:
🔎Analysis summary:
During 2025, Intel has over and over again been retesting major support. That was exactly the reason why I told everyone to enter longs here on Intel. Just a couple months later we witnessed a +150% rally and Intel is about to create another bullish breakout soon.
📝Levels to watch:
$45 and $70
SwingTraderPhil
SwingTrading.Simplified. | Investing.Simplified. | #LONGTERMVISION

INTC – What Price and Volume Are Telling Us ?INTC - CURRENT PRICE : 37.40 - 37.60
INTC is currently undergoing a controlled pullback within a broader rising structure, as indicated by the rising trendline support (white dashed line). Notably, the recent price decline is accompanied by diminishing volume, which suggests that selling pressure is losing momentum rather than aggressive distribution.
This type of price-down / volume-down behavior typically reflects profit-taking and short-term exhaustion by sellers, often seen during healthy corrections within an uptrend. As long as price continues to respect the rising trendline, the broader bullish structure remains intact.
From a volume perspective, there is no evidence of panic selling, while prior upswings were supported by higher relative volume — reinforcing the view that buyers remain in control at higher timeframes.
Take note that stochastic oscillator is approaching near oversold zone. In an uptrend, any oversold condition may be considered as a potential buy on dips.
Trading Plan (Price & Volume Based)
Buy on pullback near the rising trendline support
ENTRY PRICE : 36.00 - 37.00 zone
Upside Targets:
🎯 Target 1: 40.00 (near-term resistance)
🎯 Target 2: 44.00 (prior swing high)
🧊 Cut Loss: Below 33.00, which would signal a breakdown of trend support.

Intel (INTC) shares surge following chip unveilingIntel (INTC) shares surge following chip unveiling
Intel (INTC) shares jumped above $44.30 yesterday, marking a 21-month high. The rally was driven by news from CES 2026, where the company unveiled its new Core Ultra Series 3 processors (codenamed Panther Lake). These are Intel’s first consumer chips manufactured using the advanced Intel 18A process technology.
Market participants interpreted the announcement as evidence that Intel’s ambitious turnaround strategy to restore its technological leadership is gaining traction. The launch of the 18A node suggests that Intel is once again capable of competing with TSMC on the leading edge of semiconductor manufacturing.
According to media reports, several analysts have raised their price targets for INTC shares, as the new technology opens up the prospect for Intel to secure contract manufacturing orders from major players such as Nvidia and Apple.
Technical analysis of INTC shares
On 3 December, when analysing the INTC chart, we:
→ identified a broad long-term price channel;
→ highlighted the importance of the $20 level, which appeared to act as support from institutional investors;
→ noted that the line dividing the upper half of the channel into two quarters could function as resistance.
As indicated by the red arrow, this line has indeed acted as a reliable barrier to further upside. Volume analysis is particularly noteworthy: on two occasions when INTC shares rallied towards this level, we observed:
→ a surge in trading volumes;
→ followed by a subsequent pullback.
It is possible that the move above the psychological $40 level, combined with positive news flow, generated FOMO-driven demand. Institutional traders may be using this demand to lock in profits on long positions accumulated around the $20 zone.
Given the long upper wick on yesterday’s candlestick, we could assume that the identified resistance line may hold, and that a third attempt to break above it could once again result in a pullback.
This article represents the opinion of the Companies operating under the FXOpen brand only. It is not to be construed as an offer, solicitation, or recommendation with respect to products and services provided by the Companies operating under the FXOpen brand, nor is it to be considered financial advice.
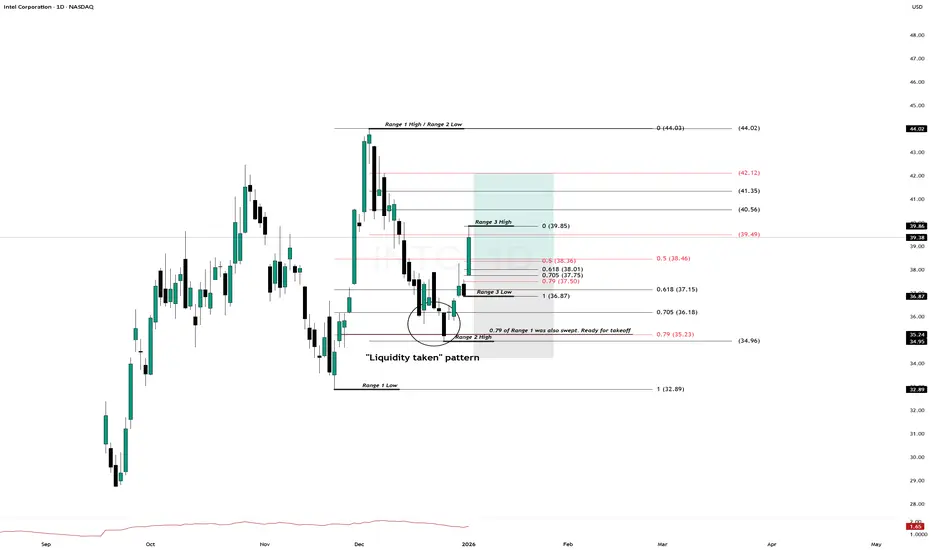
INTC 1/2/2026Hypothethical 0.91R Trade
Entry is at 0.5 of the Range 3
Stop loss is at $34.24 since current Daily ATR is 1.65
Trade is valid for 1 day. If not filled until EOD of next Monday then the trade is cancelled.
INTC Weakness Exposed — Are Sellers Still In Control?🔥 INTC Bearish Profit Play — Smart Money Thief Mode Activated?
📌 Asset
INTC — Intel Corporation
NASDAQ Exchange | Stock Market Profit Playbook
🕒 Swing Trade / Day Trade Setup
🧠 Market Bias
📉 Primary Bias: Bearish
Price structure shows weak momentum, failed bullish continuation, and distribution behavior near resistance. This setup favors controlled downside continuation rather than aggressive longs.
🎯 Trade Plan (Bearish Thief Setup)
🔑 Entry
📍 Flexible Entry Zone
➡️ Any favorable price level aligned with bearish confirmation
(Structure break, rejection, or weak bounce)
🛑 Stop Loss
⚠️ Thief-Style SL: 38.00
Dear Ladies & Gentlemen (Thief OGs),
This stop-loss level is NOT a recommendation.
Risk management is your own responsibility — trade at your own risk and adjust according to your strategy.
🎯 Take Profit Zones
Primary Target 🎯
✅ TP-1: 34.00
Extended Target (Escape With Profits) 💰
🚀 TP-2: 31.00
📌 Why TP-2 matters:
Strong historical support zone
Oversold conditions likely to appear
Potential trap & reaction bounce
Broader market correlation suggests profit-taking is wise here
Dear Ladies & Gentlemen (Thief OGs),
These targets are NOT mandatory.
Secure profits based on your own plan and risk tolerance.
🔍 Technical Breakdown (Clean & Professional)
📉 Lower-High Structure intact
❌ Failed bullish continuation
📊 Weak volume on pullbacks
🧠 Distribution near resistance
🔄 Correlation with tech sector weakness
This supports a sell-the-rally / continuation downside approach rather than bottom-fishing.
🔗 Related Pairs & Correlation Watchlist
Keep an eye on these correlated instruments 👇
NASDAQ:NDX (Nasdaq-100)
➝ Tech weakness usually accelerates downside in INTC
NASDAQ:SOXX (Semiconductor ETF)
➝ Sector confirmation strengthens bearish conviction
NASDAQ:NVDA / NASDAQ:AMD
➝ Relative strength comparison — INTC underperformance adds pressure
TVC:DXY (US Dollar Index)
➝ Strong USD often pressures equities, especially tech
📌 If these pairs remain weak, INTC downside probability increases.
🧠 Master Trader Notes
This is NOT financial advice
No prediction — only reaction
Capital preservation > hero trades
Take profits when market offers them
If anything here feels aggressive, scale down — the market will always give another setup.
✨ “If you find value in my analysis, a 👍 and 🚀 boost is much appreciated — it helps me share more setups with the community!”
⚠️ Disclaimer
This is a thief-style trading strategy just for fun.
Educational & entertainment purposes only.

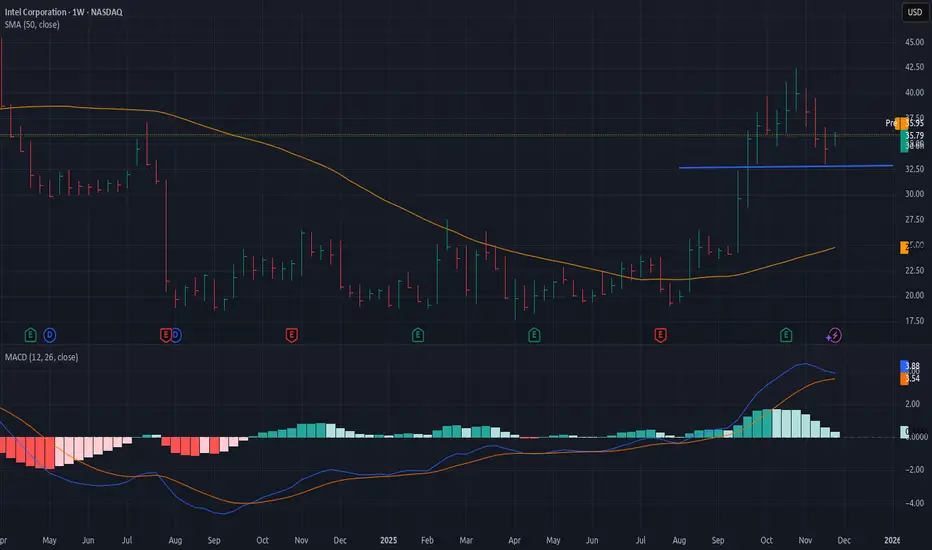
$INTC Is Extremely Oversold ... and frustrating
- Every time that Intel is oversold on Williams indicator, meaning -80 to -100 (current is -91.62 - extremely oversold), it bounces hard
- I have highlighted every instance since November 2024, where the momentum indicator was at oversold levels - and every single time came a massive bounce / rally
- It has been a frustrating downtrend, but every single indicator is showing bullish momentum
-- In fact, the 100 and 200 day moving averages are still rising, and has maintained the golden cross since late September
-RSI-based MA is going to converge with RSI levels over the next 2 weeks, as RSI rises - looking for volume buyers
The market is great at convincing you that "it's over". Until it isn't. Price moves sentiment.
Inevitable that Intel will bounce on this uptrend I have highlighted.
INTC - Cup and Handle A cup and handle pattern forming on this Weekly timeframe for INTC
Good opportunity to get in on these lows before price goes back up, forming the handle
Using the bars pattern to show my thoughts on potential future price action
Cup and Handles are considered bullish patterns

Intel - This behavior is wonderful!🎉Intel ( NASDAQ:INTC ) respects all structure:
🔎Analysis summary:
Just in the end of 2024, Intel perfectly retested a major long term horizontal support. After we then witnessed bullish confirmation, it was so obvious, that Intel will create a move higher. Now, Intel rallied +120% and is ready for a shorter term correction now.
📝Levels to watch:
$45
SwingTraderPhil
SwingTrading.Simplified. | Investing.Simplified. | #LONGTERMVISION

INTCStocks rally after rumors of chip production for Apple and why fundamental problems lurk behind the hype.
Rumors of a partnership are indeed developing, but without official confirmation and with a very long horizon
Key caveat: this only applies to manufacturing (fabrication), not design. Apple will continue to design chips, and Intel will become a manufacturer alongside TSMC.
The report clearly reveals systemic problems
Intel Foundry—a budget hole.

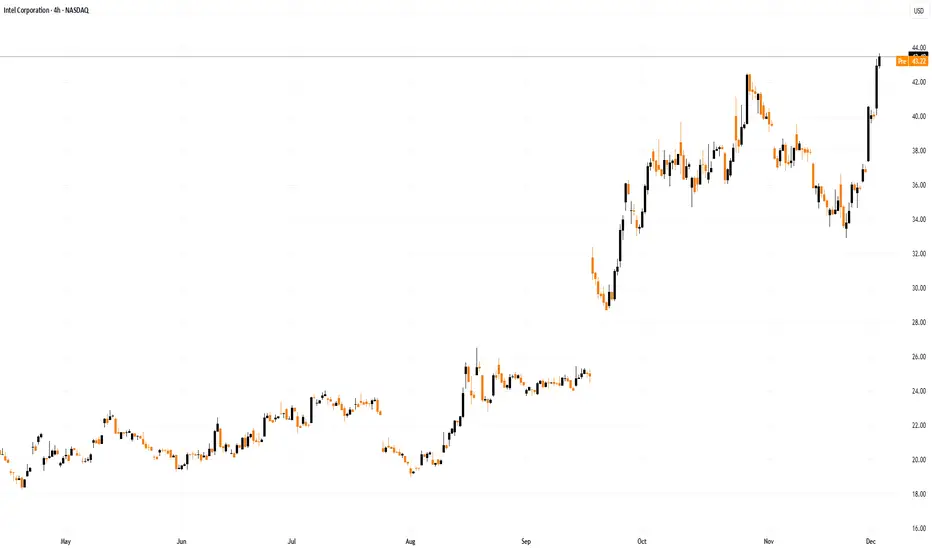
Breaking: Intel Corporation (INTC) Surge 8.6% Set for $70 MoveThe price of Intel Corporation (NASDAQ: NASDAQ:INTC ) saw a noteworthy uptick of 8% in Tuesday's extended trading session breaking out of the ceiling of a symmetrical triangle- eyeing the $70 resistant amidst increase in bullish sentiment.
The rise came as the S&P 500 and the Nasdaq Composite jumped 0.2% and 0.5%, respectively.
Intel's stock continued to climb tod, driven by Friday's unconfirmed report that the chipmaker is set to begin manufacturing semiconductors for Apple's MacBook Air and iPad Pro.
If the report is confirmed, it would be a massive win for the embattled chipmaker. Intel once dominated the semiconductor industry with its efficient CPUs, but it has fallen behind in the era of artificial intelligence (AI), a technology that is powered primarily by GPUs. A vote of confidence from Apple would go a long way in aiding the company's turnaround efforts.
About INTC
Intel Corporation designs, develops, manufactures, markets, and sells computing and related products and services worldwide. It operates through Intel Products, Intel Foundry, and All Other segments. The company offers microprocessor and chipset, stand-alone SoC, and multichip package; Computer Systems and Devices; hardware products comprising CPUs, graphics processing units (GPUs), accelerators, and field programmable gate arrays (FPGAs); and memory and storage, connectivity and networking, and other semiconductor products.
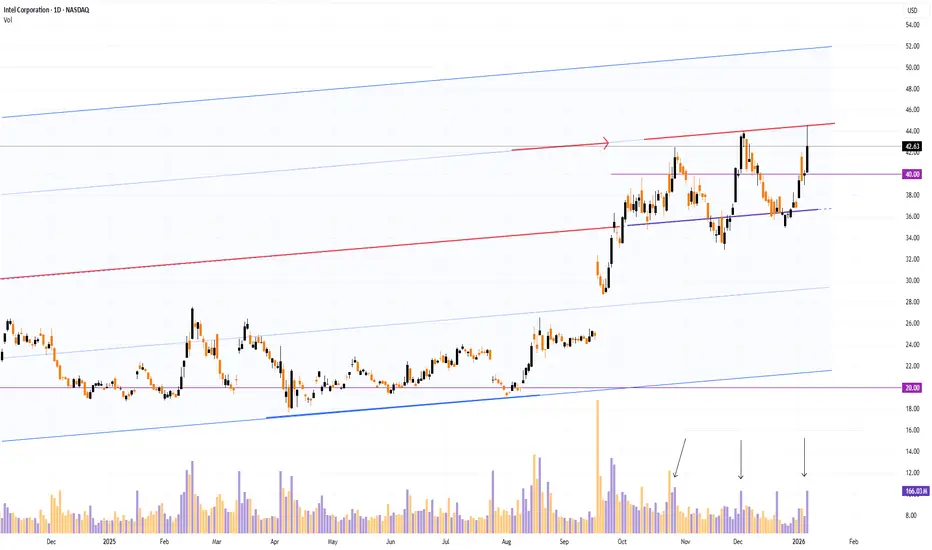
Intel (INTC) Shares Trade Above $40Intel (INTC) Shares Trade Above $40
Earlier, we highlighted the factors that helped Intel (INTC) shares recover strongly in 2025, including support from the U.S. government, leadership changes, investment from Japanese conglomerate SoftBank Group, and more.
According to recent reports, Intel could gain a major new client in Apple (AAPL). Yahoo Finance cites analyst Ming-Chi Kuo, who stated on X that Intel’s prospects have “improved significantly.” Intel may begin producing chips for Apple as early as 2027, potentially reducing reliance on Taiwan’s TSMC.
Although there are no official confirmations, sentiment on the market is positive. Since the start of last week, INTC shares have risen by over 20%, reaching their highest level since spring 2024, breaking past the psychological $40 mark.
Technical Analysis of INTC
Six months ago, INTC’s chart showed $20 as a key support level, backed by major investors. Since then, the stock has formed an ascending channel (shown in blue), which was extended upwards in September.
Bulls have steadily asserted control, pushing the price to higher levels, with support at $30 and later the channel’s median. After a brief consolidation in late November, the $40 level was breached.
Currently, the price sits near a line dividing the upper half of the channel into quarters, which may act as resistance, especially given signs of overbought conditions on key technical indicators.
If Intel’s strategic collaboration with Apple is officially confirmed, it could generate around $1 billion in revenue, leaving the current technical levels on the chart far below the potential upside.
This article represents the opinion of the Companies operating under the FXOpen brand only. It is not to be construed as an offer, solicitation, or recommendation with respect to products and services provided by the Companies operating under the FXOpen brand, nor is it to be considered financial advice.
Is Intel’s Apple Deal the Ultimate Pivot?Intel (NASDAQ: INTC) stock soared over 116% this year. Reports suggest Apple may use Intel’s foundry by 2027. We analyze the drivers behind this potential resurrection.
Geopolitics & Geostrategy: The Stability Premium
In a volatile world, Intel offers a "stability premium." TSMC’s concentration in Taiwan risks Western supply chains. The US government now holds a ~10% stake in Intel. This actively incentivizes domestic production to secure the grid. Apple chooses Intel to hedge against geopolitical friction. This move aligns with US strategic interests, treating Intel as a sovereign asset.
Management & Leadership: The Tan Effect
CEO Lip-Bu Tan drives a massive cultural shift. He replaced Pat Gelsinger’s engineering vision with operational discipline. Tan prioritizes customer listening, an area where Intel historically struggled. This pivot is paying off. Securing Apple proves Intel is shedding its "arrogant" legacy. It is becoming a true service-oriented foundry.
Technology & Innovation: The 18A-P Advantage
The deal relies on Intel’s **18A-P process technology**. Apple aims to use this for entry-level M-series chips. This validates Intel's aggressive manufacturing roadmap. Additionally, the Trump administration invested $150 million in xLight. This startup develops next-gen lithography lasers to aid chipmaking. It reinforces the ecosystem surrounding Intel’s manufacturing capabilities.
Business Models: The Foundry Pivot
Intel is transforming from a product company to a hybrid foundry. Analysts estimate the Apple deal could generate ~$1 billion annually. However, the "Apple Seal of Approval" is worth far more. It signals to giants like Qualcomm that Intel is ready. It also creates leverage against TSMC’s pricing power.
Final Verdict: The Apple rumors convert Intel into a legitimate turnaround play. US geopolitical interests align with the new leadership. Validated technology suggests Intel’s worst days are likely over.
Bullish Thesis for INTC Intel Stock in 2025If you haven`t bought INTC before the previous earnings:
Now Intel INTC is positioned for a potential turnaround and upside by the end of 2025, driven by strategic leadership changes, foundry business expansion, AI innovation, and favorable geopolitical dynamics. Here’s why INTC could head higher this year:
1. Leadership Transformation and Strategic Vision
The appointment of Lip-Bu Tan as CEO in March 2025 has injected new optimism into Intel’s prospects. Tan is a respected semiconductor industry veteran, and his arrival was met with a 10% jump in INTC’s share price, reflecting renewed investor confidence in the company’s direction.
2. Foundry Business Expansion and Government Support
Intel’s pivot toward a foundry-centric model is gaining momentum. The company is leveraging its U.S.-based manufacturing footprint to attract domestic and international clients, especially as geopolitical tensions and trade restrictions make U.S. chip production more attractive.
There is speculation about strategic partnerships, such as TSMC potentially acquiring a stake in Intel’s foundry operations, which could accelerate technology transfers and client wins.
The U.S. government is likely to continue supporting domestic semiconductor manufacturing through incentives and tariffs, directly benefiting Intel’s foundry ambitions.
3. AI and Next-Gen Product Launches
Intel is aggressively targeting the AI and data center markets. The upcoming Jaguar Shores and Panther Lake CPUs, built on the advanced 18A process node, are set for release in the second half of 2025. These chips will be available not only for Intel’s own products but also for external clients like Amazon and Microsoft, expanding the addressable market.
Intel’s renewed focus on AI accelerators and competitive cost structures could help it regain share in high-growth segments.
4. Financial Resilience and Market Position
Despite recent setbacks, Intel remains a dominant player in the PC CPU market and continues to generate substantial revenue, outpacing some key competitors in the latest quarter.
Analysts have revised their short-term price targets upward, with some projecting INTC could reach as high as $62—a potential upside of over 170% from current levels.
Forecasts for 2025 suggest an average price target in the $40–$45 range, with bullish scenarios pointing even higher if execution on foundry and AI strategies meets expectations.
5. Technical and Sentiment Factors
While technical analysis currently signals caution, the $18.50–$20 zone has provided strong support, and any positive news on foundry contracts or AI wins could catalyze a breakout from current consolidation patterns.
Market sentiment has shifted more positively following the CEO change and strategic announcements, suggesting the potential for a sustained rebound if Intel delivers on its promises.
In conclusion:
Intel’s combination of visionary leadership, foundry expansion, AI innovation, and favorable geopolitical trends sets the stage for a potential stock price recovery by the end of 2025. With analyst targets and investor sentiment turning more bullish, INTC presents a compelling case for upside as it executes its turnaround strategy
Disclosure: I am part of Trade Nation's Influencer program and receive a monthly fee for using their TradingView charts in my analysis.

INTC long-term TAIntel is strong, it's a beautiful reversal of a downtrend on a long-term trend. Current uptrend is in correction and there's a distribution going on mid-term, which means now is not the best time to enter but considering strong weekly reversal INTC is something you should keep an eye on and pick up. The blue line for the support has been standing so far, we will see if it's going to be the lowest target in this correction.
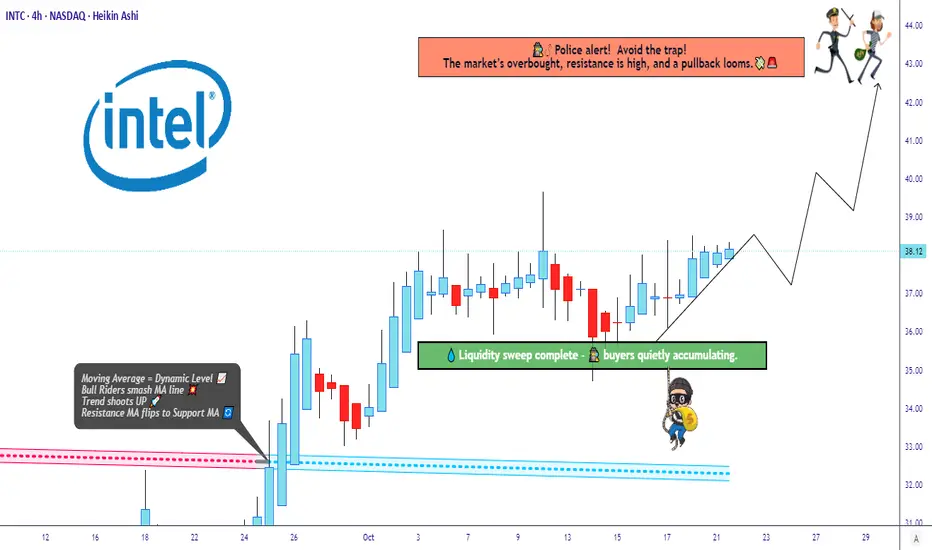
“Intel’s Bullish Structure Building Power for a Breakout Move!”🔥 INTC “Intel Corporation” – The Thief’s Profit Playbook 🕶️💰 (Swing/Day Trade Setup)
⚔️ Plan Overview – Bullish Setup with Thief Precision
The Thief Strategy is in play here — a smart layering entry method designed to steal optimal positions from impatient traders. 🕵️♂️
Our mission: Load, Layer, Loot, and Leave with Profits.
🎯 Entry Plan (Layering Method)
We’re layering multiple buy limits (thief-style) to catch value dips:
Buy Limit Layers: 35.00 💵 → 36.00 💵 → 37.00 💵
(⚙️ You can expand your layers based on your risk tolerance and style — thieves adapt fast.)
💡 Why Layer? Because a pro thief never rushes a vault — we break in step-by-step. This builds position strength while keeping entry efficiency.
🛡️ Stop Loss (Thief’s Escape Hatch)
📉 Stop Loss @34.00
💬 “Dear Ladies & Gentlemen (Thief OG’s) — I’m not recommending you set my SL. You’re the boss of your vault. Manage your own risk, grab the bag, and disappear in profits like a shadow.” 🌑💼
🚀 Target Zone (Profit Extraction Level)
🎯 Main Target: @43.00
📛 Police Barricade @44.00 — strong resistance zone + overbought region + potential bull trap.
🧠 Play it smart — escape clean with gains at 43.00 before the blue lights flash. 🚨
💬 “Dear Ladies & Gentlemen (Thief OG’s) — not recommending you follow my TP blindly. Make your own move, take your profit, and vanish like a ghost.” 👻💸
🧩 Technical Breakdown
Intel (INTC) forming a strong base accumulation near the $35–37 range.
Volume Profile shows liquidity pockets aligning with the layering zones.
RSI hovering mid-levels → room for upside before overbought conditions hit near $43–44.
EMA Confluence: Price reclaiming short-term EMA — early trend reversal signals in motion.
Fundamental Boost: Intel’s AI chip roadmap and cost-optimization headlines add bullish narrative momentum. ⚙️📈
🌍 Related Pairs to Watch (Correlation & Market Sync)
💠 NASDAQ:NVDA – Leader in AI semis; momentum correlation ~0.78 with INTC.
💠 NASDAQ:AMD – Similar sector swing potential; can mirror INTC lag-moves.
💠 NASDAQ:SMH (VanEck Semiconductor ETF) – Sector strength indicator. A breakout above resistance supports INTC’s upside.
💠 NASDAQ:QQQ / NASDAQ:NDX – Tech-heavy indices; bullish bias strengthens chip sector sentiment.
🧭 Correlation Tip: If NVDA or QQQ rallies strongly while INTC consolidates — that’s your thief’s golden signal to layer your entries quietly before the breakout sparks. ⚡
⚙️ Risk Management Wisdom
Never go all-in; layer your risk like a pro.
Keep your SL tight but mind flexible.
Respect zones — police don’t like thieves hanging around too long. 😎
✨ “If you find value in my analysis, a 👍 and 🚀 boost is much appreciated — it helps me share more setups with the community!”
📜 Disclaimer: This is a Thief-Style Trading Strategy shared for educational & fun purposes only. Not financial advice. Trade wisely — stay stealthy. 🕶️
#INTC #Intel #StockMarket #SwingTrade #DayTrading #ThiefStrategy #LayeredEntries #TechnicalAnalysis #NASDAQ #StocksToWatch #AIStocks #TradingViewCommunity #TradingViewEditorsPick #Semiconductors #NVDA #AMD #QQQ #ProfitPlaybook
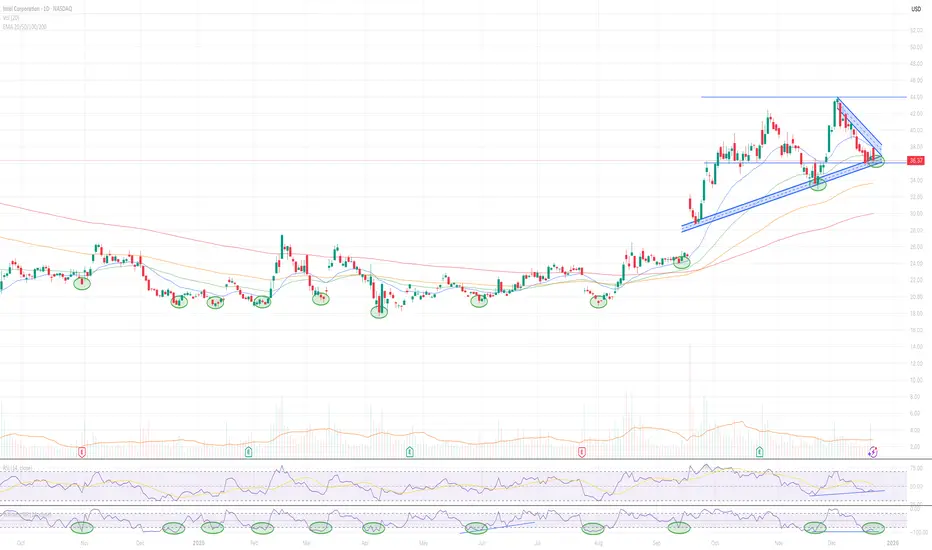
INTC Target Hit, Now Showing Another Bullish Setup!INTC - CURRENT PRICE : 41.53
My earlier INTC buy call has reached its projected targets. The previous analysis is shared below for reference.
Technical Highlights
1) New 52-week High – Price has broken into a fresh yearly high, confirming strong bullish momentum.
2) Pennant Breakout – The breakout from a bullish pennant pattern suggests continuation of the prior uptrend, with a potential target of $49 based on the pattern projection.
3) Golden Cross Intact – The 50-day EMA remains above the 200-day EMA, maintaining the long-term bullish bias.
4) RSI in Bullish Territory – RSI remains above 70, indicating strong momentum and persistent buying strength.
ENTRY PRICE : 40.00 - 42.00
FIRST TARGET : 45.00
SECOND TARGET : 49.00
SUPPORT : 36.43 (the low of 23 OCTOBER 2025 candle)

Next Volatility Period: Around November 5th
Hello, fellow traders!
Follow us to get the latest updates quickly.
Have a great day!
-------------------------------------
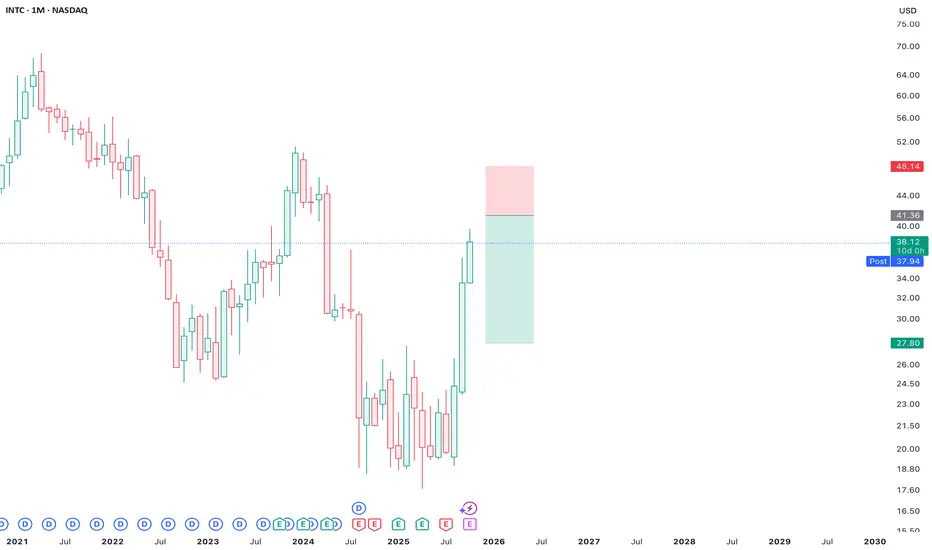
(INTC 1M Chart)
The price has broken above the 28.93 level, indicating a long-term uptrend.
The basic trading strategy is to buy in the DOM(-60) ~ HA-Low range and sell in the HA-High ~ DOM(60) range.
Accordingly, the resistance zones are 47.33-49.82 and 55.20-56.48.
The 47.33-49.82 range corresponds to the HA-High ~ DOM(60) range formed on the 12M chart.
Therefore, we should consider the overall resistance zone to be 47.33-56.48 and develop a response strategy.
-
(1W chart)
We should examine whether the price can sustain above the downtrend line (1) and rise along the uptrend line (2).
Since the HA-High indicator on the 1W chart is formed at 45.36, the key question is whether the price can rise above 45.36 and maintain its position.
-
(1D chart)
If the upward trend fails along the uptrend line (2), we should check for support near 36.92.
If not, there's a chance the M-Signal indicator on the 1W chart will touch it.
If the price remains above the HA-High ~ DOM (60) range (35.50-36.92) on the 1D chart, a stepwise uptrend is likely.
However, the price must break above the HA-High ~ DOM (60) range on the 1W and 1M charts.
Therefore, the first hurdle is whether the price can rise above 45.36 and maintain its position.
The next period of volatility will be around November 5th.
After this period of volatility, we need to see if the price stays above the downtrend line (1) and rises along the uptrend line.
-
Thank you for reading.
We wish you successful trading.
--------------------------------------------------

INTC Swing Long Conservative Trend Trade Conservative Trend Trade
+ long impulse
+ expanding T2 level
+ support level
+ unvolumed 2Sp
+ volumed test
+ below first bullish bar closed level entry
Calculated affordable virtual stop loss
1 to 2 R/R take profit
Daily Context
"+ long impulse
+ SOS level
+ support level
+ unvolumed Sp"
Monthly Context
"+ long impulse
+ SOS level
+ support level
+ 1/2 correction"
Give me a way better price at afterhours.
I just need my 2 R and I'm out!

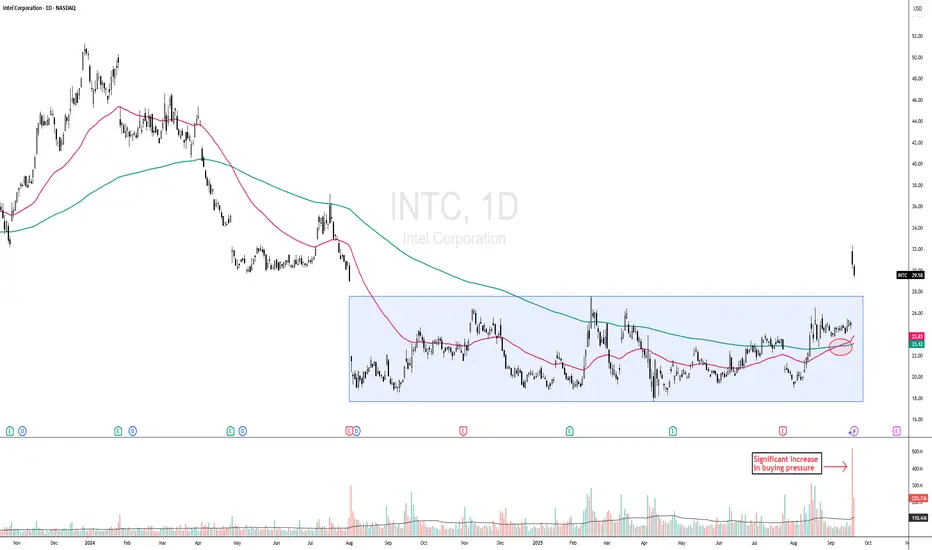
DOW THEORY PLAY - INTC CONFIRMS BREAKOUT FROM ACCUMULATION PHASEINTC - CURRENT PRICE : 29.58
Key Technical Highlights:
1. Breakout from Accumulation Phase with Strong Volume
Intel has successfully broken out of a prolonged sideways accumulation zone. The breakout is accompanied by significantly higher-than-average volume , indicating strong buying interest and institutional participation.
2. New 52-Week High Achieved
Price has breached the previous 52-week high, signaling bullish momentum and the potential start of a new price discovery phase. Historically, such breakouts often attract trend-following traders.
3. Golden Cross Formation (look at the red circle)
A Golden Cross has formed for the first time in a long period, where the 50-day EMA has crossed above the 200-day EMA — a classic long-term bullish confirmation. Notably, the last occurrence of this pattern was in July 2023 , making this the first reappearance in over two years, further reinforcing its significance as a potential turning point in market sentiment.
4. Dow Theory Alignment – Public Participation Phase
According to Dow Theory, this marks the second phase of a major uptrend — the Public Participation Phase — where broader market participants begin to enter following early accumulation by smart money. This phase typically sees strong price advances.
ENTRY PRICE : 28.00 - 30.00
FIRST TARGET : 35.00
SECOND TARGET : 42.00
SUPPORT : 25.00 (CUTLOSS below 25.00 on closing basis)
Note : This is related to point no 1. Markets have a tendency to "fall of their own weight." At bottoms, however, markets require a significant increase in buying pressure, reflected in greater volume, to launch a new bull market. A more technical way of looking at this difference is that a market can fall just from inertia. Lack of demand or buying interest on the part of traders is often enough to push a market lower; but a market does not go up on inertia. Prices only rise when demand exceeds supply and buyers are more aggressive than sellers.
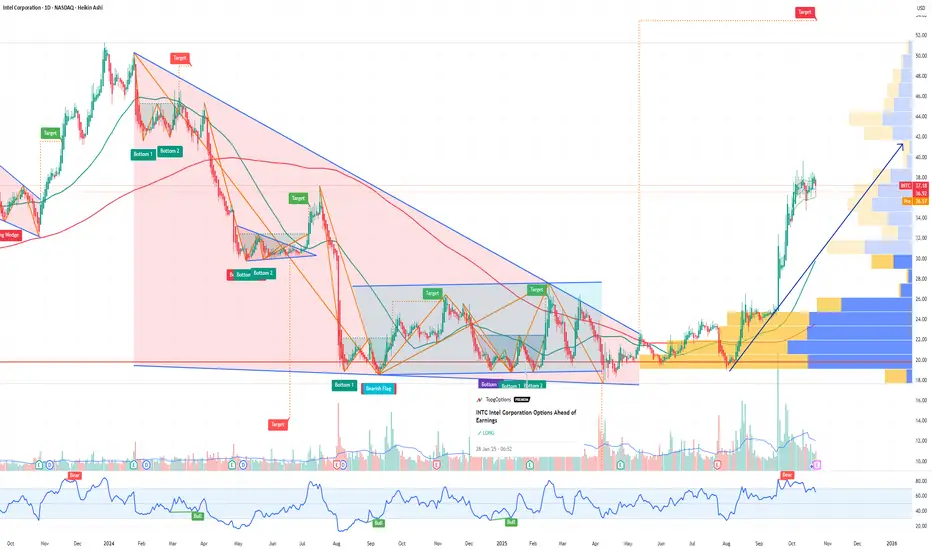
INTC Intel Corporation Options Ahead of EarningsIf you haven`t bought the dip on INTC:
Now analyzing the options chain and the chart patterns of INTC Intel Corporation prior to the earnings report this week,
I would consider purchasing the 48usd strike price Calls with
an expiration date of 2026-3-20,
for a premium of approximately $2.75.
If these options prove to be profitable prior to the earnings release, I would sell at least half of them.
INTCNot financial advice. The essence of investing & trading is the intelligent and patient preying on the greed, fear, impatience, addiction and ignorance of the majority. It's definitionally Darwinian.