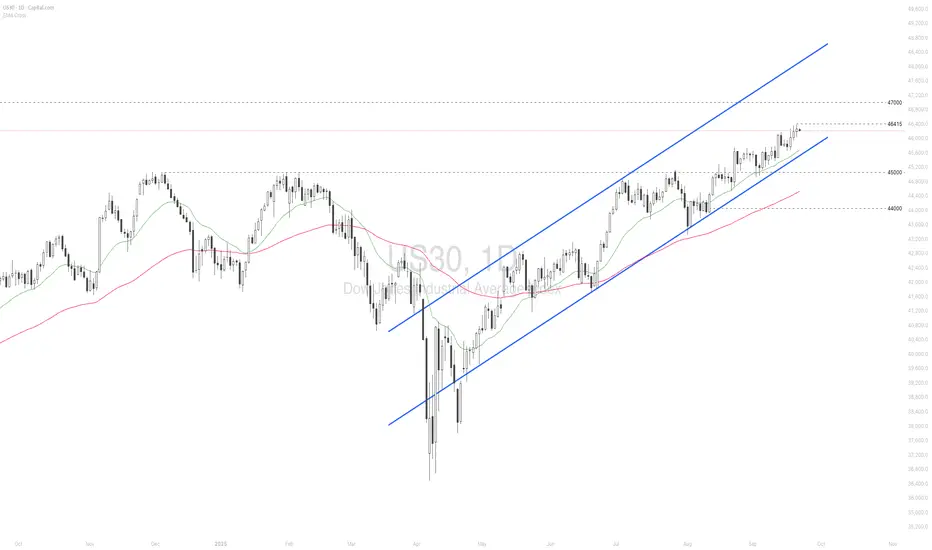
US30 hits new all-time high amid robust AI fever
US equities rallied to fresh record highs, fueled by the Fed’s rate cut, resilient US economic data, and optimism over progress in US-China trade negotiations. Ongoing enthusiasm for AI also boosted technology stocks.
Nvidia (NVDA) drove the strongest market reaction after announcing a \$5 bln purchase of more than 4% of Intel (INTC). Sentiment was further buoyed by reports that Chinese regulators halted their antitrust probe into Google (GOOGL), ending a long-running investigation into Android’s dominance.
US30 maintained a solid uptrend within the ascending channel, setting a new high. The index holds above both EMAs, indicating the potential continuation of the bullish momentum. If US30 breaches above the 46415 high, the index may gain upward momentum toward the psychological resistance at 47000. Conversely, if US30 breaks below EMA21 and the channel’s lower bound, the index could retreat toward 45000.
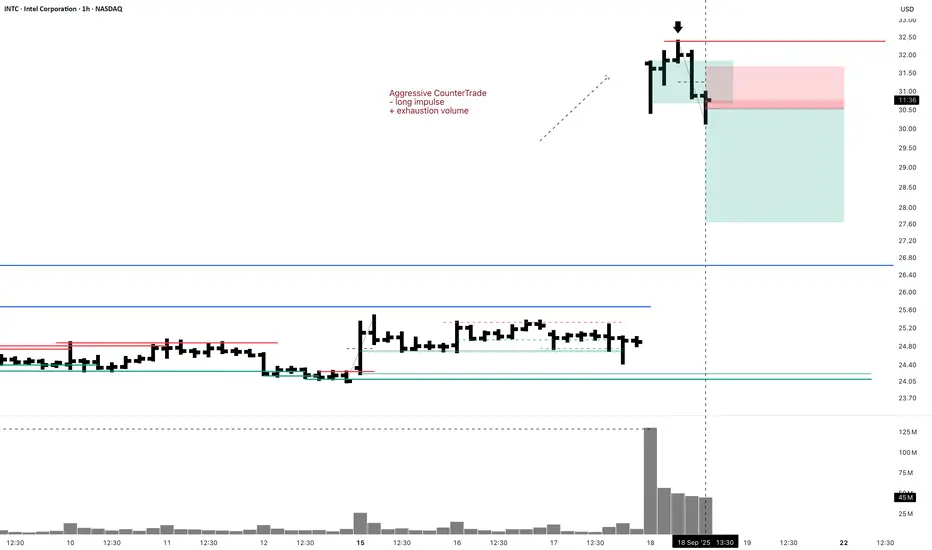
INTC
INTC Short Swing 1H Aggressive CounterTradeAggressive CounterTrade
- long impulse
+ exhaustion volume
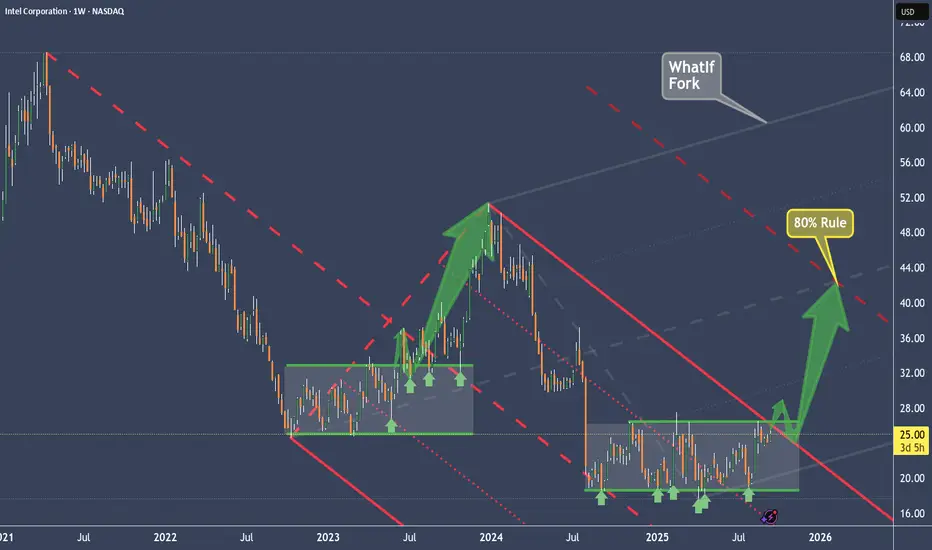
Daily CounterTrend
"- long impulse
+ expanding CREEK level
+ exhaustion volume
+ too high"
Monthly Trend
"+ short impulse
+ T2 level
+ resistance level
+ 1/2 correction"
Yearly Trend
"- long impulse
+ correction
- 1/2 of impulse
- biggest volume"
Intel | INTC | Long at $20This is going to be purely about technical analysis since Intel NASDAQ:INTC has a 90x P/E and has not proven themselves to be a viable challenger in the semiconductor market (yet...). Bad news could continue to destroy this ticker, but without that news, there could be some recovery in the near term.
The NASDAQ:INTC chart is in an overall downward trend. However, based on a few of my selected simply moving averages (SMAs), there is some predictability around support/resistance areas. Some of my favorite setups are a nice bounce on the lowest (green) selected SMA, occurring in October 2022 for a "rip then dip" to the second lowest (blue) - which it hit now. Often, but not always (I can't stress this enough), this green to blue SMA bounce represents a very strong support area during a downward trend. The other move is a further dip to retest the green SMA, but I suspect that would come with tremendously bad news for Intel... let's hope not, though.
Currently, NASDAQ:INTC is in a personal buy zone at $20.00 based on technical analysis only. A stop has been set if it drops below the blue SMA (which is may further test).
Target #1 = $28.00
Target #2 = $32.00
Target #3 = $60.00+ (very long-term, but high-risk unless fundamentals change)

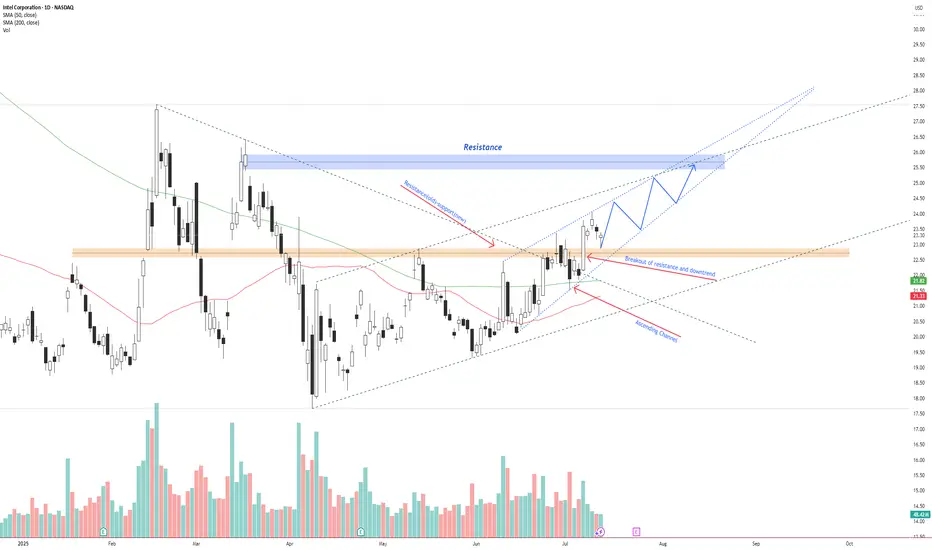
Intel (INTC) silent accumulation pattern and projection of priceThe last time INTC broke out of its sideways range, it re-tested support three times.
After that, price surged upward, pulled back to the Centerline (an 80% probability move), and then began accumulating again within a sideways coil — or “Battery,” as I like to call it (see the TSLA example).
This setup looks similar now.
In fact, we even have a stronger filter: Price must first break out of the downsloping red Fork. Once that happens, we can expect a re-test of the upper median line (U-MLH). That’s the point where I decide whether or not to take a position.
My target is the Centerline of the grey “What If Fork.”
I want to emphasize that the inventor of the Forks highlighted this idea in his original course: always project and think, “What if…?” That’s exactly what I do — and maybe it will help you as well.
Let’s see if Intel’s “Battery” gives us a solid trade. §8-)
$INTC the next leg to $34-44I took a trade last month that ended up going 500%, now I think it's time for the next leg of the move to play out.
The chart shows a recent breakout of a bull flag and price now testing a key resistance level.
I think once price breaks resistance here and can make it above that $26 resistance level, we'll see a large move higher start.
I think the move has the potential to reach $34-37, but can potentially make it all the way up to $44-45 level.
Let's see how it plays out.

INTC Ready For Breakout?Intel INTC appears to be putting in a major bottom on the weekly time frame. Stock has been beaten down for some time!
On the daily time frame, price appears to be ready to breakout of the range above the High Volume Node after multiple tests of the upper boundary resistance.
Theres been a gap to fill for some time up to $28. The pivot targets are subdued due to the amount of time INTC has spent ranging, so not super useful for targets in this case.
Price is above the daily 200EMA which has flicked positive.
Here is an example from my trade signals Substack. Stop below the 200EMA, pivot, High Volume Node and descending support line - you don't want to see price losing these as it adds confidence to the downside. This asset is volatile so the stop is wide for now - I will be looking out to adjust this to a tighter stop and thus a larger position size once I see how price action unfolds. I believe we have a good opportunity ahead to make several trades on this asset as we play it level by level.
Safe trading
Intel - The bottom is in!🔮Intel ( NASDAQ:INTC ) forms a clear bottom:
🔎Analysis summary:
After a consolidation of about three decades, Intel is now creating a strong bottom formation. With the retest of a major horizontal support area, Intel is respecting clear market structure. Quite likely therefore that Intel will soon start its next major higher timeframe bullrun.
📝Levels to watch:
$25
SwingTraderPhil
SwingTrading.Simplified. | Investing.Simplified. | #LONGTERMVISION

Giving away 10%. Is it good or bad for Intel Corp. (Nasdaq:INTC)Recently, the US government took away 10% of NASDAQ:INTC in an effort to lift the company back to its glory. Is this something that the government should do, when we are not in a crisis officially? Let's dig in.
Let us know what you think in the comments below.
Thank you.
75.2% of retail investor accounts lose money when trading CFDs with this provider. You should consider whether you understand how CFDs work and whether you can afford to take the high risk of losing your money. Past performance is not necessarily indicative of future results. The value of investments may fall as well as rise and the investor may not get back the amount initially invested. This content is not intended for nor applicable to residents of the UK. Cryptocurrency CFDs and spread bets are restricted in the UK for all retail clients.

INTC $26C Swing Play—Don’t Miss Out🔥🚀 **INTC Swing Options Play — Moderate Bullish Setup!** 🚀🔥
📊 **Swing Trade Breakdown (2025-08-22)**
* 🎯 **Ticker**: \ NASDAQ:INTC
* 🔀 **Direction**: CALL (LONG)
* 🎯 **Strike**: \$26.00
* 💵 **Entry Price**: \$0.80
* 🛑 **Stop Loss**: \$0.55 (-35%)
* 🎯 **Profit Target**: \$1.60 – \$2.00 (+100% to +150%)
* 📅 **Expiry**: 2025-09-05 (14DTE)
* 📈 **Confidence**: 70%
* ⏰ **Entry Timing**: Market Open
💡 **Why this trade?**
✅ **Momentum Rising**: Daily RSI at 65.0, 10D gain of +25.46% 📈
✅ **Low VIX (14.4)** = Safer holding, less decay risk ⚡
✅ **Bullish Bias Confirmed** across timeframes
⚠️ **Risks**: Weak volume (1.0x avg) & neutral options flow → breakout confirmation needed!
\#INTC #OptionsTrading #SwingTrade #CallOptions #StockMarket #MomentumTrading #BullishSetup #TradingStrategy #DayTrading
$INTC looks good for at trade to the upside? Targeting $34+?If we look at the chart, we can see INTC failed the breakdown of an H&S, retested the trendline breakout and seems to be heading higher.
Failed breakdowns are usually the most bullish patterns.
I could see the possibility of a large move here to go back and retest the $34 region, or potentially even go higher ($40+) if we can surpass that resistance.
Being price fell so quickly from March until now, I can see a sharp move higher (maybe on some news?).
Let's see what happens over the coming weeks.
Intel (INTC) Stock Price Rises 7% Amid White House RumoursIntel (INTC) Stock Price Rises 7% Amid White House Rumours
Intel (INTC) stock price surged more than 7% yesterday, making it the top performer in the S&P 500 index. The rally came on the back of a report in Barron’s stating that the US government is in talks to acquire a stake in Intel:
→ Intel declined to comment on Barron's report.
→ White House spokesperson Kush Desai stated: “Discussion about hypothetical deals should be regarded as speculation unless officially announced by the Administration.”
Meanwhile, Bloomberg reported that the Trump administration is negotiating with Intel over a potential US government stake in the company – a move aimed at boosting domestic manufacturing and supporting Intel’s plans to build a new facility in Ohio.
The prospect of state backing for the American chipmaker triggered a sharp bullish impulse yesterday, which could extend into today. In pre-market trading, INTC shares are hovering around $25 – their highest level since March.
Technical Analysis of INTC Shares
Previously, when analysing the INTC chart, we highlighted the significance of the $20 level, which appeared to act as strong support from major market participants. This may have reflected expectations that the government would not abandon a strategically important US company during challenging times – particularly in the context of technological rivalry with China.
For months, INTC shares had been in a downtrend (as shown by the 100- and 200-period moving averages). However, yesterday’s sharp rally now appears capable of reversing that trend:
→ Lower highs and lows at points A, B, and C had suggested a lower low at point D. Indeed, the price came close to setting it after a disappointing quarterly earnings report on 24 July, which led to a large bearish gap at the market open on 25 July.
→ Today, we may see the price break above point C’s high, signalling a potential end to the bearish market structure.
Candlestick analysis this week highlights strong bullish momentum:
→ On Monday (indicated by an upward arrow), trading opened with a bullish gap. However, sellers became active near the upper boundary of the aforementioned bearish gap (marked with a rightward arrow), causing the candle to close with a long upper wick – a sign of weakness.
→ The next two sessions demonstrated that buying pressure persisted – on Tuesday, the stock opened with a bullish gap and rose steadily throughout the day, with Wednesday’s strong candle further confirming buyer activity.
→ Yesterday, the price confidently broke through resistance at $22.25, moving towards the $23.75 level, which could be breached today.
→ The RSI indicator is now at its highest level since February.
The INTC share chart may be signalling that the prolonged bearish market, which began in 2021, is undergoing a significant shift in sentiment. This could mark the early stages of a rally – one that would be fundamentally justified if Intel does indeed secure government backing.
This article represents the opinion of the Companies operating under the FXOpen brand only. It is not to be construed as an offer, solicitation, or recommendation with respect to products and services provided by the Companies operating under the FXOpen brand, nor is it to be considered financial advice.

Intel looks to want $13Intel looks to be waiting below $24 resistance for $13 support. I wouldn't short it at it's current price, but I would be patient and wait for $13 if you're looking to buy. Good luck!
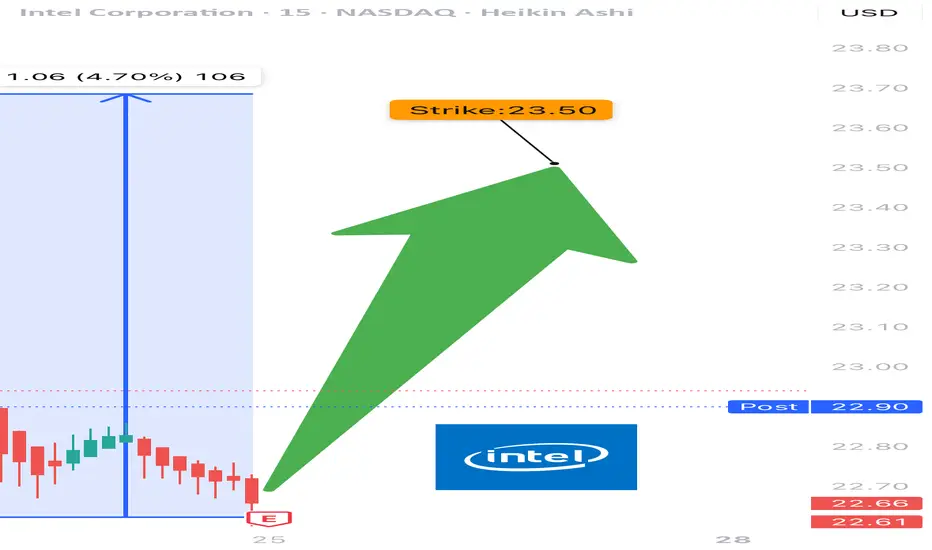
INTC EARNINGS TRADE (07/24)
🚨 INTC EARNINGS TRADE (07/24) 🚨
🎧 Earnings drop after close — here’s the high-conviction setup 📊
🧠 Key Highlights:
• 💥 Surprise Beat Rate: 88%, avg surprise = 419%
• 📉 Margins: Ugly (-36% net margin) but improving sentiment
• 📈 Volume Surge + $24 resistance test = pre-earnings drift 🚀
• 🔎 Mixed options flow → cautious bulls leaning in
• 🎯 Sector: SEMI = 🔀 rotating hard, competition vs AMD/NVDA rising
💥 TRADE SETUP
🟢 Buy INTC $23.50 Call exp 7/25
💰 Entry: $0.59
🎯 Target: $1.18
🛑 Stop: $0.29
📈 Confidence: 75%
⏰ Entry: Before Earnings (Close 07/24)
📆 Earnings: Today After Market (AMC)
📊 Expected Move: 5%
⚠️ Play the earnings drift → gap up = profit. Miss = cut fast. Risk = defined. Reward = explosive.
#INTC #EarningsPlay #OptionsTrading #IntelEarnings #UnusualOptionsActivity #TechStocks #Semiconductors #TradingView #EarningsSeason #DayTrading #CallOptions
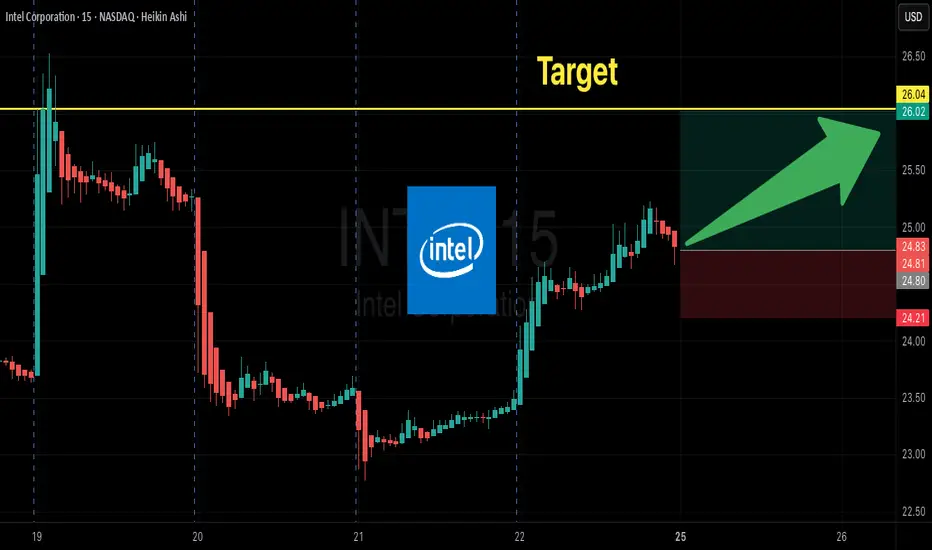
INTC – Breakout Confirmed, Bullish Continuation Inside AscendingIntel NASDAQ:INTC has broken above previous resistance and a descending trendline, confirming a bullish reversal.
Price is currently respecting an ascending channel and forming higher highs and higher lows. The breakout retest around $22.50 has held as new support.
If the current structure remains intact, price could continue toward the $26.00–$26.50 resistance zone. A breakout above this zone opens the door for a move toward $28+.
Key levels:
Support: $22.50 (previous resistance)
Resistance: $26.00–$26.50
Trend structure: Bullish channel
Volume supports the trend, and price is trading above both the 50 SMA and 200 SMA.
📌 Watching for a pullback and continuation move inside the channel.
This is not financial advice. Always do your own research.
Intel Share Price Hits 3-Month High Without Clear CatalystIntel (INTC) Share Price Hits 3-Month High Without Clear Catalyst
Intel Corporation (INTC) stocks rose by over 7% yesterday, making them one of the top performers in the S&P 500 index (US SPX 500 mini on FXOpen). As a result, the stock price reached its highest level in three months.
What’s notable is the apparent lack of clear drivers behind the rally. According to Barron’s, the increase in INTC shares could have been triggered by a rating upgrade from Wall Street analysts or a corporate announcement – yet no such developments have occurred. "Nothing new or fundamental," says Mizuho managing director and technology specialist Jordan Klein.
At the same time, from a technical analysis perspective, the INTC price chart is showing significant developments. Examining these price movements may provide clues as to what’s fuelling the recent rise.
Technical analysis of INTC stocks
For many months, the share price had been confined within a downward channel. However, the psychological level of $20 acted as a strong support – repeated attempts by bears to push the price lower ultimately failed.
Bearish patterns in INTC’s chart may have led to a supply squeeze, as holders were given repeated reasons to sell (particularly against the backdrop of Nvidia’s success). Yet the bullish reversals near the $20 mark suggest that institutional interest was accumulating the stock at what was perceived to be a deeply discounted level – a characteristic sign of the Accumulation Phase in Wyckoff methodology.
It is this lack of available supply that could explain the sudden price rise in the absence of obvious news catalysts.
Since early summer, INTC shares have been making higher highs and higher lows, breaking upwards through the descending channel and beginning to form the early stages of a new bullish trend (highlighted in blue). Should fundamental catalysts emerge in the near term, they may serve as the spark to accelerate this nascent rally.
This article represents the opinion of the Companies operating under the FXOpen brand only. It is not to be construed as an offer, solicitation, or recommendation with respect to products and services provided by the Companies operating under the FXOpen brand, nor is it to be considered financial advice.

Intel - The rally starts!Intel - NASDAQ:INTC - creates a major bottom:
(click chart above to see the in depth analysis👆🏻)
For approximately a full year, Intel has not been moving anywhere. Furthermore Intel now trades at the exact same level as it was a decade ago. However price is forming a solid bottom formation at a key support level. Thus we can expect a significant move higher.
Levels to watch: $25.0
Keep your long term vision!
Philip (BasicTrading)

INTC getting ready to start it's upward trajectoryINTC has been ranging and coiling since July of 2024. It finally, is starting to look like bullish movement is about to break upwards.
As you can see, INTC has just broken the downward trend line as well as the triangle pattern. A break and hold above $24.40 would indicate the start of a new uptrend in the chart.
Indications that the stock is gaining bullish momentum on the weekly chart:
The Williams %R is approaching and getting ready to break the 50 line.
The MACD is bullish and approaching the zero line.
The stock has bounced off of the volume shelf on the AVP 4 times and is now breaking out of technical patterns.
Money flow on market cipher B has crossed over green.
EMA's are starting to turn upward to flip bullish.
The marked move on this triangle pattern is approximately $40.
From a fundamental standpoint, Intel is trying to fix the business on two tracks at one time:
1)Near-term – ship competitive AI-centric products now (CPUs, GPUs, Gaudi accelerators) to put revenue and margins back on a growth path.
2) Long-term – reinvent itself as a contract chip-maker (Intel Foundry) so it can win outside customers and leverage its huge fab investments.
Think of it as “sell more chips today, sell more manufacturing tomorrow.”
Let's see Intel can build enough momentum to break this range for the bigger move up. The table is set from a technical standpoint.
Not financial advice. Do your own research.

Intel (INTC) Shares Drop Over 6% in a DayIntel (INTC) Shares Drop Over 6% in a Day
As shown on the Intel (INTC) chart, after Tuesday’s candle closed above $21, the price dropped sharply on Wednesday. INTC was the worst-performing stock of the day among the components of the S&P 500 index (US SPX 500 mini on FXOpen).
Why Did INTC Shares Fall?
The decline is linked to growing competitive pressure. According to media reports:
→ On one hand, AMD continues to rapidly expand its share of the server CPU market. A report by Mercury shows that the company already controls 40% of the segment and could match Intel as early as next year.
→ On the other hand, Nvidia is preparing to launch two accelerated processing units (APUs) for the consumer market, which will combine CPU and GPU capabilities in a single product.
Technical Analysis of the INTC Chart
In 2025, the price remains:
→ within a broad downward trend (marked in red);
→ supported by the $18.50–$20 zone.
Meanwhile, price fluctuations in May and June are forming a narrowing triangle (marked in black). Following the recent negative news, it is possible that INTC shares could fall towards the lower boundary of the triangle — or even retest the psychologically important $20 level.
This article represents the opinion of the Companies operating under the FXOpen brand only. It is not to be construed as an offer, solicitation, or recommendation with respect to products and services provided by the Companies operating under the FXOpen brand, nor is it to be considered financial advice.

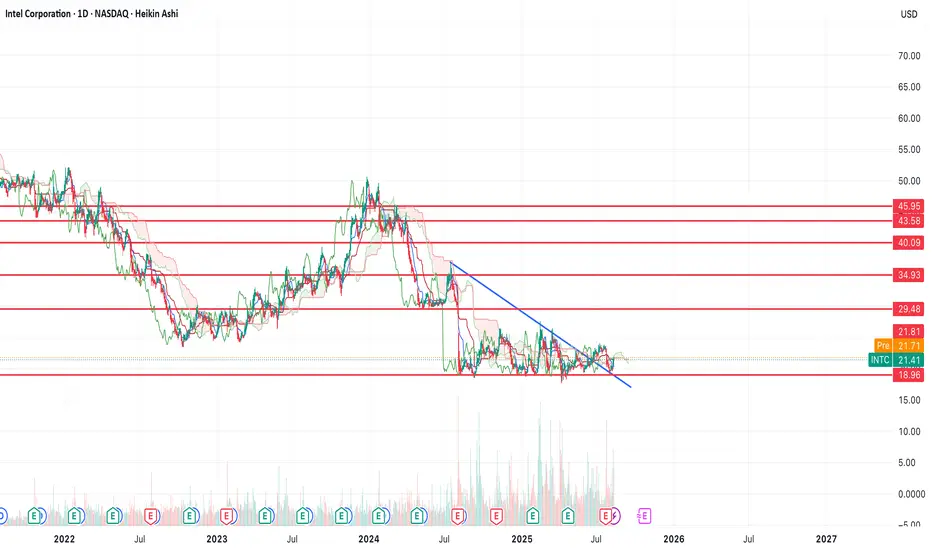
Important Support and Resistance Zones: 23.03-28.93
Hello, traders.
If you "Follow", you can always get the latest information quickly.
Have a nice day today.
-------------------------------------
(INTC 1D chart)
It shows an upward trend above the 18.69-21.33 zone, which is a medium- to long-term buy zone.
However, you need to be relaxed because it needs to rise above 28.93 to turn into an uptrend.
The 28.93 point is the HA-Low indicator point on the 1M chart, and it is expected that a breakout trade will be possible when it breaks above this point.
Since the price is located below the M-Signal indicator on the 1M chart, you should respond quickly and briefly with short-term trading while observing the situation.
Therefore, if you were unable to purchase in the mid- to long-term purchase section,
1st: M-Signal indicator on the 1M chart
2nd: 28.93
You can proceed with a purchase when it shows support near the 1st and 2nd above.
If it falls below 18.69, you should stop trading and observe the situation.
-
Thank you for reading to the end.
I hope you have a successful transaction.
--------------------------------------------------

Intel - This might be the bottom!Intel - NASDAQ:INTC - might create a bottom:
(click chart above to see the in depth analysis👆🏻)
For almost an entire year, Intel has been consolidating at a major horizontal support. Considering the previous significant bloodbath, Intel might soon find its bottom, which is inevitably followed by a major bullish reversal. After all, market structure is slowly shifting bullish.
Levels to watch: $20.0, $25.0
Keep your long term vision!
Philip (BasicTrading)

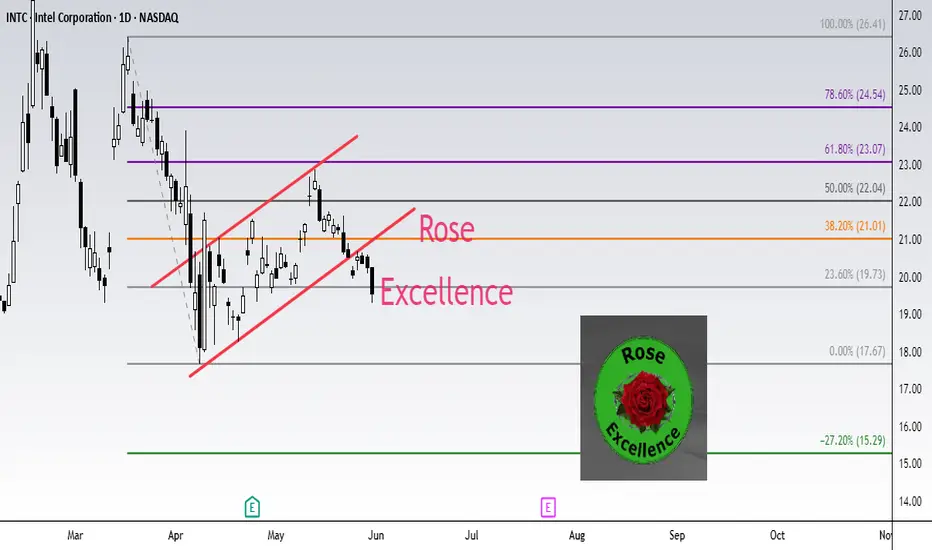
INTEL INTC Short setup target 15.29Fibonacci technical analysis : Intel Corporation NASDAQ:INTC has already found resistance at the Fib level 61.8% (23.07) of my Down Fib. The May 30th Daily candle has closed below retracement Fib level 23.6% (19.73), confirming a sell signal. A Bear Flag pattern has also formed. My Down Fib guides me to look for NASDAQ:INTC to eventually go down to hit first target at Fib level -27.2% (15.29).
NASDAQ:INTC – Target 1 at -27.2% (15.29), Target 2 at -61.8% (12.26) and Target 3 at -78.6 (10.79)
Stop loss slightly above the 50.0% retracement Fib level (22.04).
Enjoy the trading process and take time to smell the roses🌹
INTC Weekly Options Trade Plan 2025-05-26INTC Weekly Analysis Summary (2025-05-26)
Model Summaries
Grok/xAI Report
Technicals: INTC at $20.05, below 10/50 EMAs on M5 and well below 200 EMA; RSI(10) ~36 signals bearish momentum; MACD negative; price near lower Bollinger Band. Sentiment: VIX elevated at 22.29; mixed news but bearish outweighs bullish; options max pain at $21 may cap upside. Recommendation: Buy $20.00 weekly put at $0.41; profit target $0.62 (50% gain); stop-loss $0.20 (50% premium loss); hold to May 30 expiry. Confidence 65%.
Claude/Anthropic Report
Technicals: Strong short‐ and medium‐term bearish (price below all EMAs, RSI ~36–38, MACD negative, volume spike confirms selloff). Sentiment: Rising VIX, negative headlines, heavy put OI at $20 strike. Max pain $21 above spot. Recommendation: Buy $20.00 weekly put at $0.41; primary target $0.62 (50% gain), secondary $0.72; stop‐loss 25% premium ($0.31) or if INTC >$20.15; exit by Wed EOD. Confidence 72%.
Gemini/Google Report
Technicals: Bearish on M5 and daily (below 10/50/200 EMAs, RSI weak but not deeply oversold, bearish MACD). Sentiment: VIX rising; negative news flow; put demand greater than calls; max pain less relevant vs. momentum. Recommendation: Buy $19.50 weekly put at $0.22–$0.25 limit; profit target $0.44 (100% gain); stop‐loss $0.11 (50% premium) or if INTC >$20.40; size 1 contract for small account; exit EOD. Confidence 75%.
Llama/Meta Report
Technicals: Daily and M5 bearish (price below all EMAs, MACD negative); RSI ~38 suggests possible bounce but trend remains down; price near lower Bollinger Band. Sentiment: VIX up; mixed news but bearish tilt; max pain $21 unlikely this week. Recommendation: Buy $20.00 weekly put at $0.41; profit target $0.615; stop‐loss if INTC >$20.50; hold to expiry. Confidence 70%.
DeepSeek Report
Technicals: Bearish momentum (below all EMAs, negative MACD, daily RSI ~38); support at $20.02–$20.03 and lower band at $19.41. Sentiment: Elevated VIX; mixed news; heavy put OI at $20 strike; call interest at $21 as resistance. Recommendation: Buy $20.00 weekly put at $0.41 midpoint; profit target $0.62 (50%); stop‐loss if INTC >$20.10; close by Thursday EOD. Confidence 65%. Areas of Agreement and Disagreement
Agreement
All models view INTC as bearish into weekly expiry. Consensus on buying puts, with most favoring the $20.00 strike. Targeting a 50% gain on premium and risking ~25–50% premium loss. Entry timing at market open and holding into expiry or early in the week. Elevated VIX and heavy put open interest reinforce bearish bias.
Disagreement
Gemini prefers the $19.50 put for greater leverage vs. $20.00 put. Stop‐loss levels vary: from $20.10 up to $20.50 underlying or premium-based stops. Exit timing differs: some through expiry, others midweek to reduce theta decay. Profit‐target aggressiveness: 50% vs. 100% gains. Conclusion
Overall Market Direction Consensus: Bearish
Recommended Trade
Strategy: Buy single-leg naked put Option: INTC 2025-05-30 expiry, $20.00 strike put Premium: $0.41 per contract Entry Timing: At market open Profit Target: $0.62 (≈50% premium gain) Stop Loss: $0.20 (≈50% premium loss) Size: 1 contract Confidence Level: 70%
Key Risks and Considerations
Short-term oversold RSI may trigger a bounce around $20.00 support. Max pain at $21.00 could exert slight upward pressure if market stabilizes. Volatility drop (VIX normalization) could compress option premiums (vol crush). Weekly options have rapid theta decay; managing timing is critical. Liquidity and bid-ask spreads may widen at open—use limit orders.
TRADE_DETAILS (JSON Format)
{ "instrument": "INTC", "direction": "put", "strike": 20.0, "expiry": "2025-05-30", "confidence": 0.70, "profit_target": 0.62, "stop_loss": 0.20, "size": 1, "entry_price": 0.41, "entry_timing": "open", "signal_publish_time": "2025-05-26 09:30:00 UTC-04:00" } 📊 TRADE DETAILS 📊 🎯 Instrument: INTC 🔀 Direction: PUT (SHORT) 🎯 Strike: 20.00 💵 Entry Price: 0.41 🎯 Profit Target: 0.62 🛑 Stop Loss: 0.20 📅 Expiry: 2025-05-30 📏 Size: 1 📈 Confidence: 70% ⏰ Entry Timing: open 🕒 Signal Time: 2025-05-26 11:39:04 EDT
Disclaimer: This newsletter is not trading or investment advice but for general informational purposes only. This newsletter represents my personal opinions based on proprietary research which I am sharing publicly as my personal blog. Futures, stocks, and options trading of any kind involves a lot of risk. No guarantee of any profit whatsoever is made. In fact, you may lose everything you have. So be very careful. I guarantee no profit whatsoever, You assume the entire cost and risk of any trading or investing activities you choose to undertake. You are solely responsible for making your own investment decisions. Owners/authors of this newsletter, its representatives, its principals, its moderators, and its members, are NOT registered as securities broker-dealers or investment advisors either with the U.S. Securities and Exchange Commission, CFTC, or with any other securities/regulatory authority. Consult with a registered investment advisor, broker-dealer, and/or financial advisor. By reading and using this newsletter or any of my publications, you are agreeing to these terms. Any screenshots used here are courtesy of TradingView. I am just an end user with no affiliations with them. Information and quotes shared in this blog can be 100% wrong. Markets are risky and can go to 0 at any time. Furthermore, you will not share or copy any content in this blog as it is the authors' IP. By reading this blog, you accept these terms of conditions and acknowledge I am sharing this blog as my personal trading journal, nothing more.

Intel Breakdown Alert! Bearish Setup with High R:R Opportunity !📉 Intel Corporation (INTC) – Bearish Setup Analysis
Timeframe: 4H | Ticker: NASDAQ:INTC | Exchange: NASDAQ
🔍 Technical Breakdown
We are currently observing a potential bearish reversal on Intel Corp. following a clear breakdown from a rising parallel channel on the 4H chart.
🟦 Pattern Observed
Price was previously moving within a rising channel, forming higher highs and higher lows – a typical short-term bullish structure.
Recently, price broke down below the lower boundary of this channel, signaling a potential shift in momentum from bullish to bearish.
📌 Trade Setup
Entry Zone: Between $20.22 – $20.06
Price is currently trading in this zone, presenting a potential short entry opportunity following the channel breakdown.
Stop Loss: $21.77
Placed above the previous resistance zone and the broken channel. If the price reclaims this level, the bearish thesis is invalidated.
Final Target: $17.70
This level represents a key support zone from previous price action and aligns with potential measured move from the channel breakdown.
✅ Why This Setup?
Channel Breakdown
A break below a well-defined channel often marks a change in trend. This gives a high-probability setup for trend reversal traders.
Bearish Momentum Confirmation
After the breakdown, price failed to reclaim the channel, and is now trading below the prior support, flipping it into resistance.
Risk/Reward Ratio
This setup offers an excellent R:R ratio, with downside potential toward $17.70 and a relatively tight stop just above the failed structure.
Market Structure Alignment
Lower highs and lower lows now appear to be forming post-breakdown, further confirming a potential bearish move ahead.
📉 Bias: Short
📈 Invalidation: Break and close above $21.77
🎯 Target: $17.70
🧠 Disclaimer: This is not financial advice. Always do your own research and manage your risk accordingly. Trade safe!
