Does The IOTA Chart Tell Us We're Near An Alt Cycle?I made a recent post about my good calls and bad calls, but I want to highlight another one of my bad calls: That the alt market would boom and take more of Bitcoin's dominance. The majority of the market actually expected this, but it has not happened. In fact, Bitcoin dominance has been increasing since it broke out.
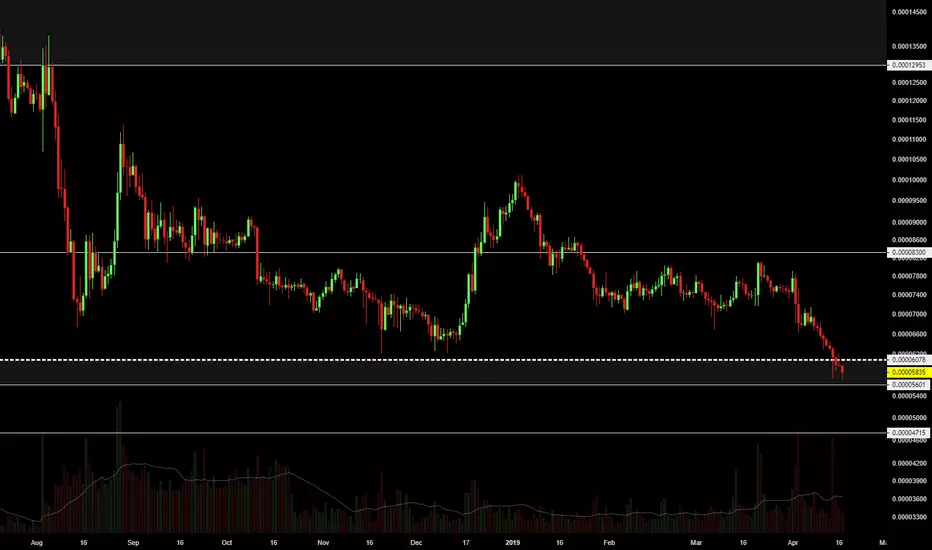
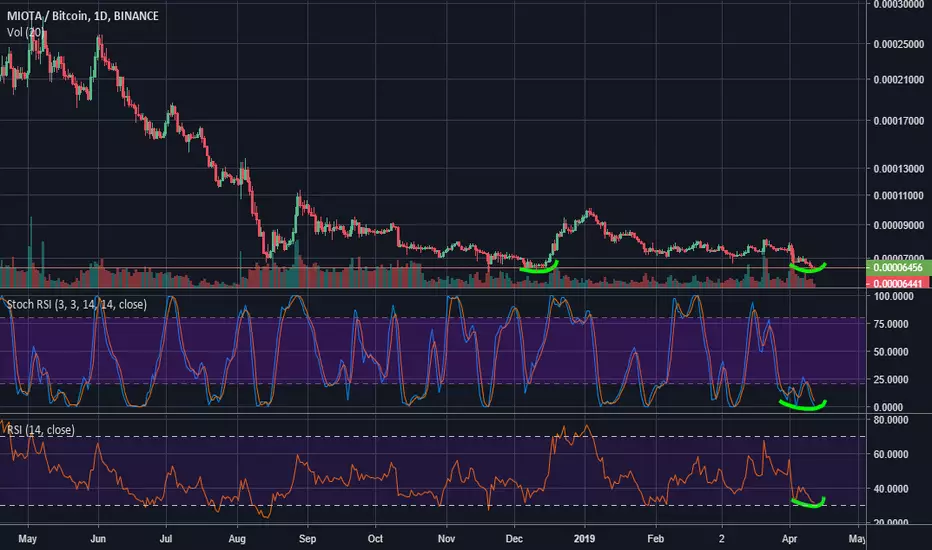
What's interesting is that even the alts that look very bearish against Bitcoin look pretty bullish on their USD charts. Take my recent XLM post for example, or even Ethereum. This analysis is not necessarily a trade setup (although IOTA could easily double up from here if it reverses). I'm just looking at the fact that IOTA, being one of the worst performers recently, is inching closer to its historical bottom. it also broke out of its logarithmic downtrend and retested it as support. WTC did the same thing before doubling up on its Bitcoin ratio. If you look at the first bottom (green circle 1), there was a massive capitulation wick before it went on its run. It's possible this will happen again with a number of altcoins very soon, so people likely have some very low buy orders set. Some coins will not have these sorts of wicks, so it's really a gamble, if you believe we will have another altcoin cycle.
As I've been mentioning in recent analyses, if big/mid-cap altcoins do not show signs of life soon, the market will not be playing out how I thought it would (or many thought it would). I think it would actually increase the likelihood that Bitcoin would drop, since people will start questioning the validity of the space. NANO continues to do relatively well, but that's also because people see it as a possible alternative to Bitcoin. However, there's no reason to panic yet, since the USD prices of most alts look healthy.
I'm VERY interested to see how this plays out. If it occurs like prior cycles, selling alts right now would be selling them close to potential bottoms of their cycles against Bitcoin. Traders will be traders, and indicators are showing that a lot of these coins are at strong buying levels. However, the lack of any bounces so far is concerning. In that case, there could be some downside for some, but I'm going to wait and see what happens. Fundamentally, there doesn't seem to be a reason for some well-supported altcoins to never recover. There is a possibility that Bitcoin will just completely take over, but I'd find that hard to believe, given the advancements many altcoins have over Bitcoin. Bitcoin will remain a somewhat decent payment method and a solid store of value either way. Regardless, I'm happy with my long term entries. If I'm wrong, I'm wrong.
This is NOT financial advice.
-Victor Cobra
Iotabtc

IOTA support box possibilityIt was front ran the first time, lets see how it reacts
Top line of the box is a monthly level
Bottom line of the box is a resistance level on the daily from a long time ago
Not taking this trade yet, just keeping an eye out!
IOTA-BTC* Don't forget to hit that like button and follow me on Trading View and Twitter for more chart analysis :)
If you like catching knife IOTA is the coin for you :P
*Willy is stupidly over sold
* Bullish divergence in histogram
* OBV does not look healthy at all
* Low volume, would love to see bulls step in here
* Price eating that big tail with is the last line of support
* Price is below value on VPVR
If you're looking to take a stab at this ill be setting a very tight stop loss 5% below the purple line. Trade with caution.

IOTA BEST TIME TO BUY OR TO DIEIota is a very reactive coin. Lazy periods and sudden volatility.
There are particular formation in the ETH and BTC pair that suggest me a buy.
Against Ethereum we are reaching an extremely reactive support. The minumum increase against ethereum was 35% in september 2017.
Against BTC we are entering the level that supported the incredible run of end 2017. During the correction Iota had two simmetrical impulse (Yellow circles). Between the two impulse there were around 120 days. Now we are around 120 after the beginn of the second impulse.
If you believe in simmetry and support is now a good time to buy IOTA.
BIO

IOTBTC ChannelsThere is a high probability that the IOTA is going to rise against BTC soon after it will confirm the bottom of the main channel (green)
++++++++++++++++++++++++++++++++++++++
This is not a trading advice!!!
++++++++++++++++++++++++++++++++++++++


Bullish on IOTA/BTCI am extremely bullish on BINANCE:IOTABTC long term.
One of the Top strongest project out there that has not really had a mini pump, Team is working hard.
Click Like and Follow me
Daily Bullish Signal $IOTA #IOTA #IOTABTC (14 April)RED ARROW indicates the EXPECTED Time and Targets
Level Stoploss point up to maximize profit and reduce risk
I'm working all the time, even in Bearish Market
======================
My path doesn't seem like anyone. I'm like a MONK, always studying to find the direction that prices will follow. I will feel very comfortable if the price goes exactly in the direction I drew. I will always try and practice until PERFECTION is MY OWN

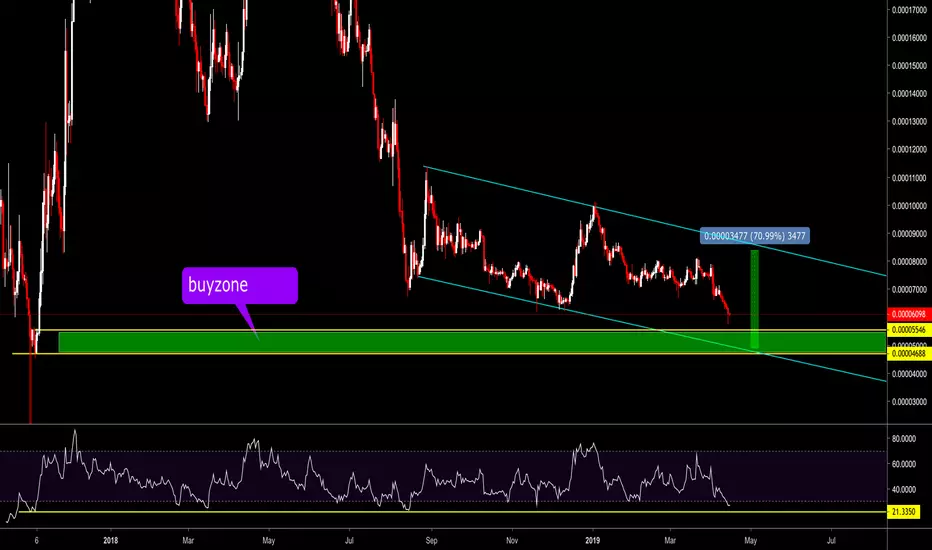
IOTA-BTC Long Trade PlanCommodity : MIOTA
Trade Type : LONG
Trading Against : BITCOIN
Entries : Double-UP Entries throughout the Buy Zone
Profit Taking : 25% at each TP point.
Profit Locking : Move SL to break even once TP1 is hit, to TP1 once TP2 hits, to TP2 once TP3 hits and so on
Duration - 2-4 weeks
Investment in trade : 10% of the total Trading Balance.
Prospective Profit : 12% to 43%
Prospective Loss : 6%
RRR : SL to TP1 is 1.8, SL to TP2 is 3.3 , SL to TP3 is 4.5 and SL to TP4 is 6.4
Buy Zone/TPs/SL price points are marked in the chart as follows
Greens - Profit Targets (TPs)
Blue - Buy Zone (Entries)
Red - Stop Loss (SL)

IOTA/USD - 1H Buy the retest of breakout IOTA broke out of a large corrective structure, currently correcting that move and making the final C wave in this correction.
Look for buys on the retest for upside.


IOTA - Miota is good for buy now, target 75% ~ 100%IOTA/USDT- Miota forecast
4H/ 1D - up and minor uptrend
Price move above support level --> positive situation
BUY around:
0.335 - 0.351
SELL target:
0.401
0.453
0.523
0.650
0.720
Stop loss:
Under 0.325
#TrungVuz
News: ~ The crypto market warm, minor upward.
IOTA (IOTA) is a distributed ledger for the Internet of Things that uses a directed acyclic graph (DAG) instead of a conventional blockchain.
Its quantum-proof protocol, Tangle, reportedly brings benefits like 'zero fees, infinite scalability, fast transactions, and secure data transfer'.
The IOTA Tangle is a Directed Acyclic Graph which has no fees on transactions and no fixed limit on how many transactions can be confirmed per second in the network; instead, the throughput grows in conjunction with activity in the network; i.e., the more activity, the faster the network.
#TrungVuz


IOTA INVESTMENT IDEAIOTA BTC INVESTMENT IDEA
LONG AS BELOW :
7200 6850
TARGETS
9000
10000
10800
12900
STOP BELOW 6800 IF DAILY CANDLE CLOSED BELOW IT AND MAKE IT MANUAL TO AVOID STOP LOSS HUNTS

IOTA IS LIKE A BOMB READY TO EXPLODEFOR 16 MONTHS, IOTA IS IN A DOWN TREND IN TRIANGLE PATTERN.
THIS RESISTANCE TREND IS VERY STRONG AND IMPORTANT.
LOOK AT THE MA200 , THIS INDICATOR BULLISH TREND .
IF THE PRICE CROSS UP THE MA200 AND THE TRIANGLE PATTERN WITH VOLUME,
THEN IOTA WILL BE IN HUGE BULLUSH RUN.
6X PROFIT MIGHT COME WITH IOTA.

IOTA - Hopium, Hopium, and Hopium...IOTA is looking slightly bullish on the daily timeframe as it is about to break out of the triangle. Not to mention, bulls did an amazing job defending the daily MACD cross right at the zero mark.
On the weekly timeframe, we can see the RSI making a potential inverse head and shoulders pattern. Similar to every inverse head and shoulders pattern, we must wait for the break of neckline resistance as confirmation.
Using a variety of synthetic currency pairs, we can compare the strength/weakness between IOTA and other cryptocurrencies. In this example, we will use synthetic pair IOTUSD/NEOUSD which simplifies into IOT/NEO.
There's a very visible bearish divergence in MACD, RSI, and Stochastic. There's a possibility that money from algo traders that are trading synthetic currency pairs may go into IOTA due to its temporary weakness against other cryptocurrencies. But keep in mind, this is simply a method to compare the strength/weakness between two highly correlated asset. USD value of IOTA does not necessarily have to go up in order for IOT/NEO to go down.
Using IOT/ETH pairing, we could see that we're approaching a long term support trendline with a double bottom starting to form. This further supports my point in IOT/NEO: IOTA should theoretically gain strength compared to other cryptocurrencies in the coming days or weeks.
Just like every single double bottom, a retest of the neckline is necessary. The neckline support must hold or else it would indicate that IOTA is still too weak.
Feel free to share your long-term bearish ideas, it's always good to know both sides.

Keep an eye on IOTA Watching IOTA and will buy on retest of support. Looking to capture a 5% move to the upside.

IOTAIOTUSD / IOTAUSD
Price is narrowing, the volatility subsides before the storm. The question of which way the blow would be would not have taken a decision in the medium term. There is a chance to pass at least 38-50% Fibo on the chart upwards. You also need to consider that we are in a falling trend and the opportunity to go down below 20 cents is very large. Indicators looks for bulls more.


IOTA/BTC - massive pump incomingIOTA/BTC weekly looks set to make a massive pump.
Target: 0.00012800
Blue triangle indicates the current range.
Green box is buy.
Red box is sell.
Blue line indicates major resistance.
Yellow line indicates t/p.
This is a log chart.
