EURUSD H4 Bearish CHOCH + BOS, Descending Channel Continuation 📝 Description
EURUSD on H4 has completed a clear CHOCH followed by BOS, confirming a shift into a bearish HTF framework. Price is now respecting a descending channel, with pullbacks failing below prior resistance and acceptance holding under key PD Arrays.
________________________________________
📈 Analysis (Scenario-Based | Non-Signal)
Primary Bias: Bearish within the channel
• Continuation favors a measured sell-off along the channel slope
• Pullbacks into H4 resistance / FVG are corrective, not impulsive
• Downside draw remains toward lower H4 liquidity (LQ/SSL) inside the channel
• Any bounce without acceptance above the channel top is viewed as sell-side opportunity
________________________________________
🎯 ICT & SMC Notes
• Confirmed CHOCH + BOS (H4) validates bearish structure
• H4 FVG overhead acting as dynamic supply
• Liquidity draw favors SSL below recent lows
________________________________________
🧩 Summary
Structure and geometry align for continued downside. As long as EURUSD trades below channel resistance, probability favors gradual bearish expansion toward lower liquidity pools rather than a reversal.
________________________________________
🌍 Fundamental Notes / Sentiment
With USD strength increasing such as ISM and Unemployment Rate, and no clear catalysts for EUR, macro flow supports a bearish continuation. This backdrop reinforces the expectation of downside movement within the drawn channel, barring a sudden shift in USD momentum or euro-specific catalysts.
________________________________________
⚠️ Risk Disclosure
Trading involves substantial risk and may result in capital loss. This analysis is for educational purposes only and does not constitute financial advice. Always apply proper risk management, predefined stop-loss levels, and disciplined position sizing aligned with your trading plan.
ISM

DJI M30 RSI Reset and Bullish Mean Reversion Setup📝 Description
Dow Jones on M30 is still trading inside a bullish HTF context. After the recent corrective drop, RSI has fully reset and is now sitting in a zone that historically aligns with price reversals to the upside. This tells us downside momentum is exhausted and the market is getting ready for a bounce.
________________________________________
📈 Signal / Analysis
Primary Bias: Bullish while holding above 48,800
Long Setup (Preferred):
• Entry (Buy): 48,820 (HTF FVG)
• Stop Loss: Below 48,750
• TP1: 48,930
• TP2: 49,075
• TP3: 49,230
________________________________________
🎯 ICT & SMC Notes
• RSI in reset / reversal zone
• Corrective move, not impulsive selling
• Price holding near HTF FVG support
________________________________________
🧩 Summary
With RSI showing exhaustion of sellers, the market looks ready for an upside rotation. As long as price remains above the current support, the probability favors a bullish continuation toward higher liquidity levels.
________________________________________
🌍 Fundamental Notes / Sentiment
Strong ISM Services supports economic strength and favors upside in the Dow. Softer JOLTS does not challenge the bullish trend, with pullbacks likely offering continuation opportunities.
________________________________________
⚠️ Risk Disclosure
Trading involves substantial risk and may result in capital loss. This analysis is for educational purposes only and does not constitute financial advice. Always apply proper risk management, predefined stop-loss levels, and disciplined position sizing aligned with your trading plan.

US100 H4 BPR Reaction and Buy-Side Liquidity Expansion Setup📝 Description
US100 on H4 is holding a bullish HTF structure after a strong impulse. Price reacted cleanly from the H4 UNICORN, showing absorption on pullbacks rather than acceptance lower. With structure intact, the market looks positioned for upside expansion toward buy-side liquidity.
________________________________________
📈 Signal / Analysis
Primary Bias: Bullish continuation above 25,570–25,600
Long Setup (Preferred):
• Entry (Buy): 25,590
• Stop Loss: Below 25,490
• TP1: 25,683
• TP2: 25,812 (BSL)
• TP3: 25,929 (HTF liquidity)
________________________________________
🎯 ICT & SMC Notes
• Strong bullish impulse with controlled pullback
• Buy-side liquidity stacked above recent highs
• No bearish CHOCH + BOS on HTF
________________________________________
🧩 Summary
As long as US100 holds above 25,500 the higher-probability path is continuation higher toward 25,813 and 25,930 liquidity. Pullbacks are viewed as opportunities, not reversals.
________________________________________
🌍 Fundamental Notes / Sentiment
Strong ISM Services supports economic strength but reinforces higher-for-longer rates. Softer JOLTS only adds short-term consolidation, not a trend change.
________________________________________
⚠️ Risk Disclosure
Trading involves substantial risk and may result in capital loss. This analysis is for educational purposes only and does not constitute financial advice. Always apply proper risk management, predefined stop-loss levels, and disciplined position sizing aligned with your trading plan.

BTC on US open and US ISM ServicesWatching US Open and the US #ISM services data closely...
Expecting that New York fakedumps towards ~$91k, and 30 minutes later US ISM services slightly miss (lower then expected) and pumps up the market...
Patience is key...
#Trading #Bitcoin #CryptoMarket #StockMarket

$BTC Cycle Analysis - ISM vs 4-Year CycleRiddle me this...
If crypto just runs off the ISM and it topped in March 2021 then why did we get a second HIGHER peak in November 2021 ???
All social and risk metrics topped at the same time as the ISM as well...
It's almost as if 🤔

THE 4-YEAR CYCLE WILL NEVER ENDTHE 4-YEAR CYCLE WILL NEVER END.
As I’ve said many times before, I now think this cycle will push into late January / February 2026, similar to 2017.
As I’ve written extensively about, the macro setup is nearly identical to 2017.
Read that here.
The funny thing is, when we do push into early Q1 ‘26, all your favorite “influencers” will proclaim “this time is different”, because most weren’t here during the 2017 cycle or before.
There is ZERO EVIDENCE that the 4-year cycle is dead.
Since the GFC in 2008, the Fed was redesigned for these boom and bust cycles to counter inflation and unemployment.
At this point, unless the US completely dismantles the Fed, the 4-year cycle will live on in perpetuity. We see the effect of this on TradFi as well.
See the comparison here.
The Fed is set to cut interest rates for the first time in a year at tomorrow’s FOMC. This is a liquidity positive catalyst for markets.
The next ISM PMI print on October 1st should be ~50, which will be the start of the business cycle.
That would give us ~5 months of a surging business cycle, which will pump risk assets to VALHALLA.

Prepare for LIFTOFF $ADAThe Global Net Liquidity index is breaking out of its multiyear downtrend channel on the back of a weak TVC:DXY dollar. Altcoins like CRYPTO:ADAUSD and other risk assets historically wildly outperform during Global Net Liquidity uptrends and dollar debasement cycles. As the business cycle heats up with ISM Manufacturing PMI ECONOMICS:USBCOI rising above 50, expect altcoins to gain relative strength to CRYPTO:BTCUSD and a Bitcoin Dominance
CRYPTOCAP:BTC.D collapse into the 35-45% range.
This is your last chance.

ride the gold with premium trade backed with macro market data analysis to predict ism news and it's affect on dxy then correlation with gold also fundamentals approach on gold bearish and take advantaghe of entrys on technicals

eurusd oportunutybacked with ism to provide momentum and liquidity fundamentals to determine the bias or the direction tech to execute 'enter' 'exit'

ISM Indices vs. GDP YoY% - Leading Economic IndicatorsBoth ISM Manufacturing Index and Non-Manufacturing Index vs. GDP YoY% for the US economy.
ISM Manufacturing: Yellow
ISM Non-Manufacturing: Blue
GDP YoY%: Green/Red
ISM Manufacturing currently signaling contraction with a level below 50 and the momentum seems lower.
Non-Manufacturing Index is likely to follow the same path although currently signaling growth, but less than before.
GDP YoY% could potentially experience a slow-down within the next 6 Months to a Year.
The FED has being somewhat more Dovish on the latest speech, as they're seeing a negative outcome in keeping Interest Rates higher for much longer.

ISM Manufacturing New Order IndexMacro Monday (6)
United States ISM Manufacturing New Order Index - ECONOMICS:USMNO
This week I have honed in on the Institute of Supply Management Manufacturing New Orders Index (ISM New Orders Index) as it is the largest component of the headline Purchaser Managers Index(PMI) making up 30% of that index. I also make the case below for how it can act as leading indicator of demand by way of trend projection.
The ISM New Orders Index is an indicator of U.S. economic activity based on a survey of more than 300 purchasing managers at manufacturing firms advising if orders have increased, decreased or stayed the same. Survey responses reflect the change, if any, in the current month compared to the previous month.
A reading above 50 indicates the expansion in the manufacturing sector which is interpreted as a positive indicator of economic growth. A reading below 50 indicates a contraction in the manufacturing sector which suggests a slowing economy.
According to Investopedia "ISM data is considered to be a leading indicator of economic trends. Not only does the ISM Manufacturing Index report information on the prior two months, it outlines long-term trends that have been building over time based on prevailing economic conditions".
The ISM reports are released on the first business day of each month for the month that has previously closed. Thus, they are some of the earliest indicators of current economic activity that investors and business people get regularly.
ISM New orders provide an indication of current consumer demand. Utilizing a chart of New Orders readings we can attempt to understand the trend of consumer demand forward. ISM New Orders could be considered an additional gauge of consumer sentiment because if businesses are reporting increases in orders month over month, this demonstrates consumers have the consistently had the resources and the desire to spend. If this continues over months a trend can form and we can capture this direction on a chart.
To support the ISM predictive argument I include a chart that illustrates a correlation between the ISM Manufacturing New Orders Index and the University of Michigan Consumer Sentiment Index, the latter of which is considered one of thee leading indicators for predicting future consumer spending/demand. This will be posted in the comments.
According to the University of Michigan, the Consumer Sentiment Surveys "have proven to be an accurate indicator of the future course of the national economy."
Based on the above correlation I postulate that we can use the ISM New Orders Index as an additional leading/predictive indicator to establish what direction consumer demand is trending.
The ISM New Orders Chart
Focusing on the ISM Manufacturing New Orders Index Chart you can see that a breach below the sub 50 level can act as a leading or affirming indicator of a slowing economy, lowering consumer demand/sentiment and ultimately recession.
Orange Zone
Historically If we enter into the orange area and stay there for greater than 7 months it has resulted in a recession every time except for 1966 and 1995 (8 out of 10 times). Some analysts have recognised and compared the similarities of the current period to the 1995/96 period. The similarities are evident on this chart with two touches or bounces from the red zone which appears to be happening at present. The August and September ISM New Orders reading will ultimately tell us if this will play out similar to 1995/96 or not. We know what to expect if it doesn’t.
Red Zone
Anytime we have entered into the red zone we have confirmed a recession. Its key to realise that recessions are typically assigned 8 months after they have started and this could mean we are already in one... Interestingly we have toe dipped into the red zone twice, in Feb and May 2023 however I do not see this as a definitive move into the red zone, I see these as bounces from this level as noted above.
Moment of Truth for ISM New Orders
What is clear from looking at the chart is that we are at a critical juncture as we have been 13 months in the orange zone which is a historic first. The coming months readings for August (released Sept) and September (released Oct) will be vitally important for providing an indication of the direction of the economy.
A drop down into the red zone and you know what to expect. A rise out of the orange area and above the 50 level would be positive however we have been rejected from areas above 50 in the past (see red lines on chart). I have included some rough fractals from periods in the past (arrows in grey) where we were previously rejected from the 52 and 54 level only to be dumped back into the red and into recession. It’s great that we are aware of these potential false flags so that we don’t get ahead of ourselves. It’s important to note that these fractal examples from 1980, 1990 & 1967 are not projections, just observations from past readings on what may be possible. It only highlights that we need to be cautious, even if we rise above the 50 level, we can be rejected into recession from the 52 and the 54 level. This is why we need help from other charts and indicators to help gauge the likelihood of a continuation higher or rejection lower.
Here on Macro Mondays we have been and will continue to build a portfolio of leading market charts/indicators that you can check for free on my Trading View and see how they are all progressing. These charts will include trigger events and will be updated as matters progress. The charts can help inform you of the direction of the economy, the market and help you anticipate or time any potential looming recession.
Some prior charts and their indications to date (all linked under this article);
Concerning Charts:
o Macro Monday 2 – The 2/10 year Treasury Spread FRED:T10Y2Y : The current yield curve inversion on the 2/10 year Treasury Spread historically provided an advance warning of recession/capitulation in 2000, 2007 & 2020 however it provided us a wide 6 - 22 month window of time from the time the yield curve made its first definitive turn back up to the 0% level. September will be month 6 of that 6 – 22 month window and thus we are clearly entering dangerous territory.
o Macro Monday 6 – ISM Manufacturing New Orders Index ECONOMICS:USMNO : Its clear from our chart shared today that the ISM New Orders Index is also entering into dangerous territory having been below the sub 50 level and in the orange zone for 13 months. This has never happened before without a recession, bar a lessor 12 month timeframe in the orange zone in 1995/96. The ISM Manufacturing New Orders readings for August and September will be vital indicators for the direction of the economy.
o Macro Monday 4 – Global Net Liquidity Vs S&P 500 NYSE:GNL : We shared this chart on the 3rd July as an advance warning of an imminent and expected pull back in the $SPX500. A negative divergence was evident on the chart as Global Net liquidity was decreasing for 6 months from Jan – July 2023 and the S&P 500 increased over the same period. Please review the chart press play and see how accurate this call has been. GNL is currently signalling at minimum a continued correction over the months of Aug and Sept.
Side Note: I am very aware of the Halloween effect in which markets rally into the months of October – December thus a pull back in Aug/Sept could end up being short term with a surge in the markets in October. The ISM reading for August (released in Sept) and September (released October) should help us gauge what outcome is more likely. Any increase/decrease in GNL will also offer insight over those months. Aside from this we should be aware of any Fiscal Stimulus that is announced as this would likely have a significant impact. I hope to cover Fiscal Stimulus in coming Macro Mondays, it’s a work in progress.
Charts Demonstrating Strength:
o Macro Monday 1 - Dow Jones Transportation Index ( DJ:DJT ): The transportation sector acts as a leading indicator as it is further up the value chain ahead of the final products being sold by companies in Dow Jones Industrial Average $DJI. It is similar to ISM Manufacturing New orders in this regard, ahead of or at point of sale execution. When the Dow Jones Industrial Average TVC:DJI is climbing higher while the DJT is falling (Negative Divergence), it can be a signal of economic weakness ahead, this occurred prior to March 2020 capitulation, making this a very valuable tool to have in our arsenal.
- In our chart recently shared a positive weekly MACD cross gave us a heads up that price might break through strong resistance levels, which it in fact did. If we can make the prior resistance level support and bounce off the support, price could stretch to all-time highs at which point we can reassess.
o Macro Monday 3 – SPDR Homebuilder Index AMEX:XHB : The Chart can be used as a leading indicator for the US housing market as the stocks in the XHB comprise of companies that provide the materials and products to build new houses and renovate homes. These products are higher up the supply chain and sold before construction commences or during. In the past the XHB chart provided a significant advance 12 month+ warning of the 2007 Great Financial Crisis which is illustrated in red on that chart.
- Since sharing the chart price appears to be on course to testing its all time high and has a bullish MACD Cross on the monthly. This could also be a double top however historic positive MACD Cross performance suggests we have higher to go. Its looking positive.
o Macro Monday 5 – Arca Major Markets Index (XMI): The XMI has proven itself as a leading indicator as it provided an advanced 9 month warning of the follow up recession/capitulation price action that initiated in Sept 2000 on the S&P 500.
- Since we shared this chart it has broken above its all time highs and is currently resting on support. A bounce higher here would be confirmation of the uptrend, however this could be a false breakout which would be confirmed if we lost the support. This chart will be important to watch for the August – September period also, again highlighting just how important these 2 months are.
Conclusion
Its clear from all of the above charts that the price and readings for the months of August and September 2023 will be critical to determining the potentiality of a recession / market capitulation or for letting us know will there be continuation of climbing the wall of worry. Its clear that we are at an inflection point over the next 60 days. Based solely on the charts shared to date the fact that the DJT, XMI and XHB are still leaning bullish, I remain long term long until these charts break down or the GNL and ISM Manufacturing Index confirms to the downside. That does not mean that we can’t get a 10% ,15% or 20% pullback in the S&P over the next 60 days, this would not surprise me, however based on some of the charts I have shared previously I think it is probably that this will be a temporary pull back. This leans me towards thinking that if there is a hard landing, it will come later in 2024 or even 2025. If that view changes and the above positive charts pull back, ill be the first to let you know.
Stay Nimble folks, August and September are decision time.
PUKA

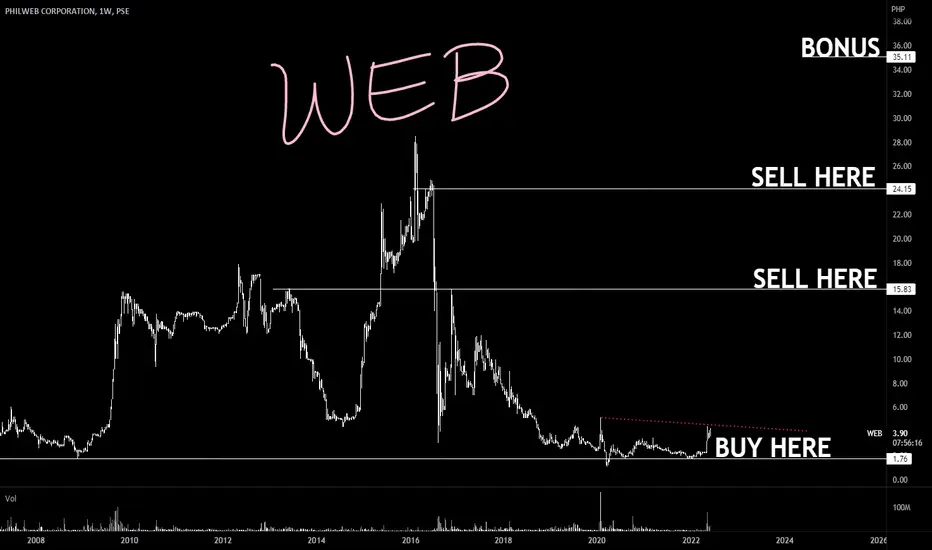
WEB: ₱P3.90 | a Future Unicorn in the Gaming Scene 20x++same handler of iSM a telco backdoored issue acquired by DAU (Dennis Ang Uy) ₱1.0 --> ₱20.0
WEB a favorite bread and butter of Balesin folks (owner of iSM Balesin) turned over to Araneta Group
for a 100 day recovery to fresh highs
entry: spot +- 25%
exit: when youre happy
XLI could be on the verge of breaking down. A close above the neckline negates the bearish pattern.
If Weak ISM data continues you could see more weakness in this sector.
A pair trade I'm watching is Long GE / Short XLI

ISM New Orders vs Consumer SentimentISM New Orders Vs Michigan Consumer Sentiment index
ISM New orders provide an indication of current consumer demand. Utilising a chart of New Orders readings we can attempt to understand the trend of consumer demand forward. ISM New Orders could be considered an additional gauge of consumer sentiment because if businesses are reporting increases in orders month over month, this demonstrates consumers have the consistently had the resources and the desire to spend. If this continues over months a trend can form and we can capture this direction on a chart. To support the ISM predictive argument I include a chart that illustrates a correlation between the ISM Manufacturing New Orders Index and the University of Michigan Consumer Sentiment Index, the latter of which is considered one of thee leading indicators for predicting future consumer spending/demand. This will be posted in the comments.
According to Investopedia "ISM data is considered to be a leading indicator of economic trends. Not only does the ISM Manufacturing Index report information on the prior two months, it outlines long-term trends that have been building over time based on prevailing economic conditions".
According to the University of Michigan, the Consumer Sentiment Surveys "have proven to be an accurate indicator of the future course of the national economy."
Based on the above correlation I postulate that we can use the ISM New Orders Index as an additional leading/predictive indicator to establish what direction consumer demand is trending. Something we can keep an eye on and something that will factor in this weeks MACRO MONDAY Edition which i will post immediately after this
PUKA

PMI Data & How it Effects DXYJust to summarise quickly what the ‘Purchasing Manager Index’ is, it’s a monthly data release by the ISM. PMI data is based on 5 survey areas: new orders, inventory levels, production, supplier delivery & employment.
PMI data ranges from 0-100. A PMI reading ABOVE 50 represents expansion in the economy. Whereas, a reading BELOW 50 represents contraction.
Below is the PMI data for March 2023, which came in at 47.7 which shows the economy is contracting. Now to show the importance of this, let me show you the last few times the PMI dropped below 50👇🏻
2008 - The Financial Market Crash🩸
Early 1980’s - Sky High Inflation🩸
Mid 1980’s - Recession which left unemployment at 7.5%. The recession was caused by tight monetary policy from the government , in an ‘effort’ to fight high inflation🩸

ISM PMI Long Term Chart - 04/08/23The ISM currently stands at 46.3%, signaling a contraction.
Business activity is implying that rising interest rates and growing recession fears are starting to weigh on businesses. The reading pointed to a fifth straight month of contraction in factory activity, as companies continue to slow outputs to better match demand for the first half of 2023 and prepare for growth in the late summer/early fall period.
Frequentist's will tell you that the market tends to bottom six months after the ISM drops below 50.00.
In the chart, I've drawn a channel with fib standard deviations.
This will be a good one to save and track

$JPY - What can we do? $JPY - What can we do?
As mentioned in previous posts, data ISM will impact the market today. However, I am looking at key levels as long as we dont break the lows in the yen - this could be a little bit of a pull back trade we as traders could take advantage of.
Don't forget to trade your own plan.
Trade Journal

$DXY - Pull back?$DXY - Pull back?
We have ISM this later afternoon but technically looks like a pull back occurring!
Trade Journal

Dollar index continues to decline The dollar index continues to decline and tests an important psychological support at 110
Pressure from the ISM manufacturing index and negative expectations for the service index today
The dollar is likely to face a wave of weak demand until the end of the week and the emergence of employment data
to watch
110.00
108.90

Daytrading EURUSD the day after ISM Non-Manufacturing PMII made a backtest EURUSD and U.S. ISM Non-Manufacturing Purchasing Managers Index (PMI) finding a good opportunity going long the day after if Actual PMI is greater than Previous PMI.
This is not a standalone strategy but a good piece of a puzzle before deciding to open my trade. This trade has closed this evening with 100 pips profit.
my puzzle had today a lot of intersting pieces:
1. Advantage from the last ISM release matching with my backtest
2. USDOLLAR reached the fibonacci's extension
3. Chart 6E1!/DX1! close to a support
3. 30min chart. I setted my entry price after rebouncing twice from a double strong support (red lines = weekly and montly highs/lows)
4. Good bullish wedge pattern on EURUSD (1Day chart)
5. Expectation for rising interest rate tomorrow by ECB.
I like trading with a so lot of opportunities

How to make quick 40 pips in USDJPYSince the FED last week went from an ultra hawkish stance to a more data dependant one it is clear that US data will now become even more important and volatile for USD pairs and also for the whole market.
And thats great news! It means we can now extract pips from the market every time there are important US news like for example the ISM manufacturing data today.
If you want to participate you can enter to my group trough the link in my bio.
For the ISM report yesterday it was really easy to get 30-40 pips out of USDJPY:
1. The ISM came better than expected with 52.7 vs. 52.1 consensus.
-> go long USDJPY immediately
2. Algos drove USDJPY higher for 40 pips
3. Take profit immediately when the first impulse of the move weakens.
4. Market participants realize that the most important subcomponent of the ISM, -> prices paid <- , came much lower than expected (60.0 vs 75.0 consensus)
5. USDJPY falls all the way back again
I made easy peasy 40 pips and so can you next time.

ISM New OrdersPersonal notes on the indicator.
Heading lower.
Last major read was fallout of 08.
Incurs a negative bias on the wider economy.

XAUUSD 12H TA : 05.02.22 (Update)If this current strong price support is lost, we can expect a drop to the $ 1845 range . but its not , (PLEASE SEE THE PREVIOUS ANALYSIS)
Follow us for more analysis & Feel free to ask any questions you have, we are here to help.
⚠️ This Analysis will be updated ...
👤 Arman Shaban : @ArmanShabanTrading
📅 05.02.2022
⚠️(DYOR)
❤️ If you apperciate my work , Please like and comment , It Keeps me motivated to do better ❤️
