ADA/USD Main trendThe main trend (to understand where the price is and what is the general trend). Logarithm. Timeframe 1 month. Price in a secondary downtrend is approaching a mirror support level (marked in yellow, former resistance).
Against the dollar on the monthly timeframe, there is now a large bowl with a handle, which I have displayed on this chart.
Pump/dump news.
Cardano's developers have activated the Vasil hard fork on the testnet. The Vasil hard fork was successfully completed on the Cardano testnet.
Vasil will enable faster block generation and increase the scalability of decentralized applications (DApps) powered by Cardano.
Vasil is expected to launch on the mainnet in about a month.
In other words, if the market allows, then in about 1 month a local pumping (trend reversal) is planned, if the market is sluggish, then Vasil will be canceled for some far-fetched reasons or the event will not be widely advertised.
Remember when the US congressional elections.
The same parameters on the line graph.
Secondary trend. Downlink zone. Timeframe 3 days.
ADA/USD Secondary trend.
Local trading situation Timeframe 1 days.
ADA/USD Local trading situation
J-ADA

ADA /USD Main trend. 07 2024Logarithm. Linear chart to remove market noise. Main trend to understand the zone for work.
The asset is at a huge percentage of pumping from the last cycle, but the decline occurred from the peak at -91% and there was re-accumulation. Locally, a descending wedge is formed.
Secondary trend for work.
ADA/USD secondary trend. Wedge. Mirror level.

ADA 60% Price Increase On The Horizon#Cardano has had lazy price action compared to other layer 1s.
Right now it's still struggling to stay above key support. Once we can trade above the support and maintain it, my target will be the top of the range 60% away.
Calculate Your Risk/Reward so you don't lose more than 1% of your account per trade.
Every day the charts provide new information. You have to adjust or get REKT.
Love it or hate it, hit that thumbs up and share your thoughts below!
This is not financial advice. This is for educational purposes only.

Ada to 1.5-2.31.5-1.6 range is a crucial resistance zone in a weekly timeframe. In overall 2.3 is a max take profit zone I am comfortable with. If you wondering why I am considering long position on BINANCE:ADAUSDT check my latest idea on $BINANCE:ADAUSDT.

This is lovely to see As I mentioned earlier BINANCE:ADAUSDT showed a great impulse and is waiting for an opportunity to enter a long-term Long position either Spot or Futures. I think the time has come and the signs are obvious.
1. Break of Structure ( made higher high ) in a daily timeframe
2. MACD divergence.
3. Volume is decent and looking good.
4. In early March made a higher high in a weekly timeframe ( BOS )
If you don't know where to take profits I suggest you look up my last idea on BINANCE:ADAUSDT

Cardano will Go Up AgainBINANCE:ADAUSDT
Finally ADA breaked the Falling Wedge It means Price Can rise up well.
✨Traders, if you liked this idea or have your opinion on it, write in the comments, We will be glad.
_ _ _ _ __ _ _ _ _ _ _ _ _ _ _ _ _ _ _ _ _ _ _ _ _ _ _ _ _ _ _ _
✅Thank you, and for more ideas, hit ❤️Like❤️ and 🌟Follow🌟!
⚠️Things can change...
The markets are always changing and even with all these signals, the market changes tend to be strong and fast!!

ADA, CAN IT BE PART OF THE DIGITAL GOLDRUSH?ADA chart
RSI favorable on smaller charts, not so favorable on bigger charts.
Potential to see a dip and BIG run.
One support trend.
Buy zone marked
Price targets marked
Potential to see a wick down to 10 cents, but lots of potential to hold that sub 30 cent price.
I'd be patient, and see what happens before jumping in, but having said that, short term could rocket the price, however, it really needs to clear 63, in my opinion.
I think the potential is there to see a quick drop to price targets and a run to all time highs, which aligns with a lot of the crypto market.

(ADA) CARDANO Strong signal indicating the price of Cardano is potentially heading upward. Variable exponential moving lines measured to create two lines that option the risk to favor a simple and direct approach to seeing a simulated trend ahead of time.

Trade Setup: ADA Long PositionMarket Context:
ADA is currently at resistance, and we are considering two potential scenarios for entering a trade.
Trade Scenarios:
Break and Retest Scenario:
Entry: Enter the trade at a confirmed break and retest of the $0.45 level.
Range Retest Scenario:
Entry: Enter the trade at a retest of the bottom of the range at $0.42.
Common Trade Parameters:
Take Profit:
First target: $0.51 - $0.54
Second target: $0.57 - $0.60
Stop Loss: Place the stop loss just below $0.40.
📊 Monitor the price action for confirmation of breakouts and retests. Adjust entries based on market conditions. #ADA #CryptoTrading #TradeSetup 🎯

55% Move Possible. Simple Idea.Keeping it very simple. We are now trading back within the range. I am expecting higher prices as long as this support holds. $0.66 Is the target.
If we fall back below support "Lower Blue Box" I would be out of any longs
Calculate Your Risk/Reward so you don't lose more than 1% of your account per trade.
Every day the charts provide new information. You have to adjust or get REKT.
Love it or hate it, hit that thumbs up and share your thoughts below!
This is not financial advice. This is for educational purposes only.

ADA is still bearishCardano has bearish structure and is now creating a pullback in the internal structure.
The red area is where we look for sell/short positions.
The targets are marked on the chart.
Closing a daily candle below the invalidation level will violate the analysis.
For risk management, please don't forget stop loss and capital management
Comment if you have any questions
Thank You

ADA: POTENTIAL FALLING WEDGE BREAKOUT!Hey everyone!
If you're enjoying this analysis, a thumbs up and follow would be greatly appreciated!
CARDANO(ADA) Looks good in the daily chart. It breaks from the falling wedge-like structure and looks ready for a 60-70% move to the upside. Buy some here and add more in the dip.
Entry range:- CMP and add more up to $0.394
Targets:- $0.454/$0.512/$0.568/$0.613/$0.684
SL:- $0.3636
What are your thoughts on ADA's current price action? Do you see a bullish pattern? Share your analysis in the comments below!

Cardano: Ready for Take-OffWe consider the magenta-colored wave (ii) interim correction to be complete and expect an impulsive rise to above the resistance at $0.81.

Cardano to $10?Last bull run CRYPTOCAP:ADA went pass the logical take-profit area at the 3.618 on the fib of $1.36. Conservatively speaking, this controversial coin is right on schedule en route to 3.618 on the fib at $10 by Q1 2025. Let me know your thoughts in the comments. Thank you.

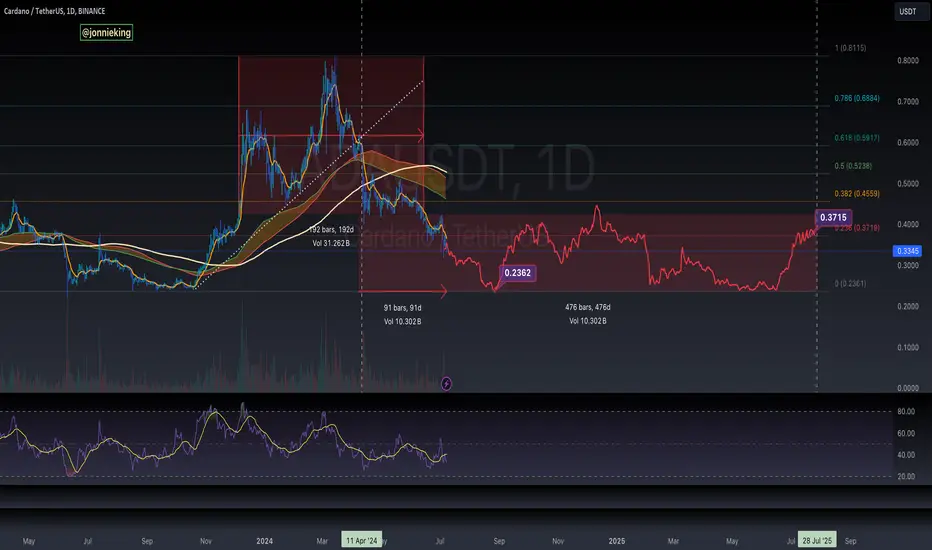
$ADA Chart FULL RESET AheadCRYPTOCAP:ADA has been extremely Bearish since April 11th when the 192 Day range cratered the price 35% over 4 days breaking the 200 MA
hasn’t been able to reclaim since, and cant even break the 9D EMA
Chart is on its way to a full reset.
Could be as much as a 476 day sideways range between $0.23 and $0.37 which is the .236 Fib
Hopefully by Q3 2025 Cardano can rally at the end of the Bull with the leftovers
Alikze »» MATIC | Elliott Triangle pattern scenarioAccording to the previous analysis, the Metic currency went through an upward movement cycle. Currently, it is in a corner pattern in the weekly time, which was able to escape from it in the specified supply area with a short-term movement cycle.
💎 Currently, it has a corrective cycle up to the green box, which has moved downwards in a three-wave step in daily time.
💎 But now it can enter an upward cycle and retest the first supply area after confirming the green box. If confirmed, the area of upward movement can continue to extend to the base of the pattern, which can be checked further.
💎 Therefore, this upward movement can be followed in the form of wave 3 or 3 larger up to the specified areas.
💎 Alternative scenario: If the green box area is broken, this correction can be a combination correction that will have the ability to reach the 0.39 range.
»»»«««»»»«««»»»«««
Please support this idea with a LIKE and COMMENT if you find it useful and Click "Follow" on our profile if you'd like these trade ideas delivered straight to your email in the future.
Thanks for your continued support.
Sincerely.❤️
»»»«««»»»«««»»»«««

CARDANO | ADAThe price of ADA is $0.4 today with a 24hour trading volume of 285 million dollar. This represents a 5.7% price increase in the last 24 hours and a 12% price decline since last month
Ada managed the breakout at 0.38 and had a huge buy volume and now the crucial EMAs (50, 100, and 200) accumulated between the $0.41 and $0.396 barrier accentuate the high resistance zone which needs to be breached for further recovery. RSI and most indicators shows that bulls are in control
Charles Hoskinson, the founder of Cardano, announced that Atala PRISM, the project’s decentralized identity solution, is being open-core adopted by an unannounced large open source foundation. This move aims to accelerate the commercialization of decentralized identifiers and enhance the adoption of secure, private identity management.Atala PRISM is built on the Cardano blockchain, offering a unique approach to identity management where users retain ownership of their identity and have full control over the use and access of their personal data. This decentralized solution ensures that data is shared only through secure, private peer-to-peer communication channels, making it suitable for businesses, governments, and individuals.
Atala PRISM offers numerous advantages for various stakeholders. Businesses can quickly onboard new customers, reduce compliance risks and costs, and deliver seamless user experiences. Governments can issue digital identities and enable instant access to public and private services. Individuals gain ownership of their identity and data, controlling how their personal information is used and accessed
are you bullish on ADA or you think we talking about a stablecoin !?

Alikze »» CAKE | Dynamic trigger failure and pullback completionIn time 1W, after a zigzag correction, it will have the ability to rise to the targets specified in the chart by breaking the dynamic trigger and pullback to it by breaking the most important neck line resistance. According to the current motivational wave, this step can be fast. But its first supply zone will be in the range of 4.8 to 5.4 dollars.
»»»«««»»»«««»»»«««
Please support this idea with a LIKE and COMMENT if you find it useful and Click "Follow" on our profile if you'd like these trade ideas delivered straight to your email in the future.
Thanks for your continued support.
Sincerely.❤️
»»»«««»»»«««»»»«««

Everything Suggests 33c Cardano ADACardano broke down from it's consolidation structure and is now headed to the next level at 33c.
33c is:
- The next major level of support
- The 1.618 of a bullish butterfly (although not perfect)
- The exact measured move of the triangle
We had a bullish bias towards this consolidation structure, as we did for many of the altcoins, however that has now changed and we flipped bearish on the market short - mid term.
We managed to get out of the posted positions early before having to take significant losses.
Now the game plan is to short assets like cardano until they reach the next level or a bullish structure develops. The bearish bias will remain until this changes and we will constantly update. We will also not own or buy any of these assets until then.
As of right now we are short from 42.3c and will update with continuation patterns. We expect this to last a month or two from now before getting a clearer long term picture.

ADA Cardano analysisADA is one of the best crypto in market. Fundamental very strong. Technical strong.

ADA is bearish in the medium termBefore anything, pay attention to the time frame. The time frame of this analysis is 3 days and the realization of the specified movements will take time.
The structure is bearish on the big time frames and these big and powerful bearish moves are needed to get to the SW Hs of the big time frames.
We have a demand range, which is actually our POI, and we are looking for medium and long-term purchases in this range.
The target can be the supply box for the medium or long term.
If ADA reaches this range, we will look for buy/long positions.
Closing a daily candle above the invalidation level will violate the analysis.
Note that the financial market is risky, so:
Do not enter any position without confirmation and trigger.
Do not enter a position without setting a stop.
Do not enter a position without capital management.
When we reach the first TP, save some profit and try to move the stop continuously in the direction of your profit.
If you have any comments please post them, comments will help us improve our performance
Thanks

Is ADAUSDT About to Take Off? Don't Miss This Key Opportunity!Yello Paradisers! Are you ready to dive into an exciting opportunity with ADAUSDT? Right now, the market sentiments are leaning bullish, and there’s a high probability that Cardano will take a bullish ride.
💎We've observed that #Cardano has successfully broken above a key resistance level at $0.4078. If it manages to sustain this momentum, there's a high probability of a significant upward move. Previously, #ADA followed a descending resistance line for a long time, and its recent breakout indicates a potential upward trend.
💎With the current bullish sentiment, if the price sustains and the bulls remain in control, we can expect a move targeting levels above the strong resistance zone.
💎However, what if #ADA faces a strong rejection from the internal resistance at $0.4942 and loses momentum? As savvy traders, we should look for a bullish rebound after a proper retest confirmation at the lower support level of $0.3633.
💎During this phase, many inexperienced traders might immediately open short positions and get trapped. If the price breaks below this support and it turns into resistance, it's time to plan short positions as the market could drop significantly.
Strive for consistency, not quick profits. Treat the market as a businessman, not as a gambler.
MyCryptoParadise
iFeel the success🌴

seems like ada getting ready for recovery seems like healthy correction has completed and finally ada getting ready for solid recovery
forming falling wedge in h12 timeframe expecting upside breakout soon expecting new yearly high incoming days incase of successful breakout
easy target for me will be around 0.80$ after successful breakout
