short ADACRYPTOCAP:ADA bounced off the resistance level and the descending trendline. Decline to support level at $0.53 is expected to happen.
J-ADA

Cardano is showing signs of strength.Hey, its Dalin!
Loving this setup on ADA.
Cardano is really showing a classical market cycle structure.
Altcoins tend to do this exact pattern.
- Dalin Anderson

ADA/USDT Facing in the key level area. It required break!💎 ADA has indeed garnered significant attention in the market with its impeccable rounding bottom movement. Presently, ADA encounters a formidable supply area and encounters difficulty in breaking through. Observing the candlesticks for any bearish rejections, if ADA fails to breach the supply area in the near future, it could validate a rejection, signaling a potential downward movement toward the demand area at $0.312. This probability could initiate a robust new momentum, gearing up for another attempt to break the resilient supply zone.
💎 On the flip side, if ADA decisively breaks the supply area with a confirmed candle closure above, the path could be paved for ADA to sustain its upward trajectory, making it easier to attain our target supply area in the coming days.
💎 The unfavorable scenario unfolds if ADA, during the retesting phase at the $0.312 demand area, fails to maintain its position and breaches the demand zone. In such a scenario, ADA could revert to a bearish trajectory, potentially retracing to the robust support area.

ADA: Overbought at ResistanceTrade setup : Following a bullish breakout from Ascending Triangle pattern, price resumed its uptrend and broke above $0.46 resistance as well. However, price is now very overbought (RSI > 80!) just as it reached that $0.60 resistance. Hence, near-term, we’re likely to see it pause here on some profit taking.
Trend : Uptrend across all time horizons (Short- Medium- and Long-Term).
Momentum is Bullish but extremely overbought. ( MACD Line is above MACD Signal Line). RSI is bullish (> 55) but extremely overbought (> 80) which could imply that price could briefly pause or pull back if it reaches Resistance.
Support and Resistance : Nearest Support Zone is $0.40 - $0.42 (previous resistance), then $0.30. The nearest Resistance Zone is $0.46, which it broke, then $0.60.

ADA Cardano: Breakout after Breakout Hey Crypto Enthusiasts! 👋 It's time to zoom in on ADA Cardano, an altcoin showing some serious moves in the market! Let’s dive into the details and chart out the path ahead.
ADA Cardano's Current Position:
📈 Recent Major Breakout! The charts are speaking loud and clear.
🎯 Heading towards a key target of 0.6844.
Support and Resistance Levels:
🛑 Current Support: Firmly established at 0.52.
🧗 Next Big Leap: If we break past the current level, we’re eyeing a surge over 0.7 cents – a potential gateway to 1.19.
Step-by-Step Analysis:
🧐 It's all about taking it one step at a time. Right now, focus on the 0.6865 target.
⚖️ Balancing expectations with market realities is key.
Long-Term Outlook:
🚀 Potential for massive gains if specific resistance levels are breached.
📊 Watch for a steady climb towards our ultimate targets.
Trading Strategy:
🌟 Don't rush in! Careful analysis and patience are your best allies in navigating Cardano’s trajectory.
📝 Keep an eye on the support levels and prepare for potential shifts in the market.
Final Thoughts:
🌐 ADA Cardano is more than just numbers on a chart – it represents the pulse of the evolving crypto world.
👀 Stay tuned for more updates as we track its journey.
Trade wisely, stay informed, and let's catch the next wave of opportunities together! 💙
One Love,
Your Professor 💙

🔥 ADA's Best Possible Trade: Don't Miss The Entry! 🚨Last month I made an analysis on ADA and the huge parallel channel it has been trading in for almost 4 years at this point. In said analysis I wrote that my long-term target for ADA is placed at 35$ (or the top of the channel, whichever comes first).
The trade is playing out well. However, the 3-day RSI has hit a new record high of 90.37 at the moment of writing. Historically, this has signaled a local top was near.
I doubt that we're going to see 0.38 in the next correction. Still, a correction towards the 0.50$ is still possible after being so far extended.
Don't miss out on the correction. Prepare yourself for any near-term weakness in this token.

🔥 ADA Aggressive Bull-Flag SignalThis signal is based on the idea that ADA is currently trading inside a bullish flag pattern, consolidating before the next break out.
We're going to assume that the lows of the flag are already in and that the break out will occur shortly, hence the aggressive nature of the trade.
Stop below the recent low, target at 0.6$. A more patient trader might want to wait for the break out to be confirmed, which will result in a lower risk-reward.

MINSWAP - Gems Series - 10x to 30xGreetings,
Welcome back to Gems Series!
Due to recent moves in cryptosphere, we will to to publish multiple Gems every day.
First one for today is Minswap and it's token Min.
This coin bottomed a few weeks ago then broke out consolidated and broke out again today.
This project is built on Cardano blockchain and today's move was on the bake of Cardano's own move up. Currently Cardano has only reached about 19% of it's previous all time high and a lot of room to grow. Minswap is one of the best project currently productive on Cardano and a DEX no less therefore this is definitly a GEM!
Here is the report on the selection criteria.
1- Project Status = Active
2- Industry = DeFi (Decentralized Exchange)
3- Community Involvement = Healthy
4- Prominent Listings = None - On Minswap itself
5- MarketCap = $60M
6- Coin Supply = Cir: 1.02B, Tot: 5B
This a small cap and has a lot of room to grow. Based on the factors, this coin has a potential for 10x to 30x rally.
Note: This is not financial advise and shall only be used for educational and/or entertainment purpose. Please do your own research before investing. Crypto Markets are highly volatile and you are responsible for the risk of losing your entire investment.

ADAUSDT - WHALES Prefer a Lower Entry🐳Hi Traders, Investors and Speculators of the Charts 📈📉
A quick look at the Fractal that played out on Cardano during Jan - Feb 2021.
A Big demand zone lies a little lower towards the support, and if we take a quick look at Phoenix Ascending (EMA, RSI, LSMA and Momentum) more downward price action seems the most likely for the near future. However, trying to catch the exact bottom is a dangerous game, and I am happy with this entry and perhaps a little lower towards the lower support zone as pointed out on the chart.
If you like Fractals; you'll probably love this idea on BTC:
_______________________
📢Follow us here on TradingView for daily updates and trade ideas on crypto , stocks and commodities 💎Hit like & Follow 👍
We thank you for your support !
CryptoCheck

Cardano's ($ADA) Golden Cross MovementTechnical Analysis
After trading sideways for the entire month of November 2023, ADA has reignited its upward trend, reaching a yearly high of $0.49. This increase in ADA’s value could be partially credited to the stabilization in the BTC price, which has enabled various altcoins to start regaining strength.
The immediate target for ADA investors is the psychological level of $0.5. Reaching this mark could lead to a temporary pullback. However, if ADA successfully surpasses this level promptly, it could potentially accelerate the uptrend.
A downward correction for ADA seems unlikely for now. In the event of a decrease, the asset might test support levels at $0.440-$0.460, $0.430, and $0.407-$0.420. ADA's overall positive trajectory is likely to continue as long as the BTC price remains stable above $39,000.
Candle sticks indicating bullish Movement
Three white Soldiers is depicted on this candle stick with a long doji being the retest here the market will keep on surging till the bulls get tired.
The 50-day Moving Average interpolates and crosses the 200-day moving average showing signs of a "Golden Cross" indicating further bullish trend.

AMP 1hr BullishAMP 1hr - Still looking good here. Would like to see an hourly close above 0.00358 and for us to take out the last high at 0.0038 for continuation. If not, I believe we may be range bound between 0.00309-0.00358 before moving higher.

🚧Cardano is Bullish now🚧 & many Traders don't see it 👀!!!ADAUSDT is in an ascending triangle which means the price is about to do a good bullish movement. The price can increase as much as the measured price movement ( AB=CD ) .The break out needed for increasing further has not happened but it should happen pretty soon.
🤑Stay awesome my friends.
_ _ _ _ _ _ _ _ _ _ _ _ _ _ _ _ _ _ _ _ _ _ _ _ _ _ _ _ _ _ _ _ _
✅Thank you, and for more ideas, hit ❤️Like❤️ and 🌟Follow🌟!
⤵️⤵️⤵️⤵️⤵️⤵️⤵️⤵️⤵️⤵️⤵️⤵️⤵️⤵️⤵️⤵️⤵️⤵️⤵️⤵️⤵️⤵️⤵️

ADA → TriangleWe have a possible Triangle pattern with a target at 0.46, as long as the price does not break the 0.37 zone.

Resistance of $0.45The current market valuation of ADA (Cardano) is exhibiting a significant approach towards a crucial resistance level, marked at $0.45.
This juncture is pivotal, as a successful breach above this threshold could potentially initiate an upward trajectory targeting the $0.50 mark, with a further possibility of extending gains towards the $0.55 level.
Conversely, should there be a rejection at this resistance point, ADA might find its immediate support around the $0.37 zone, which would be the next focal point for investors to monitor.
This analysis is for informational purposes only and should not be considered as financial advice.

ADA - Break or Make Zone ⁉️Hello TradingView Family / Fellow Traders,
ADA is currently hovering around a robust resistance zone highlighted in blue.
Weekly Chart:
📈 To maintain control and establish a long-term bullish perspective , a weekly candle close above 0.465 is essential for the bulls.
If achieved, a movement toward the next resistance at approximately 0.8 could be anticipated.
H4 Chart:
📉 Conversely , the bulls will remain in control unless the last low in red at 0.393 is broken downward.
In this case a bearish correction till the 0.31 mark would be expected.
📚 Always follow your trading plan regarding entry, risk management, and trade management.
Good luck!
All Strategies Are Good; If Managed Properly!
~Richard Nasr

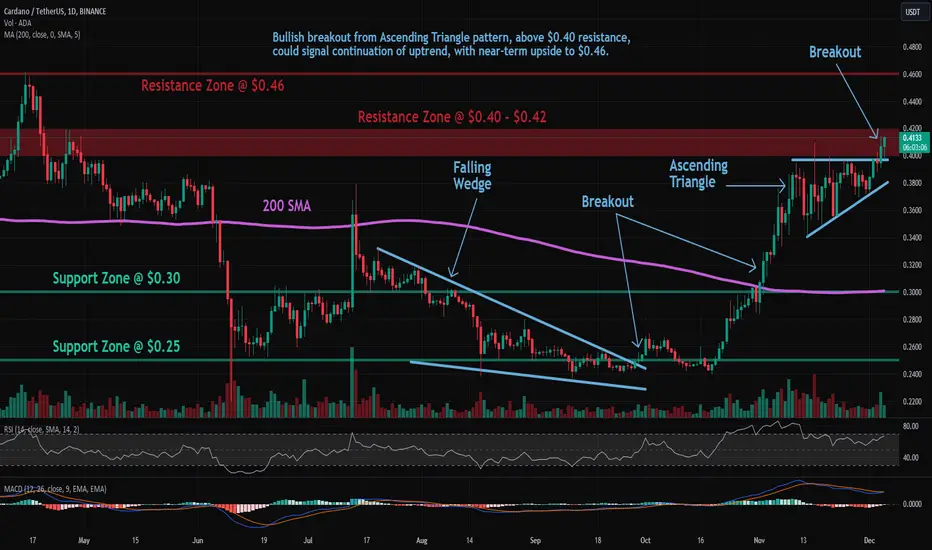
ADA: Ascending Triangle BreakoutCardano (ADA) technical analysis:
Trade setup : Bullish breakout from Ascending Triangle pattern, above $0.40 resistance, could signal continuation of uptrend, with near-term upside to $0.46. Previously, price broke above 200-day moving average ($0.30), which confirmed a bullish trend reversal to an Uptrend.
Pattern : Ascending Triangle which is a continuation pattern (it typically breaks out in the direction of existing trend). Most traders wait for a breakout but Swing traders could trade between the trendlines (Buy at Support, Sell at Resistance) as long as the trendlines are still relatively far apart.
Trend : Uptrend across all time horizons (Short- Medium- and Long-Term).
Momentum is Mixed as MACD Line is below MACD Signal Line (Bearish) but RSI > 55 (Bullish). MACD Histogram bars are rising, which suggests that momentum could be nearing another upswing.
Support and Resistance : Nearest Support Zone is $0.30 (previous resistance), then $0.25. The nearest Resistance Zone is $0.040 – $0.42, then $0.46.
#ADA #CardanoIt is moving in an ascending triangle, which can escape from the top of the triangle towards the daily targets and touch the specified targets by breaking the sub-swing of the corner pattern. Therefore, after breaking the triangle and confirming the pullback, it is possible to enter a buy position around the specified targets.

$ada Cardano ready to breakout of accumulation Any day now LSE:ADA will breakout of over a year of accumulation. It is one of the few coins that haven't seen a significant rally as of yet. That is about to change in my opinion. A conservative price target would be $1.05ish where the 77 Vwma currently sits. A 155% gain. A timeframe on this would be about 2 months to target.

Start renge ADA❤️❤️Thanks for boosting 🚀 and supporting us!
📈Start renge trend and entry to position sell in resistace & buy in support.
📊 (sell) : 0.3946
🔴 Stop Loss : 0.4122
🎯 Take Profit : 0.3441
🔗 For more communication with us, send a message in TradingView.

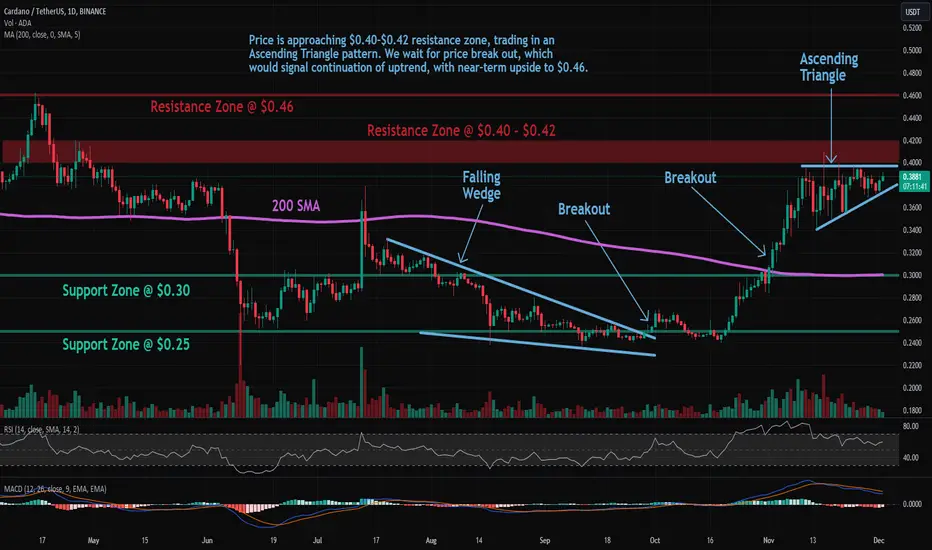
ADA: Ascending TriangleTrade setup : Price is approaching $0.40-$0.42 resistance zone, trading in an Ascending Triangle pattern. We wait for price break out, which would signal continuation of uptrend, with near-term upside to $0.46. Previously, price broke above 200-day moving average ($0.30), which confirmed a bullish trend reversal to an Uptrend.
Pattern : Ascending Triangle which is a continuation pattern (it typically breaks out in the direction of existing trend). Most traders wait for a breakout but Swing traders could trade between the trendlines (Buy at Support, Sell at Resistance) as long as the trendlines are still relatively far apart.
Trend : Uptrend across all time horizons (Short- Medium- and Long-Term).
Momentum is Mixed as MACD Line is below MACD Signal Line (Bearish) but RSI > 55 (Bullish).
Support and Resistance : Nearest Support Zone is $0.30 (previous resistance), then $0.25. The nearest Resistance Zone is $0.040 - $0.42, then $0.46.
DYDX flight is not over yet!Hello trader! Today I have a new idea for you. Like and subscribe to the channel, there is a lot of useful information there.✅
Technical: prolonged growth has formed a structure with a downward movement and has broken through the local countertrend, there is the potential to reach an update high towards $3.9-4.
I do not rule out that there may soon be a squeeze movement down all alts, so be careful with your leverage! In theory, you can try to take 10-15% from here without leverage.

ETH - it seems that the trend line is about to be brokenHello trader! Today I have a new idea for you. Like and subscribe to the channel, there is a lot of useful information there.✅
Friends, pay attention to the local ETH chart with a clearly defined trend line, the last rebound from which was 3.5%.
I think that soon we will see a possible small pullback here with a possible breakdown of the trend line; from the technical side, after the breakdown, there may be a spill below $2000.

You took a short position from the current ones, are you waitingHello trader! Today I have a new idea for you. Like and subscribe to the channel, there is a lot of useful information there.✅
I’m trying to catch a rollback towards the trend line from the current values. I allocated 15% of the deposit for shorting with a leverage of 3X.
Deal plan:
▪️Entrance - $38,820/39,150
▪️Stop - $40,150
▪️Take - I will update
Guys, the deal looks a little dangerous, so be careful! I set the stop taking into account the expansion of the position with averaging of the entry point (-2.5% without X), you can use a different MM depending on the leverage. Goal: see a breakout of the trend line.
