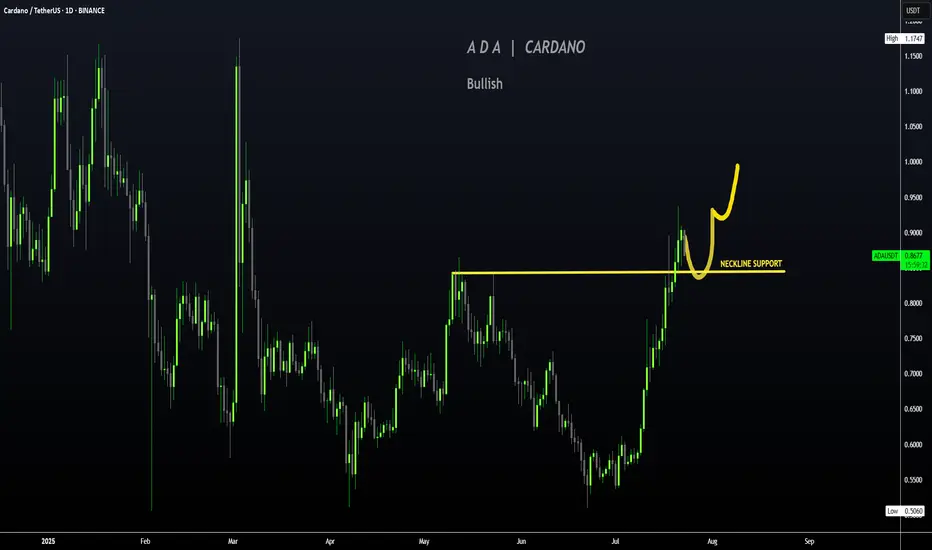
ADA Ready for PUMP or what ?ADA has successfully broken out of the falling wedge pattern and retested the breakout zone,the price is holding firmly above previous resistance, which now acts as strong support.
Continued strength could lead to upward movement toward targets at $0.87 , $0.93 and $1.20...
Stay Awesome , CobraVanguard
J-ADA

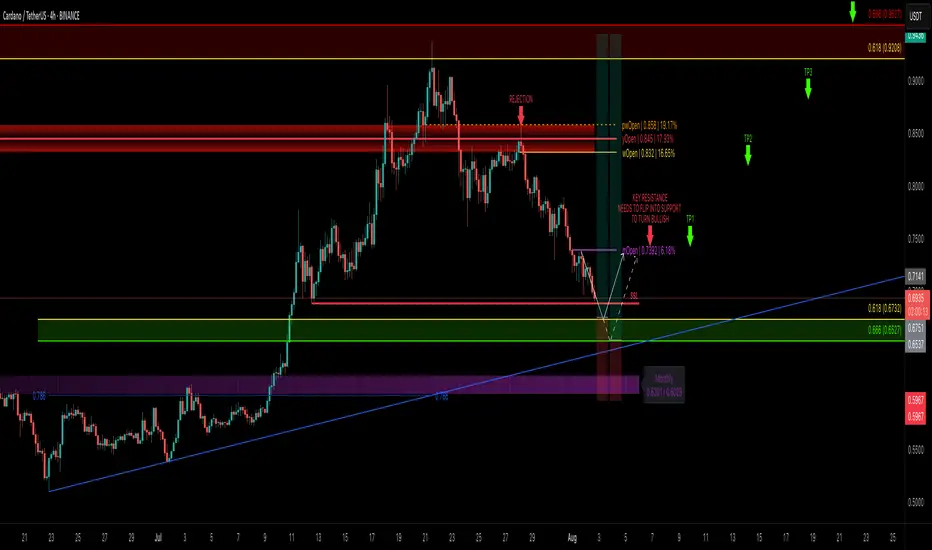
ADA Correction Nearing Completion — Is It Time to Load Up?After tagging the golden pocket resistance zone between $0.9208–$0.9527, ADA completed a clean 5-wave Elliott impulse right into a major resistance. Since then, price has corrected -25%, and we’re now likely nearing the end of an ABC correction — the final wave C.
🧩 Technical Breakdown
➡️ Wave A: 5-wave drop after the peak
➡️ Wave B: Bounce rejected at yearly open (yOpen) — that was a great short opportunity around $0.845
➡️ Wave C: Now working toward completion
🎯 C Wave Target Zone: $0.69–$0.65
This zone has strong confluence:
0.618 Fib retracement of the entire 5-wave move at $0.6732
1.0 TBFE (Trend-Based Fib Extension) aligns perfectly
Sell-side liquidity (SSL)
0.786 Fib Speed Fan support
Monthly 21 EMA/SMA adding a final confluence layer
🟢 Long Setup
Entry Zone: $0.69–$0.65 (ladder in)
Stop Loss: Below the monthly 21 EMA/SMA ($0.6)
Target 1: mOpen key resistance
Target 4: 0.666 Fib at ~$0.95
Risk:Reward: ~1:4+
💡 Educational Insight
After a 5-wave impulsive move, ABC corrections are common. Using the Trend-Based Fib Extension tool to project wave C, especially when paired with liquidity zones, VWAP, or moving averages, helps pinpoint high-probability reversal zones. It’s about confluence and reaction — not prediction.
🔍 Indicators
For this analysis, I’m using my own indicators
DriftLine – Pivot Open Zones and
MFT MA Support/Resistance Zones
both available for free. You can find them on my profile under “Scripts” and apply them directly to your charts for extra confluence when planning your trades.
_________________________________
💬 If you found this helpful, drop a like and comment!
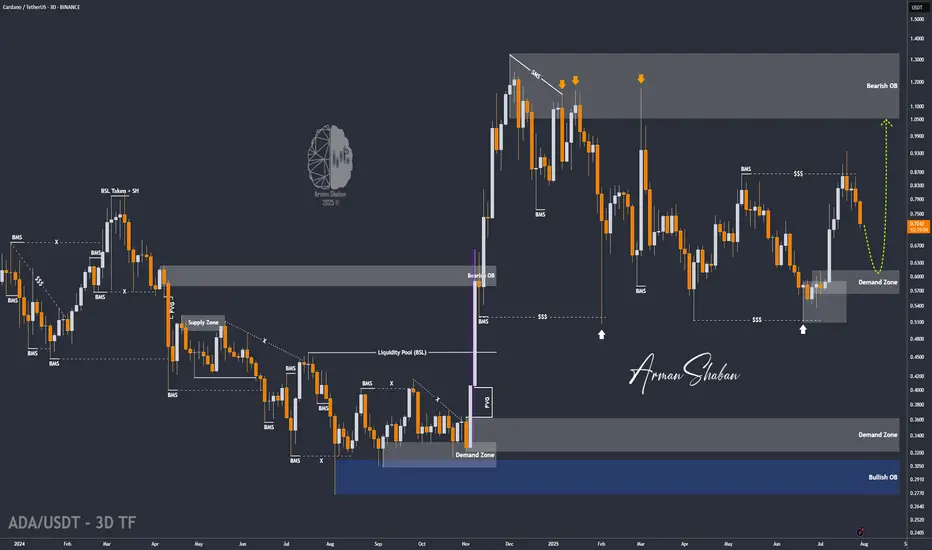
ADA/USDT | ADA Slips Below Support – Watching $0.61 for Support!By analyzing the Cardano chart on the 3-day timeframe, we can see that the price failed to hold above the $0.75 support and is currently trading around $0.72. Given the current momentum, a deeper correction for ADA seems likely. If the price fails to stabilize above $0.69, we could see a sharp drop toward the $0.61 zone. If ADA reaches this key support area, keep a close eye on it — a strong bullish reaction could lead to the next big upside move!
Please support me with your likes and comments to motivate me to share more analysis with you and share your opinion about the possible trend of this chart with me !
Best Regards , Arman Shaban
An Example of Trading a Coin (Token) You're Hesitant to Trade
Hello, fellow traders!
By "Following," you'll always get the latest information quickly. Have a great day today.
-------------------------------------
There are coins (tokens) that are showing positive trends, but are reluctant to trade.
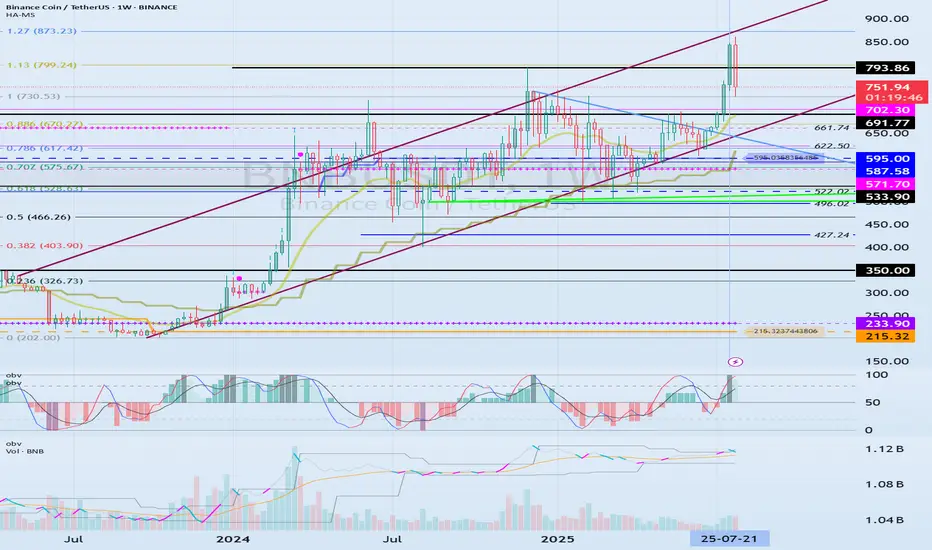
BNB and TRX are two such coins.
(BNBUSDT 1W chart)
(TRXUSDT 1W chart)
What these two coins have in common is that their representatives are Chinese.
These two coins are consistently making efforts to expand globally.
BNB is ranked first among exchange-traded coins, while TRX is steadily making efforts to expand into the US market to expand globally.
Despite this, some are reluctant to trade due to concerns about being an exchange-traded coin and being a Chinese coin.
To mitigate this risk, it's best to increase the number of coins (tokens) that ultimately generate profits.
In other words, by selling the amount of the original purchase price, you retain the number of coins (tokens) that represent profit.
This way, even if the price plummets, you'll always be in profit, allowing you to seize new opportunities.
For coins (tokens) that demonstrate long-term growth potential, increasing the number of coins (tokens) that represent profit is recommended. While these coins (tokens) appear to have potential for long-term growth, they currently carry some risk.
This also applies to coins that are considered worth holding for the long term, such as BTC and ETH.
Therefore, coins (tokens) that have a large user base and are considered to have future value, such as XRP, ADA, SOL, and DOGE, still carry some risk.
-
Thank you for reading to the end.
I wish you a successful trading experience.
--------------------------------------------------
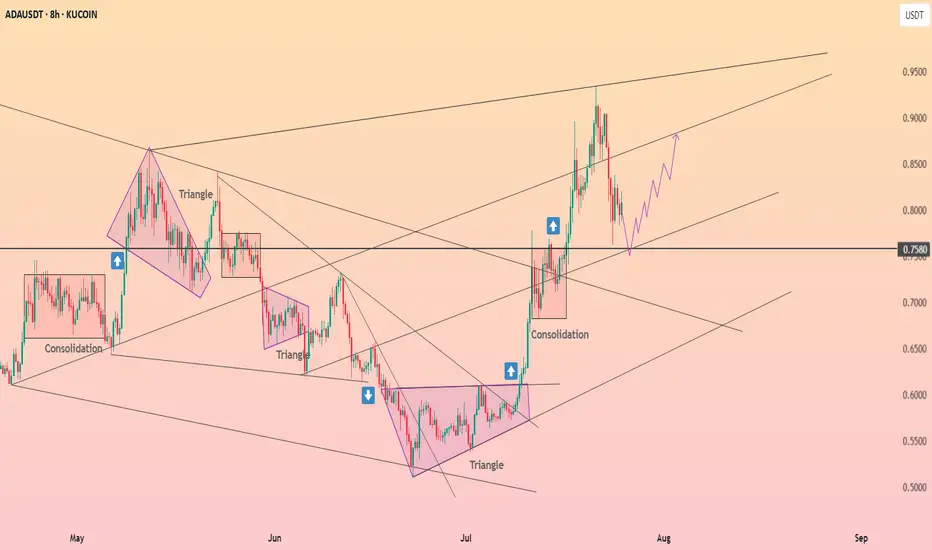
ADA Ready for PUMP or what ?The price on the 3d timeframe is within a triangle, which can create some uncertainty about which direction it will move. Here, we should wait to see which side of the triangle the price breaks out from. Remember, the trend is our friend.
Best regards CobraVanguard.💚

ADA Setup – Eyeing Entry After 70%+ RallyCardano (ADA) has surged over 70% in recent weeks. A healthy pullback is underway, and we’re watching the key support zone for a potential long entry targeting the next leg higher.
📌 Trade Setup:
• Entry Zone: $0.65 – $0.67
• Take Profit Targets:
o 🥇 $0.98 – $1.15
o 🥈 $1.50 – $1.60
• Stop Loss: Just below $0.62

Cardano has successfully completed retesting ┆ HolderStatBINANCE:ADAUSDT is trading inside a symmetrical triangle near support at $0.445. Price continues to coil tightly with lower highs and higher lows, building pressure. A breakout above $0.465 would confirm bullish momentum toward the $0.49–0.50 zone. Key support remains intact and buyers are stepping in at every dip. A major move looks imminent.

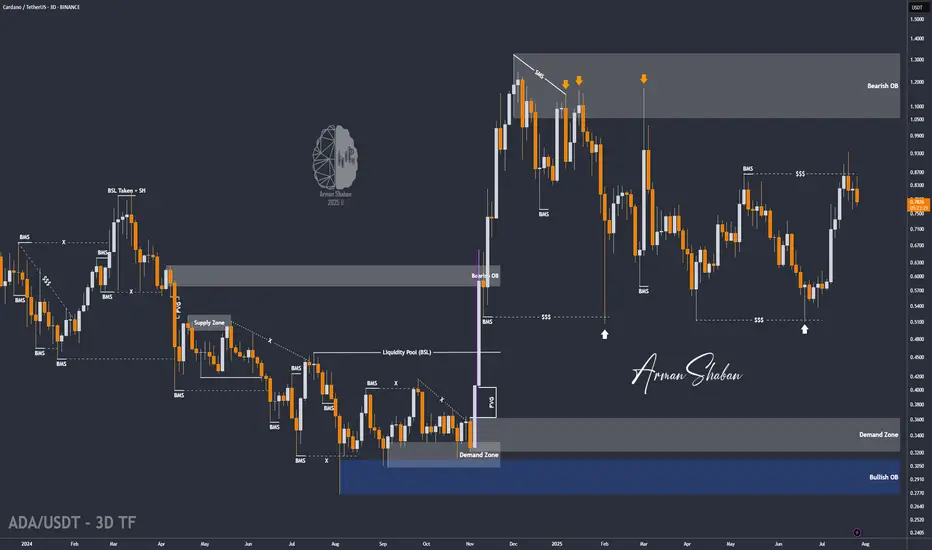
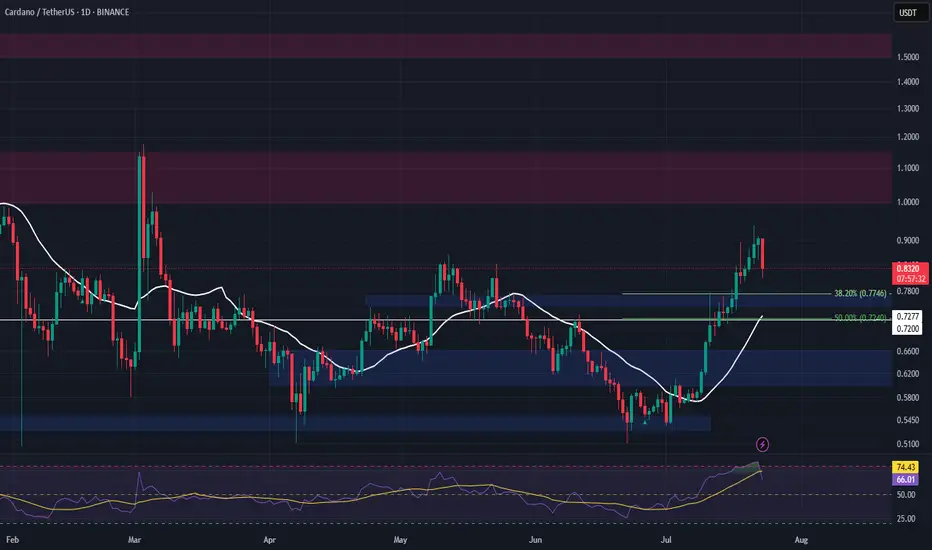
ADA/USDT | Pullback to Key Support – Can It Rebound Toward $1.32By analyzing the Cardano chart on the 3-day timeframe, we can see that after reaching $0.935, the price faced selling pressure and dropped by 18% to the $0.76 area. Now, the key is whether ADA can hold above the $0.75 level by the end of the week. If it succeeds, we could expect further bullish continuation. The next potential targets are $0.86, $0.93, $1.02, and $1.32.
Please support me with your likes and comments to motivate me to share more analysis with you and share your opinion about the possible trend of this chart with me !
Best Regards , Arman Shaban
ADA - Time to buy again! (Update)The pattern has broken, and now I expect the price to rise to $1.20 . AB=CD.
Give me some energy !!
✨We spend hours finding potential opportunities and writing useful ideas, we would be happy if you support us.
Best regards CobraVanguard.💚
_ _ _ _ __ _ _ _ _ _ _ _ _ _ _ _ _ _ _ _ _ _ _ _ _ _ _ _ _ _ _ _
✅Thank you, and for more ideas, hit ❤️Like❤️ and 🌟Follow🌟!
⚠️Things can change...
The markets are always changing and even with all these signals, the market changes tend to be strong and fast!!

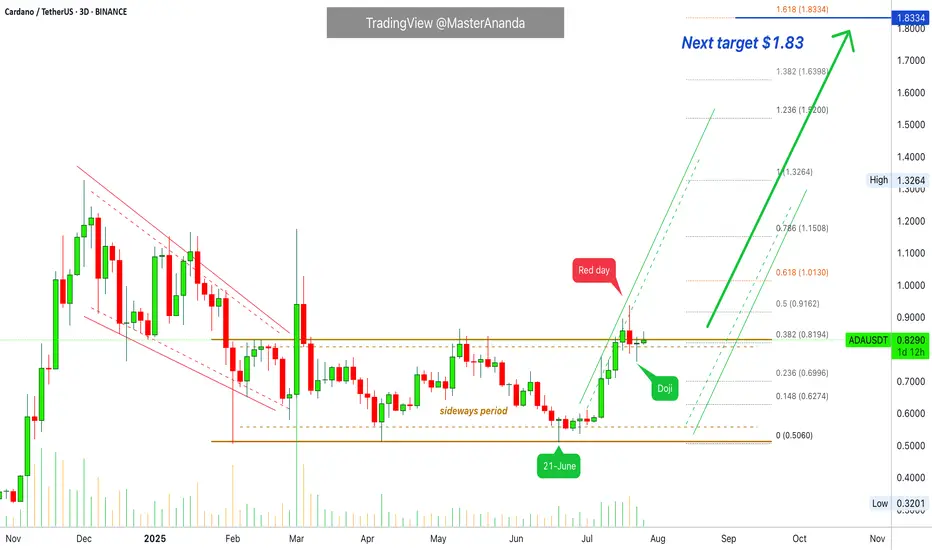
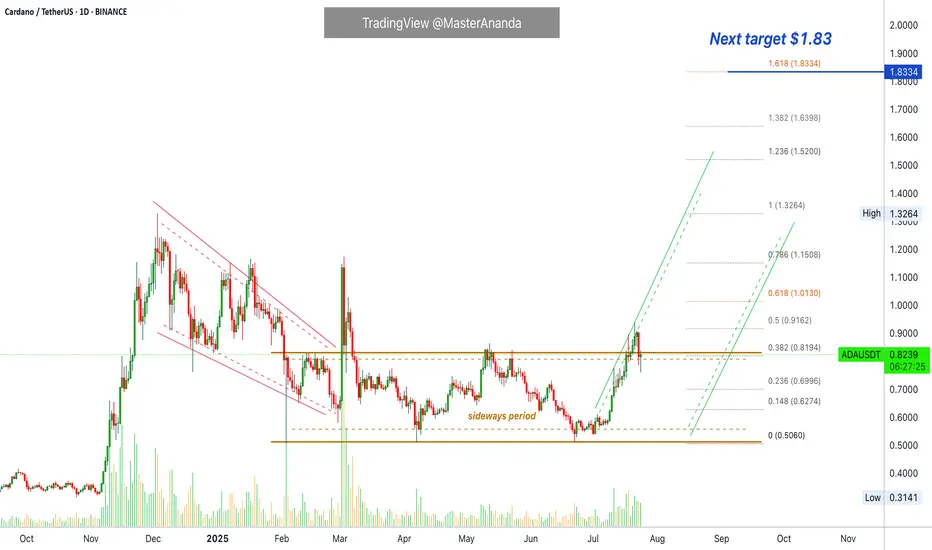
Cardano Update · Wait For New ATH Before Selling · Chart BullishI am using 3D candles. The last session is a Doji on ADAUSDT. There was a red session followed by a continuation with prices moving lower. That's last session, but it—the Doji—ended up closing green.
Sellers started to put pressure on the market and pushed prices lower (red day), by the next session, all selling was bought (Doji) and now ADAUSDT is back above 0.382 Fib. extension (0.8194). This is a bullish setup based on candlestick reading.
From here on ADAUSDT can grow to produce a higher high as long as it trades above this Fib. level, the continuation of the bullish move that started 21-June. So we had a small retrace and the action is recovering, right before bullish momentum grows, which means that this is a good setup to go LONG. It seems some positive event will develop soon and this will create a major wave, a major advance here and Cardano will see the highest prices in more than four years.
It can take a few days, not much longer; everything is pointing higher.
Here it is also wise to avoid selling too early. When we consider Cardano's potential for growth beyond $7, easily, we have to avoid paying attention to the temptation to sell when prices are still too low, the rise is only starting. It is ok to sell at major resistance levels if you have experience because there is always a stop before additional growth. If one is very active, it is easy to sell some at resistance and then buy more at support. But the easiest way is to buy and hold. If the entire bullish wave is set to produce 500%, this is always more than good enough so it is easy to hold thinking of the long-term.
We continue within the accumulation phase. While many pairs are already advanced and while prices are definitely growing, this is not it yet; things are about to go wild and it is better to be fully invested before the event. Everything Crypto. Buy Crypto. Hold Crypto. We are going up.
Namaste.
CARDANO | ADA Creeping UP to $1Cardano has made a big move in recent weeks, boasting a 77% increase.
If you were lucky enough to buy in around 30 or 40c, this may be a great TP zone:
Looking at the Technical Indicator (moving averages), we can see the price makes its parabolic increases ABOVE - which is exactly where we are currently beginning to trade. This could mean more upside is likely, and the 1$ zone is a big psychological resistance zone:
A continuation of the current correction may look something like this for the next few weeks:
_____________________
BINANCE:ADAUSDT
THE TRUTH ABOUT DOGECOINDogecoin is looking really toppy. As you can see the RSI has peaked out early before a new high which is alarming. I think Doge is in serious trouble here as the meme craze starts to shift into newer memes. If the head and shoulders pattern plays out you're looking at a catastrophic drop down to 2 tenths of a penny. Doge is EXTREMELY overvalued and needs to come back down to earth. Don't forget there is close to 15 million Doge mined per day forever. It appears with the way the RSI peaked and price didn't break the high that Doge has reached a plateau in price even if the market cap continues to go up.
Not financial advice just my opinion.

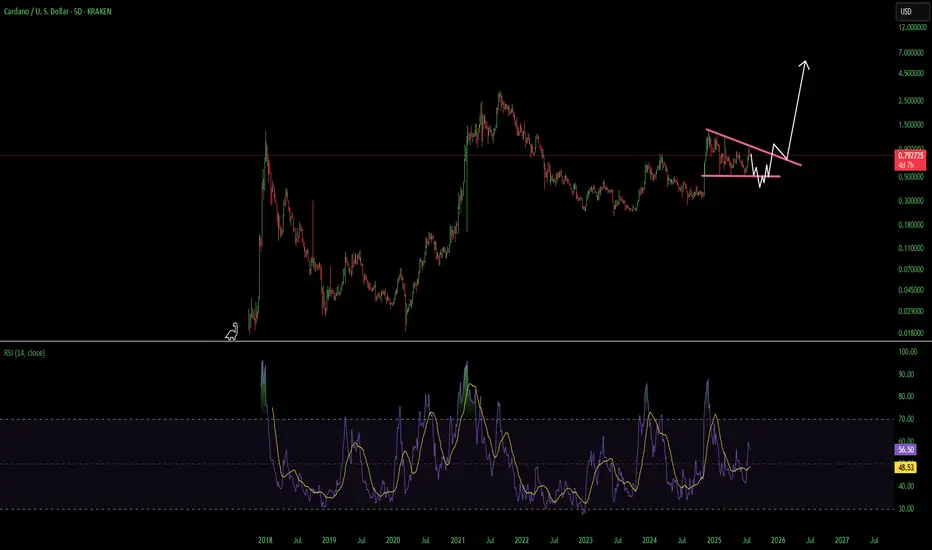
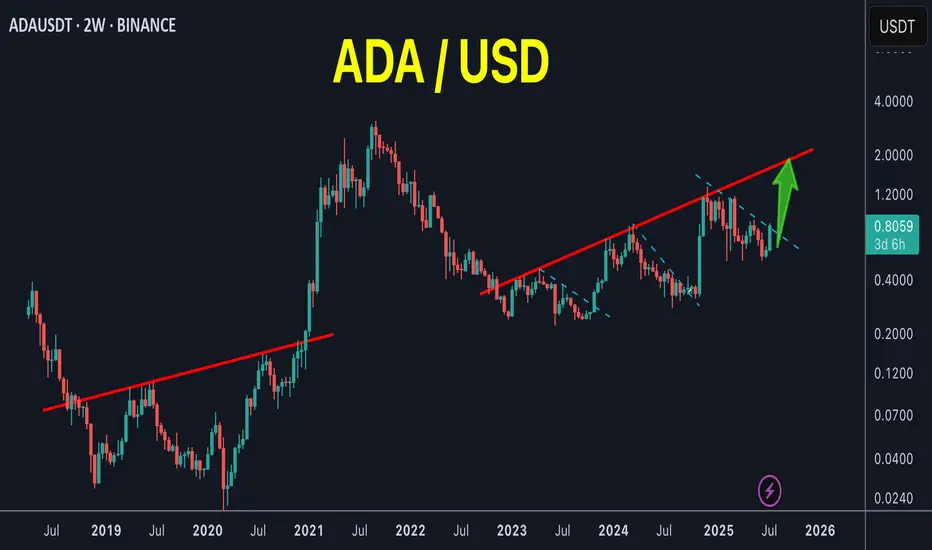
ATH for ADA soonChart says it all, ADA looks prime to run, could reach as high as $6.80
1. Technological Upgrades and Hard ForksThe Plomin Hard Fork in Q1 2025 enhanced governance, while upcoming features like Leios for scalability, BTC DeFi interoperability, L2s, and partnerchains boost efficiency and adoption, positioning Cardano as a leader in secure, sustainable blockchain tech.
2. Spot ETF Speculation and Institutional InterestGrayscale's pending ADA ETF filing with Nasdaq, plus inclusion in their Large Cap ETF, could unlock massive demand. Analysts see this as a game-changer, similar to Bitcoin/ETH ETFs, potentially driving prices to $5+ by year-end.
3. Ecosystem Expansion and IntegrationsNew tools like the EMURGO global Cardano card for ADA payments, Blockchain.com DeFi wallet integration (37M users), and Tokeo Wallet's XRP bridge enhance real-world utility. DeFi TVL and on-chain activity (unique addresses +4.79%, active wallets +12%) are surging.
4. Whale Activity and On-Chain MomentumWhales are accumulating amid spikes in network volume and no downtimes/hacks. Features like privacy via Midnight Network and Charles Hoskinson's White House advisory role add credibility, fueling a "silent surge."
5. Technical Breakouts and Market CorrelationADA has formed bullish patterns like a golden cross, double-bottom, and breakout from descending channels, correlating with Bitcoin's rally. RSI at 76 signals strong momentum, with targets at $0.82–$1.18 short-term and up to $2.80+ long-term.
6. Airdrops and Community HypeUpcoming events like the Glacier airdrop and NIGHT airdrop are creating buzz, alongside Cardano's unmatched decentralization and energy efficiency, potentially sparking a 383% rally as in past cycles.

ADA Cardano Decsending Triangle Use Caution HereCardano had a heck of a move but i think its going to erase most if not all of it before it goes on its next leg up. A break over the overhead resistance line and finding support above would invalidate this. Not financial advice just my opinion. Thank you
Cardano held above $0.76 ┆ HolderStatBINANCE:ADAUSDT is compressing under $0.44 with support from $0.418. Breakout from wedge structure may target $0.462. If $0.418 breaks, downside risk opens to $0.40. Watch for volatility.
Cardano Has Plenty of Room To Grow · Will Hit Beyond $4 EasilyCardano's all-time high is $3.10. Cardano is currently trading at $0.82. Pause. You will be a genius when ADA is trading at $4 if you decide to buy below $1. It is not too late. This is only the start.
Good afternoon my fellow Cryptocurrency trader, how are you feeling in this wonderful day?
The first major advance for Cardano after the last bull market happened November 2024 and peaked December; we are still getting out of the consolidation that followed the correction of this bullish wave.
Only now Cardano is breaking a sideways channel and still trades below its December 2024 peak. Bitcoin is trading at a new all-time high and is preparing for a major move above $130,000. XRP is trading at a new all-time high and is not dropping. Ethereum is very close to a new all-time high and will certainly continue to grow, only days away. Cardano still has to break its March 2025 high, its December 2024 high; this is not bad, it only means that is still early for this amazing pair.
A bullish advance started 8-July and lasted only 13 days. We are seeing a small retrace now, three days with only one day red. Cardano will recover and continue growing. This growth will not be exhausted in a matter of weeks, it will go for months. Cardano has to grow straight up, daily, weekly, for a prolonged period of time to move beyond $4. But $4 is not the top, $7 and $8 are also possible.
The reason why the action might seen slow, is because this is only the start. Give it time, the market is giving us an opportunity to join. The market is giving everybody the opportunity to buy Cardano while prices are still low. You know how Crypto operates. When it starts moving, it goes so strong and so fast that there is no time to react. Act now and you will reap the reward.
The bullish cycle is confirmed. Just look around, what do you see?
Our sisters and cousins are rising. Our young children are growing; Crypto is going up.
Cardano is one of the main projects in this market and it will not stay behind. You will not be disappointed, you will be happy with the results.
Namaste.
HolderStat┆ADAUSD broke through the resistanceBINANCE:ADAUSDT is trading just below $0.406 after bouncing from $0.386. The setup favors a breakout if resistance is breached. Price structure remains bullish while above $0.386.

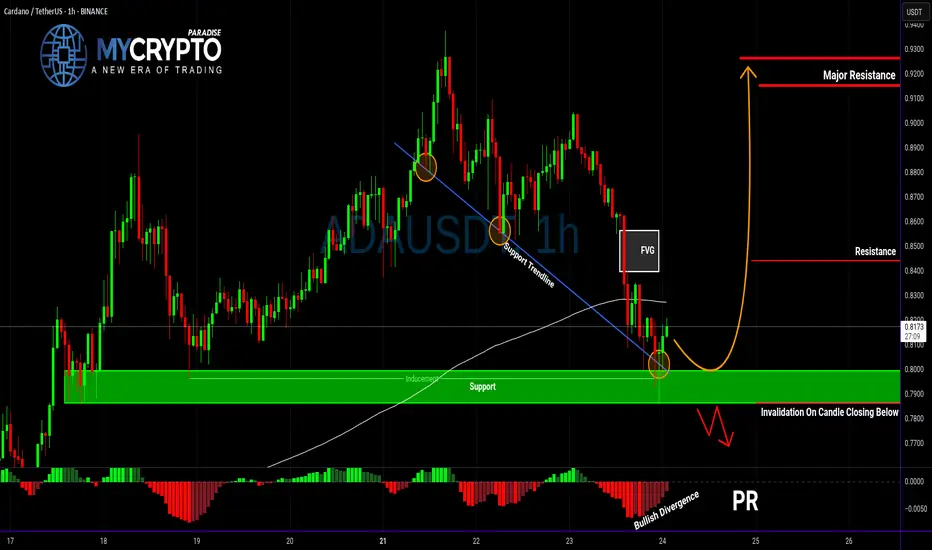
ADA About to Explode or Collapse?Yello Paradisers — is ADA gearing up for a breakout, or are we walking straight into a bull trap? After the recent pullback, the market is throwing mixed signals, but this setup is becoming too important to ignore. Here’s what we’re seeing right now on ADAUSDT.
💎ADA is currently showing positive signs of strength after a solid retracement. Current support zone is not only a historical price pivot, but it's also aligned with a supportive trendline, the 200 EMA, and a developing bullish divergence on the chart. All these factors combined are increasing the probability of a short-term bounce — but that doesn't mean we go in blind.
💎For aggressive traders, entering at the current price might make sense, especially if you’re targeting the first resistance level. However, it’s important to note that this entry offers a relatively limited reward compared to the risk — roughly a 1:1 risk-reward ratio — so it’s crucial to size your position accordingly and keep tight control over your stop loss.
💎If you're looking for a cleaner setup with a better risk-to-reward profile, patience is key. A more favorable scenario would be waiting for a proper pullback and a confirmed retest of the support zone. Ideally, you want to see a strong bullish candle at the support level to signal continuation — that’s when the setup shifts from average to high-probability.
💎But be cautious. If the price breaks down and closes a candle below our support zone, the entire bullish idea becomes invalid. In that case, it’s much wiser to step back and allow the market to develop more structure before re-engaging. Forcing trades in uncertain conditions is where most traders lose, and we don’t want to be part of that crowd.
🎖Strive for consistency, not quick profits. Treat the market as a businessman, not as a gambler. Be patient, Paradisers — only those who follow structured strategies and risk management will thrive in the long run.
MyCryptoParadise
iFeel the success🌴
ADA Spot Entry – Pullback Opportunity AheadADA has reached a major resistance zone, and with the broader market appearing overbought, a healthy pullback looks likely. We’re watching for a dip into the next key support area to accumulate for spot holdings.
📌 Trade Setup:
• Entry Zone: $0.75 – $0.77
• Take Profit Targets:
o 🥇 $1.00 – $1.15
o 🥈 $1.50 – $1.60
• Stop Loss: Just below $0.72
ADA/USDT Trade Idea – 15m (Following V–Trend Setup)Bias: LONG
🔍 Trade Breakdown:
V-Structure Identified:
Market formed a clear V-reversal structure, shifting from a bearish downtrend into a bullish uptrend. This is a key part of my setup — I look for these V-shaped reversals as confirmation of potential long entries.
Trendline Break + Structure Shift:
The red descending trendline was broken with strong bullish candles. Price also broke above a key structure level, confirming the bullish trend shift.
Risk Management Zone (RM):
Price pulled back into my Risk Management Zone (RM) — a demand zone marked by previous consolidation and imbalance. I do not enter on impulse, instead I wait for price to return to this zone for a safer entry.
NO FOMO Zone:
Highlighted in red — I avoid entering if price doesn't respect this zone. It helps me stay disciplined and avoid emotional trades.
Entry & Target:
Entry: Within RM zone (~0.8780–0.8845)
Stop Loss: Below RM zone (~0.8739)
Target: 0.9266
This gives a solid risk-to-reward setup in alignment with the trend.
✅ Strategy Checklist:
V-shaped recovery ✅
Structure break ✅
Pullback into RM ✅
No FOMO entry ✅
RR > 1:3 ✅
📌 Let the market come to you. Stay disciplined, trust the setup.
#ADAUSDT #CryptoTrading #VTrend #SmartMoney #PriceAction #NoFOMO #15mSetup #TradingView

ADA (repeat the pattern)ADA /USDT
ADA keeps repeating its old patterns as it’s clearly obvious in my chart
Breakout is going on lower time frames
Looks like an easy 2X
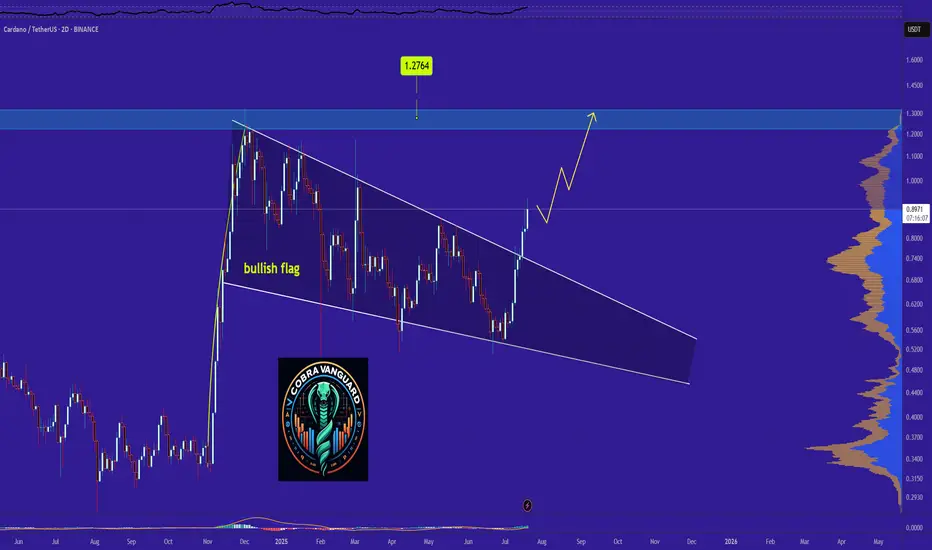
Why ADA Remains Bullish and Its Next Potential Move !The pattern has broken, and now I expect the price to rise to $1.27 . AB=CD.
Give me some energy !!
✨We spend hours finding potential opportunities and writing useful ideas, we would be happy if you support us.
Best regards CobraVanguard.💚
_ _ _ _ __ _ _ _ _ _ _ _ _ _ _ _ _ _ _ _ _ _ _ _ _ _ _ _ _ _ _ _
✅Thank you, and for more ideas, hit ❤️Like❤️ and 🌟Follow🌟!
⚠️Things can change...
The markets are always changing and even with all these signals, the market changes tend to be strong and fast!!
accordion to the moonhows and whys of the trade of way out of your IQ level,I'm an Iranian and i'm not going to make you muricans rich while you bomb my country. if it does break above it first high that it will form it becomes really high probability and that's why i published this.
