CARDANO's movement in Coming Days!!!🤑The ADAUSDT Broken the Falling Wedge Pattern.
🌟 Bullish signals in the PRZ area are:
- Support zone
- Pivot S1 weekly
- Falling Wedge Pattern
- Bullish SAR dots
❗and the Upward signals of market momentum are:
- Divergence in MACD
✅The price has been able to break this pattern upwardly. This means the price will be flying for now and we shall expect it to reach even higher levels.
⭐ Note if the PRZ is broken downwards with the strength of Bearish candles , this analysis of ours will be failed.
🤑The rich invest in time, the poor invest in money.
🔹🔹🔹🔹🔹🔹🔹🔹🔹🔹🔹🔹🔹🔹🔹🔹🔹🔹
✅Warren Buffett
✅If this post was useful for you, like it ❤️ and if you think it is useful for your friends, be sure to send it to them.
⏮️Previous Analysis:
_ _ _ _ _ _ _ _ _ _ _ _ _ _ _ _ _ _ _ _ _ _ _ _ _ _ _ _ _ _ _ _ _
🌍Thank you for seeing idea .
Have a nice day and Good luck.
J-ADA

🔥 ADA Bullish Parallel Channel ContinuedADA has been trading inside a bullish channel since the start of 2023.
It appears that the most recent sell-off has concluded and found support on the bottom line of the parallel channel.
Near-term targets in blue. If you prefer a high R/R trade you can wait until the price reaches the top resistance of the channel.

Bitcoin, another bull run soon?!Hello trader Today I have prepared a new idea for you. Like and subscribe to the channel there is a lot of useful information✅
Bitcoin technical failed to overcome the local resistance of $27,550 and again got a rebound below $27,000
At the moment, the price of bitcoin has rebounded from the local trend line of $26,550 and it seems there is again a chance to try to break through the strong local resistance of $27,300-27,550 and keep the chances to go above $30,000
As long as the buyer leaves the price in the gray area on the chart, the chances of a bull run still remain, the main thing is to wait for the right moment and stick to risk management.
I got Long from $27,500 with 1000 pips down, my TBX is $26280 and I keep holding Long!

🔥TAKE A NICE LOCAL TRADE ON BITCOIN: $31-33K AREA IS A TARGET🔥Hi, friends! Bitcoin is in consolidation for more than 2 months. The price reached the first imbalance and we got the reaction, but I think the price can go lower to accumulate more power before the growth. The whales need more liquidity.
📊 TRADING PLAN FOR BTC:
🔥 pullback to the local low
🔥 volume growth
🔥 bullish BTC
🚩 We need to be careful close to the local lows at $25,800 because the price can update the lows. We need to check DOM and Footrpint to see where will be the support and price reversal.
✅ THE MAIN LONG TARGETS FOR BTC:
1. $31,000 - we need to watch carefully to this area because it's a local high where a lot of buyers will close their longs
2. $32,000 - the most possible targets
💻Friends, press the "boost"🚀 button, write comments, and share with your friends - it will be the best THANK YOU.
P.S. Personally, I open an entry if the price shows it according to my strategy.
Always do your analysis before making a trade.

🔥RIPPLE vs SEC: 2 POSSIBLE SCENARIOS FOR XRP WITH TARGETS🔥Hi, friends! Ripple is one of the few cryptocurrencies that truly holds value and has its own product. The ECB is launching its own digital currency (CBDC), in which Ripple has played a significant role.
🚩There has been a lot of news regarding this company's involvement in developing country currency analogs using blockchain solutions XRP.
📊What could influence the price of Ripple? In May, the Ripple case is expected to conclude. I see two scenarios:
✅1. Negative: the company is found guilty of selling unregistered securities. In this case, the price may fall to the nearest major support zone, specifically $0.37-0.41.
✅2. Positive: the company is acquitted, and the XRP token is deemed a commodity. The price skyrockets, with all growth targets outlined below.
✅ THE MAIN LONG TARGETS FOR XRP:
1. $0.66 - the key level, local high
2. $0.8 - the key level
3. $ 1 - the even number and huge resistance for the price
💻Friends, press the "boost"🚀 button, write comments, and share with your friends - it will be the best THANK YOU.
P.S. Personally, I open an entry if the price shows it according to my strategy.
Always do your analysis before making a trade.

🔥DOT IS AT STRONG SUPPORT: 2 TARGETS AFTER THE KEY LEVEL TEST🔥Hi, friends! DOT reach the strong support level and already make a false breakout which shows the price strength.
📊 TRADING PLAN FOR DOT:
1. the false breakout of the key level(already happened)
2. volume growth at the bottom
3. bullish BTC is a must-have for altcoins growth
✅ THE MAIN TARGETS FOR DOT:
🔥 $6.2-6.4 - the value area and strong resistance
🔥 $7 - the key level
💻Friends, press the "boost"🚀 button, write comments, and share with your friends - it will be the best THANK YOU.
P.S. Personally, I open an entry if the price shows it according to my strategy.
Always do your analysis before making a trade.


ADAUSDT , changing the channel and key zones to watch📈 updateHello guys, Everything is explained on the chart for you like always. In pervious analysis we said that the price has broken the descending channel although is still below the base band resistance and after that we usually expect the pullback as a retest to enter buy position at 0.34$, next point to buy will be after break the resistance base and at pullback to 0.42$. The targets will be 0.51 and 0.57$. And now price at our desire point to buy.
Good luck.
If you like the idea, do not forget to support with a like and follow me for next analysis :)
Write your comment and opinion below to me
.
Salam doostan aziz, hame chiz rooye chart moshakhas shode. dar tahlile ghabl goftim ke gheymat kanale nozooli khod ro shekaste ast agarche hanuz zire moghavemate base band hast va ma entezare pullback be line baraye kharid ro darim dar 0.34$ va noghte kharide baadi ham baad az shekaste base band va pullback be 0.42$ hast. ahdaf ham 0.51va 0.57$ hastand. va alan gheyat dar noghte morede nazar ma hast baraye kharid.
lotfan modiriyat sarmaye va hade zarar baraye har etefagh dar bazar ro ra'ayat konid.
moafagh bashid.
like va follow faramoosh nashe :)

TONCOIN - buy on spot at $1.86 sell at $5+Hello trader Today I have prepared a new idea for you. Like and subscribe to the channel there is a lot of useful information✅
I took this monster into my portfolio for 5% of the deposit.
Technical: the project has been in an uptrend for almost a year, and after the breakdown of the global trend line, we lost this value, I hope that not for long and soon TON will go to test its past highs ($3+)
At the moment, the coin is testing a strong support at 0.618 from where I am going to take 5% of the deposit, followed by an addition lower by another 5% if the correction continues to the 0.5 level.
All margin and spot positions:
▪️BTC LONG - TVX $26,280 20% of deposit
▪️ETC SPOT - TVX $18.85 15% of the deposit.
▪️TWT SPOT - TVX 1.1777$ 2% of the deposit.
▪️AAVE SPOT - TVX 68.5$ 5% of the deposit
▪️LEVER SPOT - TVX 0.0016$ 4% of the deposit.
▪️DOGE SPOT - TVX $0.08970 4% of the deposit.
▪️TON SPOT - TVX 1.860 $ 5% of the deposit.

BTC is close to bi volume area in a case of Break down - goal..BTC is close to bi volume area in a case of Break down - the goal will be $26k - 27k area

🔥CARDANO (ADA): SHOW YOU THE BEST ENTRY POINT TO LONG🔥Hi, friends! Cardano falls to the $0.38-0.39 value area and the price still holds inside it. If the price fall below this value area and returns inside, it will be a strong bullish signal.
📊 TRADING PLAN FOR ADA:
🔥 liquidity collection below the $0.38-0.39 value area
🔥 false breakout
🔥 volume growth
🔥 bullish BTC is a must-have for altcoin's growth
✅ MY TARGETS FOR ADA:
1. $0.42 - the key level
2. $0.46 - the key level and local high
3. $0.5 - the trendline 4th point
💻Friends, press the "boost"🚀 button, write comments, and share with your friends - it will be the best THANK YOU.
P.S. Personally, I open an entry if the price shows it according to my strategy.
Always do your analysis before making a trade.

🔥ETHEREUM FINALLY STARTS TO GROW: WHAT DO I EXPECT? WHEN $2500?🔥Hi, friends! Bitcoin is up 50% lately, and Etherem is up 38%. Finally, Etherem began to close this gap in pair with Bitcoin, which means the flow of liquidity into Altcoins.
Now ETH has the good mid-term preconditions to grow: higher lows with a huge volume at the bottom which confirms the presence of the buyers.
📊 THE 2 TRADING PLANS FOR ETH:
1. false breakout of the $2030 key level and pullback to $1600-1700 order flow
2. pullback from the current price straight to $1600-1700 order flow
I expect growth after the pullback to the order flow in both cases.
✅ THE MAIN TARGETS FOR ETH:
1. $2030 - the local highs
2. $2500 - the even number and important level
💻Friends, press the "boost"🚀 button, write comments, and share with your friends - it will be the best THANK YOU.
P.S. Personally, I open an entry if the price shows it according to my strategy.
Always do your analysis before making a trade.

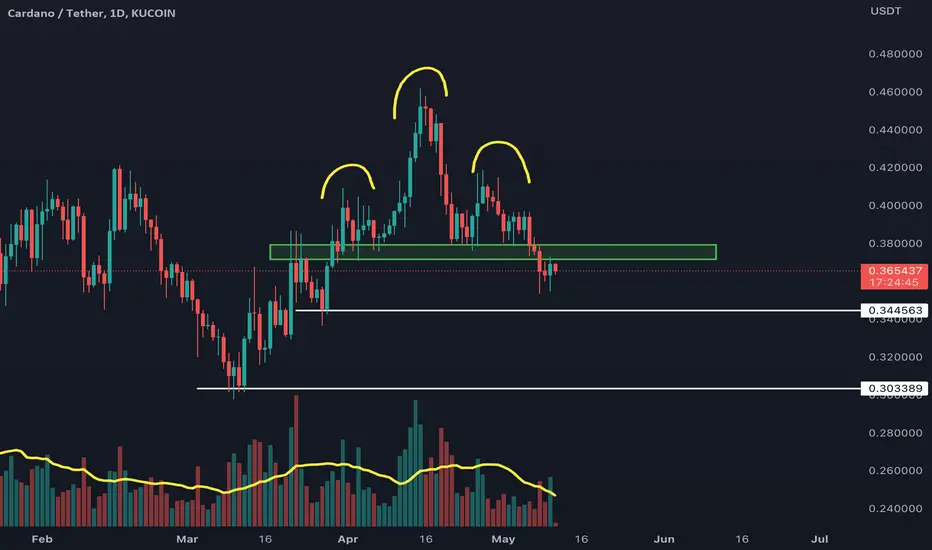
ADA (Cardano) lets take some profit on short for now.#ADA /USD TA Update:
CRYPTOCAP:ADA currently trading at $0.3594
According to Coinlion Trend Trader Indicator, we got en Exit Point Alert for ADA at $0.4 (04/21)
Coinlion Trend Trader Indicator entered short at 0.3864 the 4th of may.
Then takes 2 times Profit :
1) $0.365 (20% exit position)
2) $0.362 (10% exit position)
(6,5% Profit).
There is a strong resistance at the 200EMA. The same which has rejected ADA many times before
But we have broken the descending channel.
Now we have a support on the 200SMA at $0.352 and a liquidity zone support between $0.2986 and $0.30
Cardano can test again the channel which should be a support now aligned with the 200SMA and 50SMA around 0.357
+ we can see that ADA is oversold. The trend might change soon as whales are accumulating a lot ADA.
Lets see what happens and follow the indicator instead of our emotions.
What do you think ?
Please click LIKE button and Appreciate my work.
Coinlion Trend Trader indicator tells me
- When to enter short or long
- When to exit and take profit :-)
- Now CTT comes with the new RSI and Stochastic indicator
IF YOU WANT we can give you the link to our free indicators :
- Stop Loss indicator
- Liquidity Support and Resistance Indicator
- Buy and Sell signal
- Automatic Fibonacci Levels with Higher and Lower Lows
Thank you.

ADAUSDT's situation+next targets and expected movements.🤑The ADAUSDT is in a Bullish phase by reaching a PRZ zone & is in a Falling Wedge Pattern.
🌟 Bullish signals in the PRZ area are:
- Support zone
- Pivot S1 weekly
- The Bottom of the Wedge area
- Falling Wedge Pattern
❗and the Upward signals of market momentum are:
- Divergence in MACD
⭐ Note if the PRZ is broken downwards with the strength of Bearish candles or Wedge broken from the bottom , this analysis of ours will be failed.
✅If this post was useful for you, like it ❤️ and if you think it is useful for your friends, be sure to send it to them.
_ _ _ _ _ _ _ _ _ _ _ _ _ _ _ _ _ _ _ _ _ _ _ _ _ _ _ _ _ _ _ _ _
🌍Thank you for seeing idea .
Have a nice day and Good luck.

CARDANO (ADA) SHORT | BEARISH BREAKDOWN Cardano cryptocurrency or ADA Coin had formed and broken down the Head and Shoulder Pattern on Daily TimeFrame.
The pattern is a bearish pattern and hence I believe price will drop.
Targets
1- 0.35
2- 0.30-0.31
Let me know in the comments section if you want me to analyse any other financial instrument.
WARNING:-
ALWAYS FOLLOW RISK MANAGEMENT AND POSITION SIZING WHILE TAKING ANY TRADE.
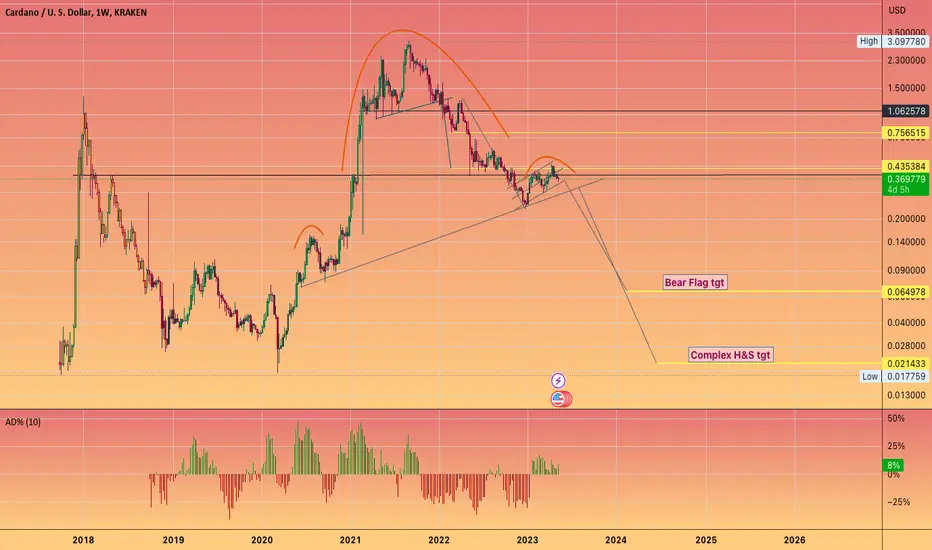
#ADA doomsday scenario cast!Inherent in the risk of buying your favourite #crypto
is to watch fade into non- relevance
coupled with a non event #BITCOIN halvening which will happen one day!
Just throwing out a what if scenario for #cardano
those levels yielded a wonderful opportunity twice before,
could it be a third time?
ADA Cardano - The Whales WhispererCardano (ADA) Whales on Radical Move as Network Activity Heats Up: Details
The chart:
ADABTC on valid support and structure looking to be gaining momentum.
Slightly Descending channel on support (the dark blue channel on the chart), backed by reliable support (green trend line) and we want to be early on this trade.
Targets:
- The mid of channel is more than 83% likely to be met and it does confluence with the 0.382 level at roughly 52% higher (ADABTC value).
- The upper level of the channel just over 0.618 offers a 101-124% rise on ADABTC and i see this over 53% likely to be happening this summer.
- Finally the most optimistic target is still 42% likely and it lies on the white trend-line..follow the 'bubbles' they are ascending in a perfectly linear manner as Support and Resistance. If this line is met we would be selling.
Let me know if you like this chart and thumbs up to OKX for an amazing idea to host the OKXIDEAS Contest.

LTC & ADA Will Crash 90% – Bear Market Has Not Even Begun Yet!The bear market has not even begun yet for 99% of altcoins, such as Litecoin (LTC) and Cardano (ADA).
I expect these coins to crash at least another 90% from where they currently are.
I agree with people such as Big Cheds, Bob Loukas, Benjamin Cowen, and others that altcoins are far from having bottomed and in fact that the bear market has not even begun yet.
Anyone using leverage of 1.01x or higher and who is long will surely get liquidated within the next 1-3 months.
Bitcoin will crash to sub $10k as well.

ADA Falling Edge vs BTCSeems to me ADA is making a massive falling edge against BTC which is a bullish pattern.
The worst might be over for ADA, so i converted euros to cardano today.
Surely some bumps ahead but nothing serious imho.
After selling ADA at 2,2 dollars two years ago, and calling the peak (check my TA in 17th May 2021), I return to my beloved ADA.
Good luck.

Cardano ADA price has a ray of hope for continued growth The last time we came up with an idea for ADAUSDT was 5 months ago, and it's been working out great. The value of the Cardano token has doubled during this time.
The positive thing is that the ADA price has broken out of the falling trend channel.
However, there was one "But" during this time - buyers were unable to break through and gain a foothold above the powerful liquid level of $ 0.43
On yesterday's market decline, buyers of ADAUSD managed to keep the price in an uptrend, above the local purple trend line. That is, buyers don't want to give up easily, which is good and gives a ray of hope.
Given that, in the coming days, BTC sellers may try to drop the price below $ 26600-27000 to break the stops of long positions that are hiding there. The ADAUSDT price may also squeeze down, but it shouldn't be able to stay below $ 0.327-0.34. Fixing the price below this level could trigger an extension of the price drop to $ 0.27 and below.
A positive scenario is difficult in the current realities but possible.
It is necessary to break through to $ 0.55, then consolidate above $ 0.43, and only then will the path to $ 0.80 open up, and maybe even to the first "non-burning price" $ 1 (not million)))
_____________________
Did you like our analysis? Leave a comment, like, and follow to get more

🚀 MANA TRIANGLE BREAKOUT INCOMING? KEY LEVEL AT $0.48! 📈 🔥Hi, friends! Mana is consolidating inside a huge triangle since mid-January. I think it's time for this altcoin to show all its strength.
The most important key level is at $0.48. The false breakout of it will be a huge trigger for MANA growth.
📊 TRADING PLAN FOR MANA:
1. false breakout of the key level $0.48
2. volume growth
3. bullish BTC is a must-have for altcoins growth
✅ MY TARGETS FOR MANA:
🔥 $0.58-0.62 - the value area
🔥 $0.7 - the key level
🔥 $0.85 - the local high
💻Friends, press the "boost"🚀 button, write comments, and share with your friends - it will be the best THANK YOU.
P.S. Personally, I open an entry if the price shows it according to my strategy.
Always do your analysis before making a trade.

ADA USDT LONG SWING | ADAUSDT | LONG @ 0.36 - 0.38 | TP @ 0.39, 0.4, 0.41, 0.42, 0.43 | SL @ 0.33 | PATTERN = BULLISH MACD CROSSOVER | BINANCE |
Swing trade idea. Kindly follow targets and stop loss. Will update with new targets once all 5 are achieved. Mostly trading with PNF charts, MACD, RSI, Stoch, BPI, Cipher, MA/EMA, Support/Resistance on hourly timeframes and higher time frames
BINANCE:ADAUSDT BYBIT:ADAUSDT.P BINANCE:ADAPERP COINBASE:ADAUSD BINANCE:ADAUSD BINANCE:ADAUSDTPERP

BTC, ETH ADA, XTZ and NEO price forecasting and possible entriesWe are approcaching the time to get some entries preparing for crypto bull run as we are approaching Bitcoin halving that normally moves the market a lot. This is just my analysis and not a financial advice
