🔥FTM GROWTH WILL IMPRESS YOU: THE 3 TARGETS FOR THIS ALTCOIN🔥Hi, friends! Fantom has been quite the rollercoaster ride in the world of altcoins, with its volatility making it a topic of much discussion among crypto enthusiasts.
Recently, there has been a trendline breakout that has many traders wondering what the future holds for this digital asset. While some believe that this break may be temporary, others predict that it will return to the value area once more. One thing is for sure, the $0.53 key level will be a major hurdle for Fantom to overcome as it tries to make its way back to the top.
📊 TRADING PLAN FOR FTM:
1. return to IMPORTANT $0.44-047 value area after the local growth
2. volume growth as it usually happens at the bottom
3. bullish BTC is a must-have for the growth of 99% of altcoins
✅ THE MAIN TARGETS FOR FTM:
1. $0.53 - the key level and local high
2. $0.66 - the key level and local high
3. $0.75 - even number and key level
💻Friends, press the "boost"🚀 button, write comments, and share with your friends - it will be the best THANK YOU.
P.S. Personally, I open an entry if the price shows it according to my strategy.
Always do your analysis before making a trade.
J-ADA

🔥POLKADOT IS GOING TO PUMP AFTER THE PULLBACK! $10 IS A TARGET.🔥Hi, friends! Polkadot is squeezing to the trendline and trying to break it down. I think that one more pullback from the trendline is highly possible and the breakdown will happen soon.
Bitcoin feels so weak and a fall to $ 25-27k is almost inevitable, so the 99% altcoins will follow BTC too, including DOT.
📊 TRADING PLAN FOR DOT:
1. squeeze and breakout of the trendline down
2. test the $5.75 key level as the support
3. volume growth
4. bullish BTC
✅ THE MAIN TARGETS FOR DOT:
🔥 $6.7 - the local highs
🔥$ 7.9 - the key level and local highs
🔥$ 10 - the key level and even number
💻Friends, press the "boost"🚀 button, write comments and share with your friends - it will be the best THANK YOU.
P.S. Personally, I open an entry if the price shows it according to my strategy.
Always do your analysis before making a trade.

🔥 ADA Inverse Head & Shoulders: Retest Into Bullish Move?Over the last half year or so, ADA has been following an inverse head & shoulders pattern. Classically, inverse H&S patterns occur at the end of bearish trends.
As of a couple days ago, ADA has broken out of said H&S pattern. However, with BTC trading bearish today, ADA has gone for a retest of the neckline.
Theoretically, we can reverse from here and burst upwards. However, without BTC going up ADA will go nowhere.
If BTC flips bullish/neutral, ADA might see a big bounce from today onwards, else we're just going down like the rest of the markets. A daily candle close below the neckline would be an invalidation of this pattern.
In case we reverse, targets in blue.

ETH close to our target. At re-test take a new short entry ETH is close to our target. At re-test take a new short entry
watch video

ADA's situation+next targets and expected movements.ADA has created an Inverse head and shoulder pattern which means a great bullish trend is on the Horizon. If the price follows this pattern's expected movement,we shall see it reach 0.7 pretty soon or at least in mid term duration. The expected movement is as much as the measured price movement ( AB=CD ).The break out has occurred . We might even see a correction one more time before ascending further. keep in mind that the next big resistance for ADA will be around 0.7.
_ _ _ _ _ _ _ _ _ _ _ _ _ _ _ _ _ _ _ _ _ _ _ _ _ _ _ _ _ _ _ _ _
🌍Thank you for seeing idea .
Have a nice day and Good luck.

ADAUSDT 1HADAUSDT 1H
Cardano has broken upwards of the bearish channel and continues its journey towards the target of 0.4611 (expected for April 25th). MACD is too bullish and the RSI is overbought.
• There is speculation surrounding Cardano's Milkomeda, an EVM layer upgrade that will give Cardano users access to EVM smart contracts via their Cardano wallets, which I believe will continue the bullish pattern imposed in recent hours.
Here are the supports and resistances:
Supports 0.4370 / 0.4296
Resistances: 0.4462 / 0.4505
RSI : Seller
MACD: Buyer
MM200: 0.4267
EMAS : Neutral, which may indicate an accumulation period

Cardano is Eth 2.0Most folks are sleeping on Cardano still and thats a darn shame! Chucky is going to stay true to his word and build a monumental platform for the space! Eth 2.0

✴️ Cardano | RSI Long-Term Signal ExplainedI am going with Cardano again because I have a very interesting signal to show you.
This signal is based on the Relative Strength Index (RSI) and goes as follows... Let's start with the chart.
So much to look at in a single chart.
✔️ 1) We have a long-term higher low; Dec. 2022 vs Dec. 2018.
✔️ 2) The cup (yellow) pattern indicates a bottom formation. By bottom we mean that it can't go any lower.
✔️ 3) The middle line in blue is 50. RSI above 50 weekly is super-strong, the bullish zone. Currently the RSI sits at 57.81.
✔️ 4) Straight up. The RSI line is literally a straight up line, pointing up with growing momentum.
✔️ 5) There is plenty of room left for additional growth.
You can read yesterday's trade idea for the short-term.
We have a 200 day high, the higher low, volume, etc.
✴️ Cardano New 200 Days High
Thank you for reading.
Remember to boost, comment and follow.
Your support is truly welcome and appreciated.
Namaste.

Ichimoku Analysis for ADAIf you are long than hope for this bullish kumo crossover to help you get around 15% profit.
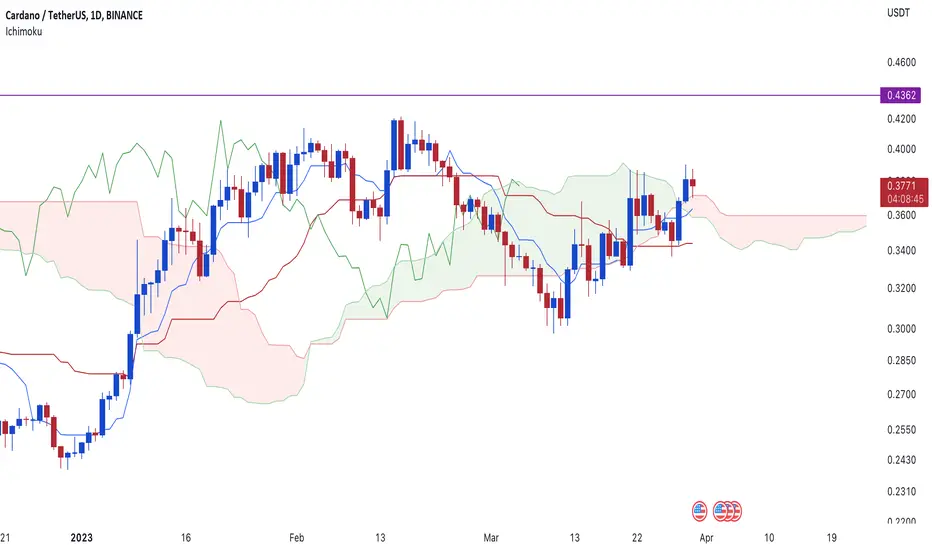
✴️ Cardano New 200 Days HighYesterday ADAUSDT hit its highest price in 200 days as it launched a new open source tool to develop smart contracts on Cardano, Aiken.
The chart continues to look pretty good...
What one does, the rest follows!
Cardano hit bottom late Dec. 2022 and started the year with a bang, same as the rest of the Altcoins market.
After peaking in February a strong correction took place which is normal after a period of sustained growth.
This correction ended mid March, the 10th of March to be exact, in a higher low.
Now we are witnessing the resumption of the bullish trend.
This is something we have been tracking/expecting and it is likely that additional growth will follow in the coming days.
Namaste.


✳️ Double Bullish Divergence & Volume Confirms Reversal | ADABTCCardano bottomed 20-March vs Bitcoin and this can be confirmed through multiple chart signals.
Feel free to boost and let's dive in.
First, we have a double bullish divergence, classic, plain and simple.
We can see Cardano (ADABTC) printing a long-term lower low between March 2023 and May 2022.
The MACD on the other hand printed a long-term higher low in this same time window:
The RSI's bullish divergence is younger but still valid and strong, March 2023 vs Dec. 2022:
The signal is still valid and good.
Next, for a low/support confirmation is the volume signal.
We have high volume May 2022, just check the volume line/bar on this date on the chart.
March 2023 as a new 10 months low is hit, no volume/low volume.
A new low with no volume signals that this move is either weak, already over or just the market looking for liquidity rather than a trend continuation move.
With all this said, there can still be more correction but this is a low probability scenario.
A new low can be hit with the same conditions described now because it is still early on the bounce and no volume on the way up.
Now, looking at the other Altcoins, such as XRPBTC and SXPBTC, we see the reversal is already taking place.
Thank you for your continued support.
Namaste.

🔥 Cardano Bullish Channel: Slowly Grinding Up!ADA has been trading inside this bullish channel for nearly three weeks now. I'm anticipating that it will continue to do so in the near future.
I'm looking for a move towards the bottom support area of the channel before considering an entry. Target is the top of the channel.

ADA LOOKS BULLISHHi, dear traders. how are you ? Today we have a viewpoint to BUY/LONG the ADA symbol.
For risk management, please don't forget stop loss and capital management
When we reach the first target, save some profit and then change the stop to entry
Comment if you have any questions
Thank You

ADA/USDT Technical Analysis Update: Bullish Breakout Potential &ADA/USDT Technical Analysis: Potential Bullish Breakout in Sight
Cardano (ADA) is currently trading at $0.41, showing a 39% increase from its recent bottom. In this technical analysis, we will discuss the potential for a bullish breakout in ADA/USDT and the target price if it occurs.
White Neck Line Resistance
Left Shoulder, Head, and Right Shoulder Formation
Potential Target Price
Stop Loss
Conclusion
Inverse Head & Shoulder White Neck Line Resistance:
The current price of ADA/USDT is testing the white neck line resistance, which, if broken, could trigger a bullish breakout. Therefore, traders and investors should keep an eye closely on the current price level and monitor the price action closely.
Left Shoulder, Head, and Right Shoulder Formation:
The left shoulder, head, and right shoulder formation is a well-known technical pattern used by traders to identify potential trend reversals. In the case of ADA/USDT, the pattern has already formed perfectly, with the current price level testing the white neck line resistance.
Potential Target Price:
If the breakout occurs, the potential target price for ADA/USDT is $0.73, which is a 76% increase from the breakout level. However, it is important to note that this is not a guaranteed outcome, and the price may fluctuate depending on various factors.
Stop Loss:
To mitigate potential losses, traders should place a stop loss below the neck line support. This will limit the downside risk in case the breakout does not occur or the price reverses.
Conclusion:
In conclusion, the current price level of ADA/USDT is testing the white neck line resistance, and a bullish breakout may occur soon. However, traders and investors should do their own research and analysis before investing in any cryptocurrency. Technical analysis is just one tool that can be used to make informed investment decisions.
Hey, it's CryptoPatel here!
I'm passionate about providing you with the latest insights and analysis on the world of cryptocurrencies.
If you enjoy my content and want to show your support, please like, share, and follow me for more high-quality updates.
Thank you for your support, and let's continue to stay connected for more exciting content!
LIKE
Share
Follow

✅ADA is expected to move to 0.7$ADA has created an Inverse head and shoulder pattern which means that the price shall increase as much as the measured price movement (AB=CD).the break out is about to occur so stay tuned for a sharp bullish movement. The resistance for this movement sits around 0.7
_ _ _ _ _ _ _ _ _ _ _ _ _ _ _ _ _ _ _ _ _ _ _ _ _ _ _ _ _ _ _ _ _
🌍Thank you for seeing idea .
Have a nice day and Good luck.
