GBP/USD - Fundamental Drive Ahead! (21.10.2025)🧠 Setup Overview:
GBP/USD has broken below its rising trendline after testing the 1.3470 resistance zone multiple times. The pair is under fundamental selling pressure, fueled by risk aversion and renewed U.S. dollar strength.
Fundamental Drivers:
1️⃣ U.S. markets gained as President Trump decided not to impose very high tariffs on Chinese goods, which temporarily boosted sentiment.
2️⃣ However, investors are now digesting U.S. credit risks and US–China trade tensions, both adding safe-haven demand to the USD.
3️⃣ Meanwhile, the UK economy faces uncertainty from softer consumer spending and weak housing data — further limiting GBP’s upside potential.
📉 Technical Plan:
Bias: Bearish below 1.3400
Structure: Trendline breakdown confirmed
Cloud Resistance: Adds confluence to downside momentum
Next Levels to Watch:
🟥 1st Support: 1.3349
🟥 2nd Support: 1.3310
📊 If price closes below 1.3349 on the 30-min chart, further selling pressure may extend toward 1.3310 and possibly deeper if fundamentals align.
#GBPUSD #Forex #TechnicalAnalysis #PriceAction #Ichimoku #TrendlineBreak #FXMarket #BearishSetup #TradingView #KABHI_TA_TRADING
⚠️ Disclaimer:
This analysis is for educational purposes only — not financial advice. Always manage your risk and use proper position sizing before entering any trade.
📣 Support My Work
If you found this analysis useful — LIKE 👍, COMMENT 💬, and FOLLOW 🔔 to stay updated with daily Forex setups!
J-DXY

GBPUSD 1H Analysis: Bearish Pressure Builds After Break 📊 GBPUSD – 1 Hour Analysis (SELL)
Technical Outlook:
Bullish momentum is fading, and selling pressure is building after the recent break.
My trade plan is on the SELL side; target level: 1.33564 📉
Fundamental Analysis:
On the U.S. side, the strong dollar narrative and the Fed’s data‑driven stance continue to support USD strength.
Meanwhile, uncertainty around the U.K.’s growth/inflation balance and tighter financial conditions are weighing on GBP.
Together, these factors reinforce the downside bias in the pair.
🙏 Every like is my biggest motivation to keep sharing these analyses.

USD Index: Bearish for today?At least for today it looks like dollar index is bearish.
Waiting for #1 BOS - as initial confirmation that bearish is taking over.
#2 BOS - should provides a confirmation that bearish is on its way.

US Dollar: Looking For Higher Prices This WeekWelcome back to the Weekly Forex Forecast for the week of Oct 20-24th.
In this video, we will analyze the following FX market: USD Dollar
The USD had a bearish week overall, but Friday's bullish close may hint towards the bias for this week. Potentially, we may see some continuation to the upside over the next couple of days.
Look at how price pulled back into the Daily Demand. This is a great place for the retracement to end ... and the new bullish leg to begin.
Wait for confirmations... like the failure of the -FVG. Then buys become valid.
Enjoy!
May profits be upon you.
Leave any questions or comments in the comment section.
I appreciate any feedback from my viewers!
Disclaimer:
I do not provide personal investment advice and I am not a qualified licensed investment advisor.
All information found here, including any ideas, opinions, views, predictions, forecasts, commentaries, suggestions, expressed or implied herein, are for informational, entertainment or educational purposes only and should not be construed as personal investment advice. While the information provided is believed to be accurate, it may include errors or inaccuracies.
I will not and cannot be held liable for any actions you take as a result of anything you read here.
Conduct your own due diligence, or consult a licensed financial advisor or broker before making any and all investment decisions. Any investments, trades, speculations, or decisions made on the basis of any information found on this channel, expressed or implied herein, are committed at your own risk, financial or otherwise.

Buy Bitcoin, Not bananas Since the last emergency update from Yellen to buy Bitcoin, we're up by approximately 260%.
In this next update from the Volcanic Miner Empire(VME) located in El Salvador, we're giving an "All Good" update. Buy Bitcoin, don't buy Bitcoin, buy bananas like Mark Cuban - whatever, we literally couldn't care less, lol.
BUT,
If you're a sensible entity browsing a website for good investment ideas, this setup should intrigue you. We have spent two-thirds of the year consolidating the previous all-time high on Bitcoin.
The world is easing monetary policy, markets are at all-time highs (with trillions of treasury notes expiring, freeing up more fiat and chasing more gains), and China is about to start handing out money in 500 billion increments to do nothing but invest in anything, for free, no risk... LOL. This is just the tip of the Volcano.
Impossible to tell you when this happens, but given macro events, it seems much sooner than later if this cycle is to confirm.
Do what you want, do it safely, and laugh at Cuban every time you eat/see/think about a banana.

EURNZD – Elliott Wave Roadmap2D Chart
Every swing continues to unfold with precision - true to Elliott Wave structure. We’re now in the final stages of Wave 5.
This structure is nearing completion, with price developing the final sub-wave (C) of (5) into the Sell Zone.
📍 The Sell Zone aligns with the upper channel resistance - where we’ll be watching closely for exhaustion and the start of the next major decline.
Trade Idea:
- Watch for price to complete Wave (5) inside the Sell Zone
- Aggressive short: Rejection within the zone
- Conservative short: Entry after trendline break / BOS
🎯 Targets:
- TP1: 1.8800 (1800 pips)
- TP2: 1.7600 (3100 pips)
We’re in the final stretch of this multi-month rally. Once Wave 5 completes, expect a sharp corrective drop to follow.
Plan the trade. Wait for confirmation. Execute with precision.
Goodluck, and as always, Trade Safe!

DXY Rejection from Premium Zone | USD Weakness AheadHello Billionaires!!
The US Dollar Index (DXY) is showing signs of exhaustion after tapping into the FVG + Order Block within the premium zone.
We’ve also confirmed a Market Structure Shift (MSS) to the downside — signaling a potential short-term reversal.
📊 Analysis Breakdown:
FVG & OB confluence near 98.90 🧠
MSS indicates bearish intent ⚡
Targeting buying zone around 98.30 area 🩸
This scenario supports USD weakness, aligning with potential bullish moves in EURUSD, GBPUSD, and AUDUSD.
💡 Trade Plan:
DXY → Short bias below OB
USDJPY → Short setup favored
EURUSD, GBPUSD, AUDUSD → Look for long setups
Smart Money likely engineered liquidity above before pushing price lower to rebalance inefficiency.

Dollar Index (DXY): New Bullish Wave Confirmed?!
Here a quick follow-up for my recent idea for Dollar Index.
The price retested a recently broken major horizontal structure cluster
and even went below that with a bearish trap.
A rising trend line was respected as a strong vertical support
and we see a bullish continuation now.
I think that we can expect a rise at least to 99.3 level now.
❤️Please, support my work with like, thank you!❤️

Tuesday, Oct 21st Weekly Forecast UPDATES!Welcome to the Weekly Forecast Updates!
In this video, we will analyze the following markets: DXY, EURUSD, GBPUSD, NASDAQ, S&P500
Enjoy!
May profits be upon you.
Leave any questions or comments in the comment section.
I appreciate any feedback from my viewers!
Like and/or subscribe if you want more accurate analysis.
Thank you so much
Disclaimer:
I do not provide personal investment advice and I am not a qualified licensed investment advisor.
All information found here, including any ideas, opinions, views, predictions, forecasts, commentaries, suggestions, expressed or implied herein, are for informational, entertainment or educational purposes only and should not be construed as personal investment advice. While the information provided is believed to be accurate, it may include errors or inaccuracies.
I will not and cannot be held liable for any actions you take as a result of anything you read here.
Conduct your own due diligence, or consult a licensed financial advisor or broker before making any and all investment decisions. Any investments, trades, speculations, or decisions made on the basis of any information found on this channel, expressed or implied herein, are committed at your own risk, financial or otherwise.

XAG/USD – SELL Entry (H1- Wedge Breakout Pattern)The XAG/USD Pair, Price has been trading within a Wedge Pattern on the H1 chart, forming consistent higher highs and higher lows. Price action is now testing the upper boundary of the Pattern, signalling a possible breakout. OANDA:XAGUSD
✅Market Context:
1️⃣Strong Upward Structure Inside the Pattern.
2️⃣Buyers are showing strength near Resistance.
3️⃣Breakout above the Trendline indicates Momentum continuation toward higher zones.
✅Trade Plan:
Entry: Buy after Confirmed Breakout above the Resistance (H1 candle close above trendline or retest of the breakout).
💰Take Profit (TP): At the Key Zone – a Major Resistance area identified ahead.
🛑Stop Loss (SL): Below the Pattern Structure.
✅Psychological Discipline :
1️⃣Stick to plan – No Revenge Trades.
2️⃣Accept losing trades as Part of the Strategy.
3️⃣Risk only 1–2% of your account balance per trade.
💬 Support the community: If you found this useful, drop a 👍 like and share your thoughts in the comments!
⚠️ Disclaimer: This analysis is for educational purposes only and does not constitute financial advice. Forex trading involves high risk. Trade only with capital you can afford to lose and always do your own research.

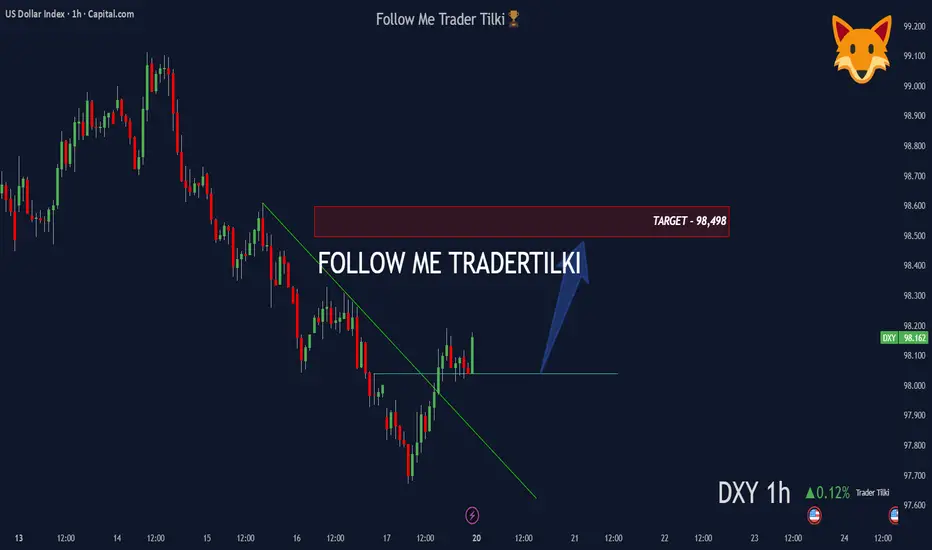
DXY 1H Analysis: Trendline Break with Rising Volume 📊 DXY – 1 Hour Analysis
Technical Outlook:
The trendline has been broken and rising volumes are drawing attention.
Based on this setup, my target level is: 98,498 🎯
Fundamental Analysis:
Recently, a White House economist stated that “we are not in any kind of economic war with China,” which reduced uncertainty in the markets and strengthened the dollar index.
In addition, FED policies, interest rate expectations, and tightening measures continue to be key factors supporting upward pricing on the DXY side.
🙏 Thanks to everyone who supports me with their likes.
USDJPY Holds Gains Above 150The USDJPY is currently trading above the mid-zone of a well-respected ascending channel that has been in place since the April 2025 lows, and below its upper boundary. Two critical confirmation levels define the near-term projection:
• Bullish Scenario:
o A sustained hold above 150 (the channel’s mid-zone) keeps the price aligned with the upper boundary near 153.30.
o A confirmed breakout above 153.30 would signal a continuation toward the 2025 highs near 157, and potentially higher — supported by a bullish rebound in the weekly RSI from oversold territory (as shown in the upcoming chart).
• Bearish Scenario:
o A close back below 150 would expose the pair to a deeper correction toward the channel’s lower boundary near 147.30, which also aligns with the 0.44 Fibonacci retracement of the rebound between April 2025 (139.88) and October 2025 (151.16).
o Should the lower boundary break, the bullish scenario would fade, with potential downside targets at 145.00 and 142.80.
- Razan Hilal, CMT

USDCAD Holds Bullish Ground Above 1.40The USDCAD pair is holding below the upper boundary of an ascending channel that extends from the June 2025 lows, while maintaining a position above key support at 1.4000 — a previous resistance level turned support.
The 1.4080 mark represents a critical resistance zone, aligning with:
• The upper channel boundary.
• The trendline connecting highs from July to August.
• The 0.44 Fibonacci retracement of the downtrend between January and July 2025.
With the bullish hold persisting amid limited economic data, the scenarios are:
o A hold above the upper boundary and 1.41 mark would confirm a bullish continuation toward 1.4180 and 1.4300.
o A failure to hold above 1.40 (the channel’s mid-zone) could extend the decline toward the lower boundary at 1.3880, offering potential support.
o A decisive break below that level would open the door to the next support near 1.3750.
Written by Razan Hilal, CMT

Stop!Loss|Market View: EURUSD🙌 Stop!Loss team welcomes you❗️
In this post, we're going to talk about the near-term outlook for the EURUSD currency pair☝️
Potential trade setup:
🔔Entry level: 1.15425
💰TP: 1.14149
⛔️SL: 1.16114
"Market View" - a brief analysis of trading instruments, covering the most important aspects of the FOREX market.
👇 In the comments 👇 you can type the trading instrument you'd like to analyze, and we'll talk about it in our next posts.
💬 Description: Bearish mood for the euro persists. A strengthening of the USD is expected in the mid- and short term. The most aggressive sell scenario is to look for an entry point at the current price level below 1.16600 (alternative scenario). A more conservative scenario (main scenario) suggests an approach to support at 1.15500 and then a breakout towards 1.14000.
Thanks for your support 🚀
Profits for all ✅
❗️ Updates on this idea can be found below 👇

King Dollar Returns: 98.190 Break💵 Dollar Breakout — Cross Assets Dumping Hard
The U.S. Dollar just flipped 98.190 CAP
After weeks of hesitation, DXY broke clean through the 98.190 daily imbalance, turning prior resistance into a launchpad — and global markets are reacting fast.
📊 Technical Frame
The daily imbalance that capped price now acts as fresh support, confirming a higher-timeframe breakout.
Momentum alignment across 4H and Daily frames signals a firm trend shift.
Upside magnet sits at 98.800–99.200, the next liquidity shelf where sellers may regroup.
🌐 Fundamental Pulse
Cross assets are dumping — EUR AND GBP all bleeding as Dollar strength tightens global liquidity.
Yields grind higher with markets reloading for extended Fed tightness.
Risk aversion and portfolio deleveraging are amplifying the move — capital is flowing back into USD safety.
🧭 Takeaway
The Dollar is back in charge. Above 98.190, the structure supports continuation toward 99+.
In this regime, correlation flips: strong Dollar = weak everything else.
When the Dollar breathes in, global markets exhale.

Technical Outlook for USD Index, EUR/USD, GBP/USDWhile my bias for the US dollar index remains bearish on the higher timeframes, a near-term bullish setup may have emerged. And that could see a pullback on EUR/USD and possible GBP/USD.
Matt Simpson, Market Analyst at City Index and Forex.com.

Gold Above 4300 – Watching for FVG Fill Before Next LegPrice consolidated all of yesterday’s Asian and London sessions before breaking bullish through NY, clearing the 4300 resistance.
Today, we’re holding above that breakout level and sitting just beneath the weekly high at 4398.
A 4H FVG rests below price around 4345–4360 — that’s my first area of interest for a retrace and possible continuation higher.
If price dips to fill that gap and shows strength, I’ll look for a long toward 4398–4420.
Otherwise, I’ll wait for a clear reclaim above the weekly high before confirming continuation.
Staying patient tonight — the easy part is waiting for the market to tell me what it wants to do.
#FuturesTrading #Gold #ICT #PriceAction #NOFOMO

USDJPY Rally Faces Pressure Near 151.250 on Safe-Haven FlowsHey Traders, in the coming week we’re monitoring USDJPY for a selling opportunity around the 151.250 zone.
The pair remains in a broader downtrend, currently in a corrective phase as it approaches this key resistance level.
Meanwhile, DXY is also correcting within its own downtrend, approaching resistance near 98.600, which reinforces the bearish bias on USD pairs.
With US–China tensions escalating, we’re seeing renewed safe-haven demand for JPY, potentially setting the stage for another leg lower in USDJPY.
Trade safe,
Joe

US DOLLAR UPDATE DXYDXY — Rangebound but Firm: 98.19 Holds the Line
Dollar holds steady inside Friday’s range — a quiet coil before the macro rotation.
🧭 Context
The Dollar spent Monday trapped between Friday’s high and low, liquidating the upper wick at 98.190 before closing back within range.
Price currently sits near the 50% Fibonacci retracement (98.123), keeping the bullish range intact but unconfirmed.
The market is balanced, not directional — patience is the edge here.
📊 Technical Map
Structure: Price remains inside a clean bullish range with a volume imbalance still unfilled near 97.436.
Momentum: Mildly bullish but range-dependent — upward bias, no breakout confirmation yet.
Key Levels:
Support → 97.672 / 97.436
Pivot → 98.123
Resistance → 98.190 / 98.420
🌐 Fundamental Pulse
This week’s key drivers: PMI flash, GDP (Thu), and PCE inflation (Fri) — all high-impact data that will steer the Fed narrative.
Yields remain firm but cooling; risk appetite mixed as traders await fresh growth signals.
Without new inflation pressure, the Dollar likely stays rotational within its higher-timeframe band until late-week catalysts.
🎯 Plan
Primary: Avoid midrange noise. Best setups are at range extremes — 97.6 support and 98.2 resistance.
Execution Filter: Wait for volume expansion or 1H close confirmation before breakout engagement.
Alternative: Failure to hold 98.12 reopens imbalance toward 97.43; a break above 98.19 invites continuation to 98.4–98.6.
⚠️ Risk / Alt
Range = noise. Stay tactical. High-frequency trades only until volatility expands.
🧠 Mindset Pulse
“In dull markets, discipline is the premium asset — not conviction.”
Professionals don’t chase noise; they preserve readiness.

Gold's Historic Rally: Where We're HeadingGold broke out of a multi-year consolidation (2020–2024) when it cleared the previous all-time high of $2,080. Once that level broke, we entered price discovery mode .
This is important: There's no overhead resistance from traders who bought at higher levels because there are no higher levels. That's bullish. But it also means we're in uncharted territory.
The weekly chart shows a clean uptrend with no signs of reversal yet. But rallies this big and fast typically need consolidation phases.
Here's where it gets specific. Gold showed a classic consolidation pattern:
- Consolidation range: $2,565–$2,750
- Breakout point: Early 2025
- Measured move target: ~$3400
Using the Fibonacci extension, if the uptrend continues, it suggests the next major resistance is around $4,500 and $4,750.
If you plot these on a chart, you see:
- Gold broke out cleanly from consolidation
- Every pullback has been bought
We're in a controlled uptrend, not parabolic. This is the structure of a trend that could continue.
But it's also the structure that could reverse if critical support breaks.

DXY AnalysisOn the weekly chart, the price has formed a new trading range. We mark it out and move down to the daily timeframe.
After the correction, the price reacted from an inefficiency zone, showing buyer interest.
At the moment, I’m considering two bullish scenarios:
1️⃣ An impulsive breakout of the daily FVG zone followed by an expansion of the current range.
2️⃣ A reaction from the FVG zone, then a sweep of Friday’s low, after which the price could resume its upward movement.
I see the second scenario as more likely, as it would allow the market to collect liquidity before continuing higher.

Bullish bounce?US Dollar Index (DXY) is falling towards the pivot and could bounce to the 1st resistance.
Pivot: 97.71
1st Support: 96.64
1st Resistance: 99.98
Disclaimer:
The above opinions given constitute general market commentary, and do not constitute the opinion or advice of IC Markets or any form of personal or investment advice.
Any opinions, news, research, analyses, prices, other information, or links to third-party sites contained on this website are provided on an "as-is" basis, are intended only to be informative, is not an advice nor a recommendation, nor research, or a record of our trading prices, or an offer of, or solicitation for a transaction in any financial instrument and thus should not be treated as such. The information provided does not involve any specific investment objectives, financial situation and needs of any specific person who may receive it. Please be aware, that past performance is not a reliable indicator of future performance and/or results. Past Performance or Forward-looking scenarios based upon the reasonable beliefs of the third-party provider are not a guarantee of future performance. Actual results may differ materially from those anticipated in forward-looking or past performance statements. IC Markets makes no representation or warranty and assumes no liability as to the accuracy or completeness of the information provided, nor any loss arising from any investment based on a recommendation, forecast or any information supplied by any third-party.

Weekly Outlook — Gold Futures (MGCZ2025)Price is sitting between key levels after last week’s explosive move.
I’m watching 4,300 as immediate resistance — if bulls can’t hold above this level, I expect a sweep toward 4,200–4,150 (H4 + Daily FVGs) before continuation.
Monday might just be a setup day, building liquidity for a Tuesday/Wednesday move.
Key Levels:
🟦 4,392 – Previous Weekly High
🟨 4,300 – Near-term resistance
🟧 4,200 – Daily Low / Support zone
🟩 4,150 – H4 FVG top
Let’s see how Monday sets the tone for the week.
#Gold #Futures #TradingPlan #ICT #PriceAction
