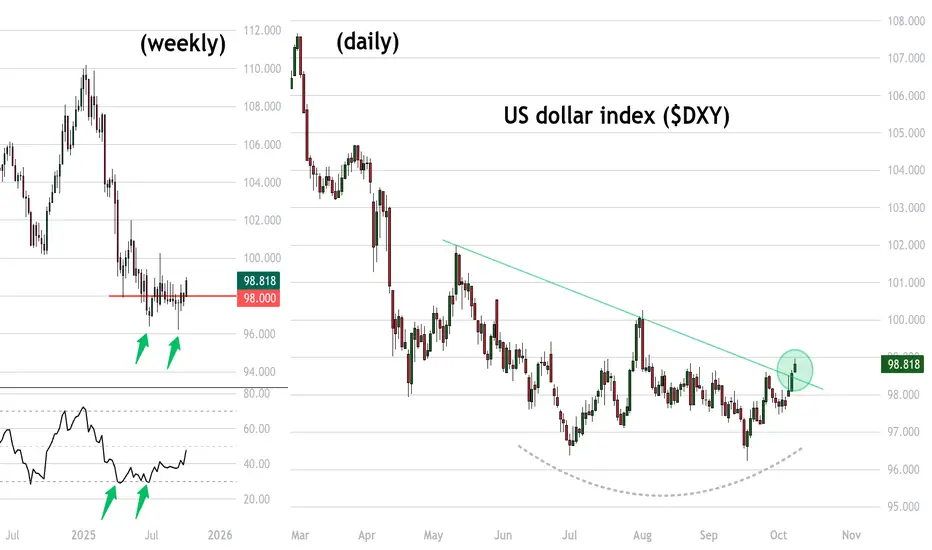
Yes Gold just broke $4K.. but check out the USD (bottom?)Gold is naturally getting all the attention after breaking over $4000 fir the first time
But meanwhile the US dollar looks like its bottoming out.
DXY - the dollar index - not had much interest in breaking below 98
J-DXY
US DOLLAR TARGETS HITThe U.S. government is still shut down, so no fresh economic data is coming out. That means everyone’s trading half-blind right now—no jobs numbers, no inflation updates, just noise. But the chart still tells the truth. All the bullish dollar targets were hit exactly as planned, and now price is sitting right under that 99.8 key high. That’s the line that decides everything. If market makers push price higher than 99.8, the bullish phase stays alive a bit longer. If it fails there, we drop back into bearish discount territory, where value sits lower and sellers regain control.
Over the past four months, liquidity’s been building above those highs. Now we’re watching a classic stop run—price pushing up to take out weak hands before the real move begins. That’s why cross markets like stocks, gold, and crypto are slipping. The dollar’s acting as a safe spot while everything else bleeds. But the volume looks thin, which usually means manipulation, not genuine demand.
Without the usual USD data, it’s all a guessing game until the Fed minutes drop later today. For now, it’s simple: the 99.8 zone is the make-or-break level. Stay patient, read the structure, and let the chart talk. Price always moves to where orders are missing, and stops where they’re full. Follow that rule, and you’ll never feel lost in the noise.

eurcad getting ready for 250 pips bearish wave got rejected from long ascending channel range, formed rising wedge in lower time frame, expecting 250 bearish rally once wedge broke towards downside, keep in mind breakout is crucial, don,t enter without breakout

Stop!Loss|Market View: SILVER🙌 Stop!Loss team welcomes you❗️
In this post, we're going to talk about the near-term outlook for SILVER ☝️
Potential trade setup:
🔔Entry level: 52.13310
💰TP: 47.21585
⛔️SL: 54.64486
"Market View" - a brief analysis of trading instruments, covering the most important aspects of the FOREX market.
👇 In the comments 👇 you can type the trading instrument you'd like to analyze, and we'll talk about it in our next posts.
💬 Description: Metals are likely to form new highs in the short term. Silver is expected to approach 50-51, with a reversal expected near this historical resistance level, but most likely not immediately. Manipulation toward 52-53 is not ruled out. The mid- and long-term priorities are currently in favor of selling. For this, a potential aggressive sell scenario is anticipated to occur near the 52-level. However, it is best to wait for a potential entry point near this price point.
Thanks for your support 🚀
Profits for all ✅
❗️ Updates on this idea can be found below 👇

Stop!Loss|Market View: GOLD🙌 Stop!Loss team welcomes you❗️
In this post, we're going to talk about the near-term outlook for GOLD ☝️
Potential trade setup:
🔔Entry level: 3955.780
💰TP: 3868.617
⛔️SL: 4015.272
"Market View" - a brief analysis of trading instruments, covering the most important aspects of the FOREX market.
👇In the comments👇 you can type the trading instrument you'd like to analyze, and we'll talk about it in our next posts.
💬 Description: Gold manipulation continues and will likely continue until the end of the US shutdown, or a potential peace settlement in the Middle East could reverse the current manipulative behavior in the metal too. Today, it is exceedingly challenging to identify potential entry points. However, in the near future, the 3955 area is interesting for potential sell trades, as it is the location of buyers' stop levels. If this occurs, it will result in a decline toward 3867. This situation would indicate a highly likely reversal of the local uptrend, which would stimulate selling in the mid-term.
Thanks for your support 🚀
Profits for all ✅
❗️ Updates on this idea can be found below 👇

Stop!Loss|Market View: NZDUSD🙌 Stop!Loss team welcomes you❗️
In this post, we're going to talk about the near-term outlook for the NZDUSD currency pair☝️
Potential trade setup:
🔔Entry level: 0.58228
💰TP: 0.57555
⛔️SL: 0.58856
"Market View" - a brief analysis of trading instruments, covering the most important aspects of the FOREX market.
👇 In the comments 👇 you can type the trading instrument you'd like to analyze, and we'll talk about it in our next posts.
💬 Description: In the medium term, the Australian and New Zealand currencies are viewed as especially pessimistic. Historically, these two major currencies have demonstrated a more effective decline, meaning a more effective strengthening of the USD. Short-term sell opportunities are near the 0.58485 area, but sell from current prices toward the local minimum of 0.57550 is also possible.
Thanks for your support 🚀
Profits for all ✅
❗️ Updates on this idea can be found below 👇

Gold Cant stop...Wont Stop....Price continues pressing into new highs with no meaningful pullback, showing strong safe-haven momentum amid rising geopolitical tension.
Watching for signs of exhaustion near current highs — ideally a liquidity sweep above the Daily High (DH) before any structural shift confirms.
No rush to fade strength. Waiting for:
A clean displacement break below intraday structure.
Retest of an unmitigated FVG or imbalance for potential short.
Until then, bullish continuation remains in control.
Bias: Neutral → Bullish (waiting for confirmation)
Setup on Watch: Liquidity Sweep + SSB (Shift in Structure Break)

Can it happen?Disclaimer
This content is for informational and educational purposes only and should not be construed as financial or investment advice. The author is not a registered financial advisor. Trading and investing in financial markets involve substantial risk of loss and is not suitable for every investor. Past performance is not indicative of future results. Always conduct your own research and consult with a qualified professional before making any investment decisions.
Gold Watching 3,850 Support as Dollar Weakens on UsGovt ShutdownHey Traders, in today’s trading session we are monitoring XAUUSD for a potential buying opportunity around the 3,850 zone. Gold is trading in an uptrend and currently in a correction phase, with price approaching this important support/resistance level.
Structure: Gold remains within an overall bullish structure and is also trading inside an ascending channel.
Key level in focus: 3,850 — a key support zone where buyers may look to step in.
Upside target: 3,930 — aligning with the channel resistance and potential area for bullish continuation.
Fundamentals: The ongoing US government shutdown is adding bearish pressure on the US Dollar. Given Gold’s negative correlation with DXY, this environment continues to support the bullish bias for Gold.
Trade safe,
Joe.

AUDUSDHello Traders! 👋
What are your thoughts on AUDUSD?
The pair has broken its ascending trendline and completed a pullback to the broken level.
It is now trading below a key resistance zone, showing signs of bearish pressure.
After some consolidation in this area, the price is expected to continue declining toward the highlighted support levels.
As long as the pair remains below the resistance zone, the downside bias will stay in play.
Don’t forget to like and share your thoughts in the comments! ❤️

DXY Watching 98.800 Resistance as Shutdown Risks Weigh on DollarHey Traders, in today’s trading session we are monitoring DXY for a potential selling opportunity around the 98.800 zone. The Dollar Index remains in a broader downtrend and is currently in a correction phase, with price approaching a key daily resistance area.
Structure: The market has been forming lower highs, consistent with bearish momentum. The 98.800 level aligns with both structural resistance and trendline rejection zones.
Fundamentals: The ongoing US government shutdown continues to pressure sentiment around the Dollar. The longer the impasse persists, the higher the risk of fiscal strain and downside pressure on the USD.
Next move: Watching how price reacts around 98.800 — a rejection here could confirm further downside continuation in line with the prevailing trend.
Trade safe,
Joe.

Gold Futures (MGC) – No Pullback, Just Pure StrengthPrice never offered a clean pullback yesterday — just an aggressive continuation straight through prior structure. That type of behavior usually signals either institutional repricing or momentum fueled by broader uncertainty (like the ongoing U.S. government shutdown risk).
🔹 Bias: Bullish until a clear break of intraday structure
🔹 Current Levels:
‣ W-H: 3922.8
‣ M-H: 3899.5
‣ D-L: 3909.0
💡 Notes:
Price is extremely extended, but until we see evidence of rejection or a 1H BOS (break of structure), the path of least resistance remains up. I’m watching closely for a controlled pullback into demand — ideally near 3920–3900 — to join the next wave higher.
Still keeping an eye on news risk tonight; if the shutdown proceeds, volatility could spike and disrupt the structure.
#GoldFutures #MGC #FuturesTrading #SmartMoney #DayTrading #PriceAction #NOFOMO

DeCode | Crypto Macro OutlookTopic: Macro Crypto Outlook
Context: BTC.D, DXY, Equities, CRYPTOCAP:BTC , News
Article:
Macro Crypto Outlook (Weekly Summary)
Assets: BINANCE:BTCUSDT.P TVC:DXY CRYPTOCAP:BTC.D BINANCE:ETHBTC
In this Weekly Macro Crypto Outlook , we break down the current state of the market and outline our forward-looking thesis for Bitcoin, Ethereum, and Altcoins.
Volatility is high.
Some believe the cycle has topped.
Others expect one final leg before the market turns.
At DeCode, we look past the noise and focus on data, structure, and context.
Let’s decode the charts together and map out what’s ahead for the rest of 2025.
Bitcoin Outlook
Bitcoin is now attempting a breakout on the weekly chart, reclaiming the previous structural Higher High. To confirm this move, we need at least two consecutive candle closes above $119,655. Despite multiple rejections from the recent highs, the market has absorbed that bearish pressure and pushed higher; a strong signal of underlying bullish strength.
If this breakout holds, the next targets lie at the +5 and +6 VWAP standard deviations, sitting around $137,000 and $151,500, which represents a potential +10% to +20% move from current levels. On the daily chart, we’re seeing six consecutive bullish closes, but short-term momentum is starting to fade, specially with a clear 3-Drive pattern that often lead the start of a pullback from Short Sellers.
Entering at all-time highs is rarely optimal, neither profitable so pullbacks are opportunities, not threats.
Key zones to watch on a retracement are:
$118,880
$112,600
$107,450
While a deep correction is unlikely given current momentum, the deeper the pullback, the better the Risk/Reward for those waiting with patience and a plan.
BItcoin Dominance & ETHBTC
Bitcoin Dominance (BTC.D) turned bearish a few weeks ago, but we’re now seeing early signs of a potential pullback. From a weekly perspective, the trend remains to the downside as long as BTC.D stays below 62.62%. However, the recent failed auctions on both the Weekly and Daily timeframes suggest we could see a short-term bounce in dominance.
A rising BTC.D means Bitcoin takes the spotlight and altcoins suffer disproportionately. Until we see clear weakness in BTC.D, it’s wise to keep altcoin exposure controlled.
The 60.85% – 59.57% zone is the key area to watch. If BTC.D starts showing rejection or weakness there, it could open a high-conviction window to rotate into undervalued alts.
ETHBTC remains the primary signal for altcoin strength and the true beginning of altseason. In our view, it hasn’t started yet. Recently, ETHBTC broke out of a multi-year bearish trend on the weekly chart; a significant structural shift.
On the daily chart, ETHBTC is gaining strength from a key Volume Level Zone, while BTC.D creeps higher. This divergence is critical:
If ETHBTC holds while BTC.D rises, we could be setting up for a massive ETHUSDT expansion, followed by strong moves in L1s and L2s.
ETHBTC must hold above 0.03749 to maintain this momentum. As Bitcoin cools off, ETH could lead the next phase of the cycle.
TradFi Correlation
In traditional markets, the U.S. Dollar Index (DXY) is often viewed as a risk-off indicator, when the dollar strengthens, risk assets like crypto, equities, and commodities tend to suffer.
At the moment, the DXY is showing signs of strength on the weekly chart, forming a solid base after multiple rejections from its previous structural lower low. If this structure holds, we could see a move toward 100.54, a key level that aligns with a potential short-term pullback across crypto markets. A break and sustained move above that level would shift the daily DXY structure to bullish, signaling increased demand for dollar safety. Historically, this tends to put downward pressure on risk assets, as investors rotate out of speculative positions.
This price action isn’t happening in a vacuum. Here’s what’s adding fuel to the fire:
📈 U.S. Treasury Yields are rising again as markets price in “higher for longer” rates. This strengthens the dollar and drains liquidity from risk assets.
📊 CPI and employment data are keeping the Fed cautious, which delays any meaningful pivot or rate cuts, even as parts of the economy show signs of slowing.
🧠 Global liquidity conditions are tightening, especially with ongoing geopolitical tensions and lower than expected growth in major economies like China and the EU.
🏦 Institutional capital is cautious; inflows into crypto ETFs have slowed, and hedge funds are increasing USD exposure as a hedge.

Bullish bounce?The US Dollar Index (DXY) is falling towards the pivot and could bounce to the 1st resistance, which is a pullback resistance.
Pivot: 97.96
1st Support: 97.49
1st Resistance: 98.77
Disclaimer:
The above opinions given constitute general market commentary, and do not constitute the opinion or advice of IC Markets or any form of personal or investment advice.
Any opinions, news, research, analyses, prices, other information, or links to third-party sites contained on this website are provided on an "as-is" basis, are intended only to be informative, is not an advice nor a recommendation, nor research, or a record of our trading prices, or an offer of, or solicitation for a transaction in any financial instrument and thus should not be treated as such. The information provided does not involve any specific investment objectives, financial situation and needs of any specific person who may receive it. Please be aware, that past performance is not a reliable indicator of future performance and/or results. Past Performance or Forward-looking scenarios based upon the reasonable beliefs of the third-party provider are not a guarantee of future performance. Actual results may differ materially from those anticipated in forward-looking or past performance statements. IC Markets makes no representation or warranty and assumes no liability as to the accuracy or completeness of the information provided, nor any loss arising from any investment based on a recommendation, forecast or any information supplied by any third-party.

No more rate hikes from the BoJ?The USDJPY started the week with a massive gap of 191 pips.
This was following news that Sanae Takaichi was on the verge of being the first female Prime Minister of Japan.
As a keen advocate of Abenomics (the nickname for the economic policies set out for Japan in 2012 when Prime Minister Shinzo Abe came into power for a second time), it is believed that Takaichi could double down on Abenomics of the past.
A weaker yen, more government spending, and more inflation are the likely outcomes. And the immediate reaction of a gap to the upside on the USDJPY shows that the market agrees too.
Furthermore, Takaichi's advisors have already urged the BoJ to be careful with rate hikes.
However, prices are still slightly below the immediate resistance area formed by the previous swing level of 150.75 and the long-term Fibonacci retracement level of 61.8% and the price level of 151.67.
A break of the resistance area could potentially result in significant upside to the USDJPY. Maybe even retesting the January 2025 high of 159.
However, a continual move to the upside is unlikely to be achieve just based on Yen weakness. A recovery of strength in the DXY would be necessary to support the move higher.

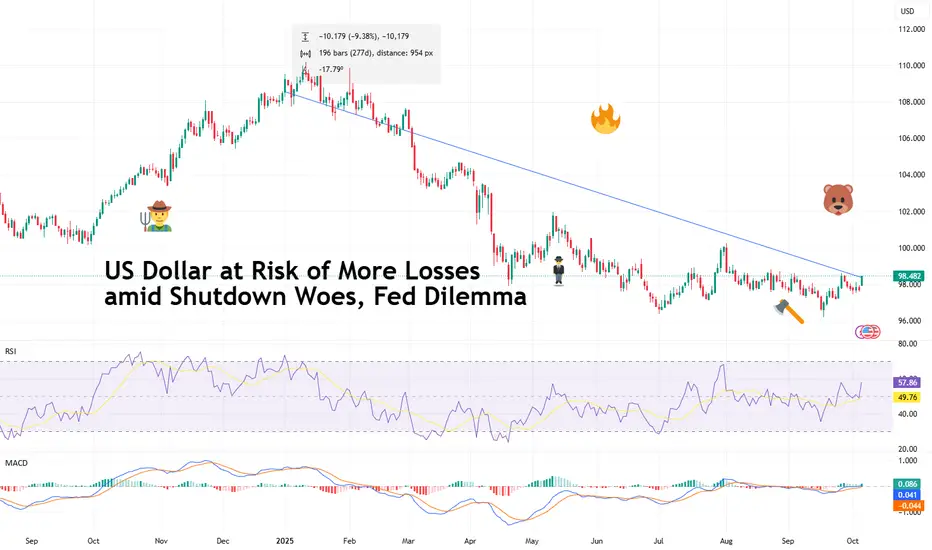
US Dollar at Risk of More Losses amid Shutdown Woes, Fed DilemmaThe US dollar TVC:DXY has been knocked by last week’s US government shutdown and the subsequent economic blackout. At the same time, the Federal Reserve can’t figure out what’s worse – inflation or job crunch.
After Congress failed to pass a funding bill, the government officially went dark at 12:01 a.m. Wednesday.
Traders, however, didn’t panic. Stocks climbed to fresh record highs , gold OANDA:XAUUSD popped, yields dipped — and the dollar slipped further into the red .
The greenback, usually the go-to safe haven during global turmoil, is acting like it forgot about that job description. With the Federal Reserve cornered between a slowing economy and stubborn inflation, plus fresh political uncertainty in D.C., the dollar’s shine is fading fast.
⚖️ When Politics and Policy Collide
Let’s start with the elephant in the room: the government shutdown. Historically, these dark D.C. moments shave about a tenth of a percentage point off GDP per week. In other words, the economy loses a few hairs — not a limb. But this one hits differently.
That’s because the Fed is already walking a tightrope. With unemployment creeping up ( 4.3% in August and lost jobs in June ) and inflation still running at 2.9% , the central bank has little margin for error.
The longer the shutdown drags on, the harder it becomes for policymakers to parse what’s real economic weakness and what’s just delayed government paychecks.
Investors, meanwhile, are pricing in a full quarter-point rate cut at the Fed’s next meeting and another one in December. The market is betting that Powell & Co. will prioritize saving jobs over fighting inflation. And that typically means one thing: a softer dollar.
📉 The Dollar’s Safe-Haven Cred Takes a Hit
Remember when the dollar used to rally whenever things got messy? Not this year. Despite trade tensions, geopolitical flare-ups, and now a full-blown government shutdown, the dollar has lost roughly 10% since January.
Part of that weakness stems from shifting interest-rate expectations. When the Fed signals it’s going to cut, yields on US assets drop — and so does the appeal of holding dollars.
Lower rates make borrowing cheaper, but they also mean less income for investors parking money in dollar-denominated bonds.
The euro took advantage, climbing above $1.17 as traders rotated out of the greenback.
Gold also basked in the dollar’s weakness, closing Friday at $3,886 an ounce — a fresh all-time closing high.
And just to rub salt in the wound, even cryptocurrencies have outperformed. Bitcoin BITSTAMP:BTCUSD , the digital rebel of finance, has gained about 35% this year and on Sunday hit a record high above $125,000 per coin.
🧩 Fed Dilemma: Jobs vs. Inflation
The Federal Reserve’s dual mandate is simple on paper: keep prices stable and employment high. But right now, the two goals are in open conflict.
On the one hand, the labor market is clearly slowing. August brought just 22,000 new jobs — the weakest print since early 2020. Revised data for June showed the economy actually lost 13,000 staffers net. Those aren’t the kinds of numbers that inspire confidence.
On the other side, inflation is still running above target. Core PCE, the Fed’s favorite measure, clocked in at 2.9% in August — unchanged from July but still nearly a full percentage point above the goal.
So what’s the play? Cut rates to support jobs and risk stoking inflation? Or hold firm, keep inflation contained, and risk a deeper slowdown? That’s the central banker’s version of “Would you rather.”
👀 The Fed’s Independence (and the Trump Factor)
There’s another layer of intrigue: politics. The Supreme Court just deferred a hearing on President Trump’s attempt to remove Fed Governor Lisa Cook — a Biden appointee — until January.
Cook can remain at the Fed in the meantime, but the episode has traders questioning just how independent the central bank really is under the new administration.
Fed Chair Jerome Powell, nearing the end of his term, has been caught between maintaining credibility and avoiding direct political confrontation. His latest move — a quarter-point rate cut in September — was meant to show responsiveness to data, not pressure. But optics matter, and the market is watching for signs of interference.
If investors start believing the Fed is bending to political will, confidence in US monetary policy could erode further — another potential strike against the dollar.
💡 What It Means for Traders
Here’s the breakdown:
• For FX traders: The dollar remains vulnerable, especially if the Fed confirms more cuts are on the way. Pairs like FX:EURUSD and FX:GBPUSD could see more upside. Meanwhile, FX:USDJPY might stay volatile as yen buyers return to their comfort zone.
• For gold bulls: Lower yields and a weaker dollar create the perfect storm. Gold looks strong despite charting new horizons, though traders should watch for a potential pullback if the Fed’s tone shifts.
• For equity investors: Rate cuts are generally bullish. Cheaper money means higher valuations — at least until inflation becomes a problem again.
• For crypto enthusiasts: A dovish Fed tends to favor risk assets, and Bitcoin could benefit as a hedge against both inflation and institutional confusion.
🧮 The Shutdown Math: Small Impact, Big Symbolism
Economists will tell you that a shutdown doesn’t tank the economy — but it does rattle sentiment. Each week of a federal closure trims GDP growth by about 0.1 percentage point. If this one matches the 35-day record from 2018–19 (during Trump’s first term), we’re looking at a 0.5% haircut. Manageable, but not ideal when the economy’s already wobbling.
More concerning is what a prolonged shutdown means for data flow. If key reports like nonfarm payrolls ECONOMICS:USNFP or CPI ECONOMICS:USCPI get delayed, the Fed will be in the dark heading into its next meeting — and that’s when mistakes happen.
Markets hate uncertainty, and uncertainty is the shutdown’s main export.
🧭 The Road Ahead
The dollar’s trajectory from here depends on whether the Fed can strike the right balance. If Powell emphasizes employment and doubles down on cuts, you may expect the greenback to weaken further. But if inflation surprises to the upside, markets could quickly reverse their dovish bets.
Make sure to keep an eye on the Economic calendar . September’s inflation hits October 15 and the Fed’s meeting is on deck for October 28-29.
Off to you : Where do you see the dollar by year end? Share your thoughts in the comment section!
Strategic Buy Zones on My USDJPY 4H Analysis | Trader Tilki📊 USDJPY 4H Analysis: Buy Setup
Hello Guys,
Here’s my 4-hour USDJPY analysis for you.
These are the exact buy levels I’ll be watching:
🔵 1st BUY level: 147.018
🔵 2nd BUY level: 146.347
🔴 Stop level: 145.509 (or adjust based on your own margin)
🟢 Target level: 150.019
Risk-to-reward ratio on this setup: 2.02
If USDJPY reaches these levels, I’ll definitely take a buy position.
Every like is my biggest motivation to keep sharing these analyses.
Thanks to everyone supporting me!

Bearish continuation setup?The US Dollar Index (DXY) is rising towards the pivot, which is a pullback resistance that lines up with the 61.8% Fibonacci retracement and could reverse to the 1st support.
Pivot: 98.64
1st Support: 96.64
1st Resistance: 100.20
Disclaimer:
The above opinions given constitute general market commentary, and do not constitute the opinion or advice of IC Markets or any form of personal or investment advice.
Any opinions, news, research, analyses, prices, other information, or links to third-party sites contained on this website are provided on an "as-is" basis, are intended only to be informative, is not an advice nor a recommendation, nor research, or a record of our trading prices, or an offer of, or solicitation for a transaction in any financial instrument and thus should not be treated as such. The information provided does not involve any specific investment objectives, financial situation and needs of any specific person who may receive it. Please be aware, that past performance is not a reliable indicator of future performance and/or results. Past Performance or Forward-looking scenarios based upon the reasonable beliefs of the third-party provider are not a guarantee of future performance. Actual results may differ materially from those anticipated in forward-looking or past performance statements. IC Markets makes no representation or warranty and assumes no liability as to the accuracy or completeness of the information provided, nor any loss arising from any investment based on a recommendation, forecast or any information supplied by any third-party.

Gold Futures (MGC) – Pushing Into New HighsPrice continues to climb into all-new highs with very little pullback, showing clear bullish momentum. However, structure is getting thin, and momentum could begin to exhaust soon.
🔹 Current Bias: Bullish — until 4H structure breaks.
🔹 Key Levels:
‣ W-H: 3928
‣ D-H: 3916
‣ D-L: 3861
‣ Daily FVG: 3820–3720
💡 Notes:
Price has yet to rebalance the large Daily FVG below. If we sweep external liquidity above 3928–3935 and fail to close strong, that could set up a pullback or even a deeper correction into the Daily FVG zone.
Volume profile shows thin structure between 3860–3820 — if momentum fades, that area could act as a magnet for price.
For now, the bullish pressure remains intact — but I’m watching closely for exhaustion signs or a liquidity grab setup at the highs.
#GoldFutures #MGC #FuturesTrading #ICT #PriceAction #SmartMoney #DayTrading #NOFOMO

US10Y & DXY downward trend continues. US10Y 4% triggers DXY 96.TVC:US10Y has been in a downward trend despite of US Fed holding the rates stable. In this blog space I have been following the downward sloping channel since Jan 2025. Since our May 2 prediction of a 4% in %US10Y we are very much on that glide path to lower low.
TVC:US10Y making new lows. 4% upcoming. 3.5% target low. for TVC:US10Y by RabishankarBiswal — TradingView
And then we add TVC:DXY into the mix which is also making lower lows and lower highs. I had a near term target of 96 on TVC:DXY and 90 by year end. This seems unreasonable now. I must change my outlook, when the charts change.
As we see, whenever TVC:DXY touches the lower bound of the downward slopping channel it tends to rebound to the mid-point of the channel. If it does so, then we might see a 100 on TVC:DXY Before we plunge down to 96 or lower.
Hence, I revise my prediction to be bullish on TVC:DXY , but that will have no impact on TVC:US10Y which is headed lower due to Fed cutting cycle and probably higher TVC:DXY dampening inflation.
Verdict: Revise our prediction: Short term bullish on OPOFINANCE:DXY. Long term bearish. Key levels: TVC:DXY to 100 first then 96. US10Y remains bearish with 4% by Dec 2025.

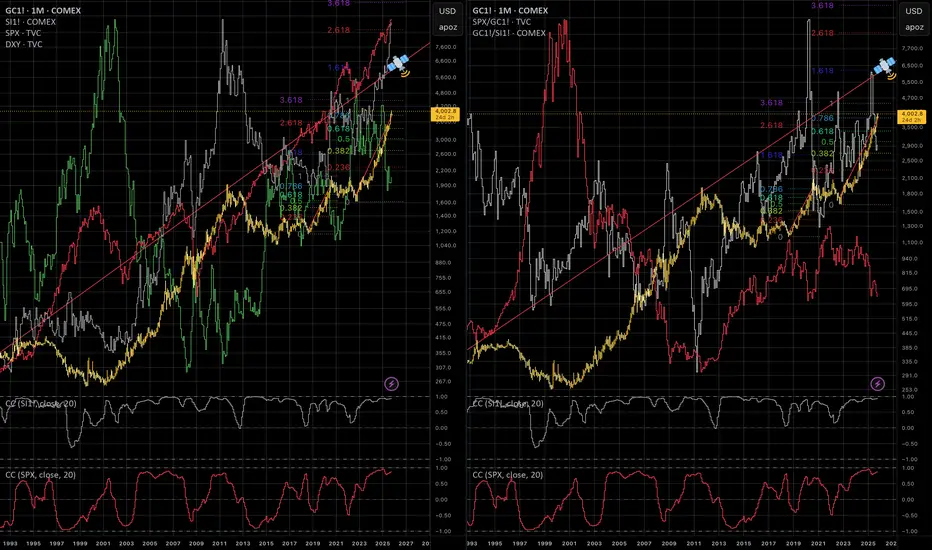
Gold | Oil | Dollar | Silver | Natural Gas Price ForecastGold | Oil | Dollar | Silver | Natural Gas Price Forecast
COMEX:GC1! COMEX:SI1! AMEX:BOIL AMEX:KOLD

DXYDXY is going sideways, we meed more sideways movement this week before going up.
Disclosure: We are part of Trade Nation's Influencer program and receive a monthly fee for using their TradingView charts in our analysis.

DXY nfp again breaking the support?Hello traders, this is a complete multiple timeframe analysis of this pair. We see could find significant trading opportunities as per analysis upon price action confirmation we may take this trade. Smash the like button if you find value in this analysis and drop a comment if you have any questions or let me know which pair to cover in my next analysis.
