$BTC ATH Sept 23 - 30th - Global Liquidity UpdateThis total global liquidity indicator alongside DXY (inverted) has pretty much nailed BTC tops and bottoms to the day this cycle.
Pretty wild how accurate this is.
Notice the inverted head & shoulders pattern and neckline break for confirmation.
J-DXY

USDJPY and DXY, Is FOMC affecting the both currency?Hello traders, this is a complete multiple timeframe analysis of this pair. We see could find significant trading opportunities as per analysis upon price action confirmation we may take this trade. Smash the like button if you find value in this analysis and drop a comment if you have any questions or let me know which pair to cover in my next analysis.

USD/CAD - Bearish Flag (15.09.2025)The USD/CAD Pair on the M30 timeframe presents a Potential Selling Opportunity due to a recent Formation of a Bearish Flag Pattern. TRADENATION:USDCAD
This suggests a shift in momentum towards the downside in the coming hours.
Possible Short Trade:
Entry: Consider Entering A Short Position around Trendline Of The Pattern.
Target Levels:
1st Support – 1.3814
2nd Support – 1.3796
🎁 Please hit the like button and
🎁 Leave a comment to support for My Post !
Your likes and comments are incredibly motivating and will encourage me to share more analysis with you.
Best Regards, KABHI_TA_TRADING
Thank you.

EURUSD - 15-Minute Opportunity – Risk/Reward 2.22Guys, greetings
I’ve prepared an EURUSD analysis for you.
On my 15-minute chart:
🟢 Buy entry level: 1.17152
🔴 Stop level: 1.17002
🎯 TP1: 1.17206
🎯 TP2: 1.17287
🎯 TP3: 1.17480
Risk/reward ratio for this trade: 2.22
Guys, every single like you give is my biggest motivation to keep sharing these analyses.
Thank you to all my friends who support me with their likes and stand by my side.

USDJPY — Signed by Tilki: Precision, Emotion, Discipline!Hey traders,
Here’s my USDJPY setup based on the 30-minute chart:
🟢 Buy Entry: 147.402
🔴 Stop Loss: 146.987
🎯 TP1: 147.567
🎯 TP2: 147.788
🎯 TP3: 148.239
Risk/Reward Ratio: 2.00
Every single like you drop is fuel for me to keep sharing these setups.
Big thanks to everyone standing by and supporting the journey.

Bearish drop formation?The US Dollar Index (DXY) is rising towards the pivot and could reverse to the 1st support.
Pivot: 98.63
1st Support: 97.12
1st Resistance: 100.21
Disclaimer:
The above opinions given constitute general market commentary, and do not constitute the opinion or advice of IC Markets or any form of personal or investment advice.
Any opinions, news, research, analyses, prices, other information, or links to third-party sites contained on this website are provided on an "as-is" basis, are intended only to be informative, is not an advice nor a recommendation, nor research, or a record of our trading prices, or an offer of, or solicitation for a transaction in any financial instrument and thus should not be treated as such. The information provided does not involve any specific investment objectives, financial situation and needs of any specific person who may receive it. Please be aware, that past performance is not a reliable indicator of future performance and/or results. Past Performance or Forward-looking scenarios based upon the reasonable beliefs of the third-party provider are not a guarantee of future performance. Actual results may differ materially from those anticipated in forward-looking or past performance statements. IC Markets makes no representation or warranty and assumes no liability as to the accuracy or completeness of the information provided, nor any loss arising from any investment based on a recommendation, forecast or any information supplied by any third-party.

Gold | Oil | Dollar | Silver | Natural Gas Price ForecastGold | Oil | Dollar | Silver | Natural Gas Price Forecast
NYMEX:NG1! AMEX:UNG AMEX:BOIL PEPPERSTONE:NATGAS

DXY FRGNT WEEKLY CHART ANALYSIS - DXY Q3 W38 Y25🌍FRGNT WEEKLY CHART ANALYSIS - DXY Q3 W38 Y25
📊 DXY FRGNT Breakdown + Impact on GBP, EUR, and Cross Pairs
1. Higher Timeframe Context (Weekly)
Trend: Bearish → clear lower highs & lower lows since mid-summer.
Unmitigated Imbalance (IMB): 99–101 zone above current price → acts as a long-term liquidity magnet but not yet tested.
Bias: Weakness dominates until price proves otherwise.
2. Daily Timeframe
Supply Zone: 98.200–98.500 (aligns with Daily 50 EMA).
Demand Zone: 96.800–97.000 (next liquidity draw).
Expectation: Retrace into 98.2 supply, then continuation lower toward 97.0 demand.
3. Intraday (4H)
Supply Overlap: 97.800–98.200 (Daily + 4H confluence).
Structure: Still bearish, repeated rejections from the 50 EMA.
Projection: Price likely taps 98.0 area, then drives into 97.0 demand.
Summary
Bias: Bearish.
Watch for liquidity sweep above 98.0 → rejection → sell setups toward 97.0 demand.
🌍 Impact on GBP, EUR, and Cross Pairs
GBPUSD
Effect: Dollar weakness supports bullish setups.
Expect retrace into 1.2670–1.2720 demand before price extends higher.
Targets: 1.2800–1.2850, with potential stretch toward 1.2950.
Narrative: As long as DXY stays capped under 98.2, GBPUSD should continue higher.
EURUSD
Effect: Also benefits from USD weakness, though less aggressively than GBP.
Look for longs around 1.0850–1.0880 demand.
Targets: 1.0950–1.1000.
Narrative: Similar structure to GBPUSD, but GBP is likely to outperform EUR.
EURGBP
Effect: GBP stronger than EUR → bearish bias.
Shorts valid below 0.8520, aiming for liquidity under 0.8430–0.8450.
Narrative: Even if both EUR and GBP rise against USD, GBP is leading.
Other USD Cross Pairs
USDJPY: Likely to weaken, targeting 144.50–145.00 liquidity.
USDCAD: Bearish pressure, could reach 1.3600 demand.
USDCHF: Lower toward 0.8850–0.8900 demand.
✅ Overall Picture
DXY Bearish = Favor longs on GBPUSD & EURUSD.
GBP stronger than EUR = EURGBP shorts are attractive.
JPY & CHF weak = Pairs like GBPJPY and EURJPY can push higher.
👉 In short: DXY’s weakness is the engine, driving GBPUSD and EURUSD higher. The Pound has the edge, making EURGBP a sell candidate while GBPJPY becomes a standout buy.
TVC:DXY
FRGNT

GBPUSD thoughtsIve already scale in some profits from this trade and depending on market open i will set SL to breakeven on market condition for next week but long on gold

My thoughts On EURUSDIve taken a long on Friday, took partials off and set SL to breakeven. I expect price to continue its upward trend for next week.

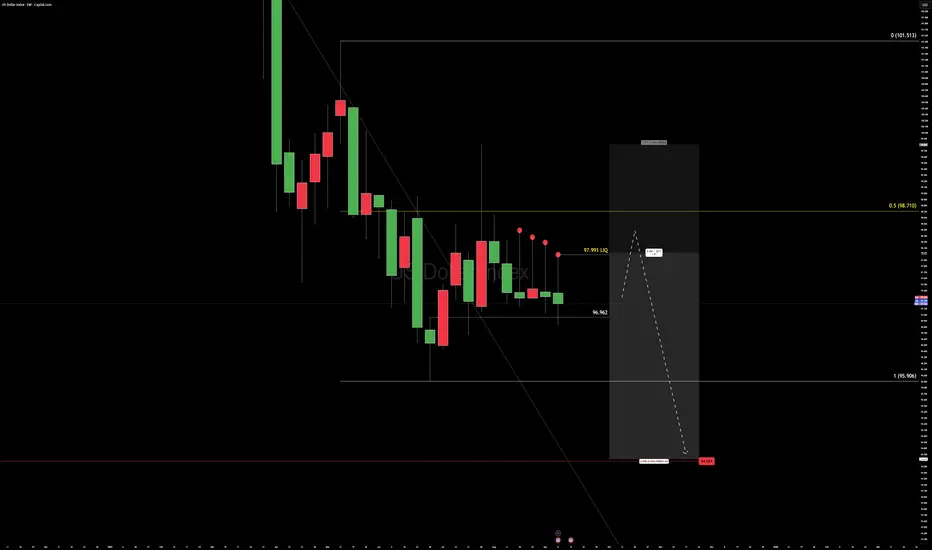
Pre-FOMC Crossfire US DOLLAR INDEXPre-FOMC Dollar War Map
The weekly chart just printed a fourth straight lower high—
a slow grind down while Friday’s close stayed red.
Liquidity is stacked behind us, perfect fuel if the desks want to run stops before the Fed.
Order flow shows massive resting bids around 96.962, the last structural block.
If that line cracks, expect the move to be fast and brutal.
Cross-markets are whispering the opposite:
equities, metals, and crypto are coiled to run if the dollar slips.
The headlines will call it a surprise.
It isn’t. The map was drawn weeks ago.
Focus on levels, not noise.
Trade the reaction, not the prediction.
DXYDXY has got a potential to give us correction and push up if FOMC will be dropping the Dollar.
Disclosure: We are part of Trade Nation's Influencer program and receive a monthly fee for using their TradingView charts in our analysis.

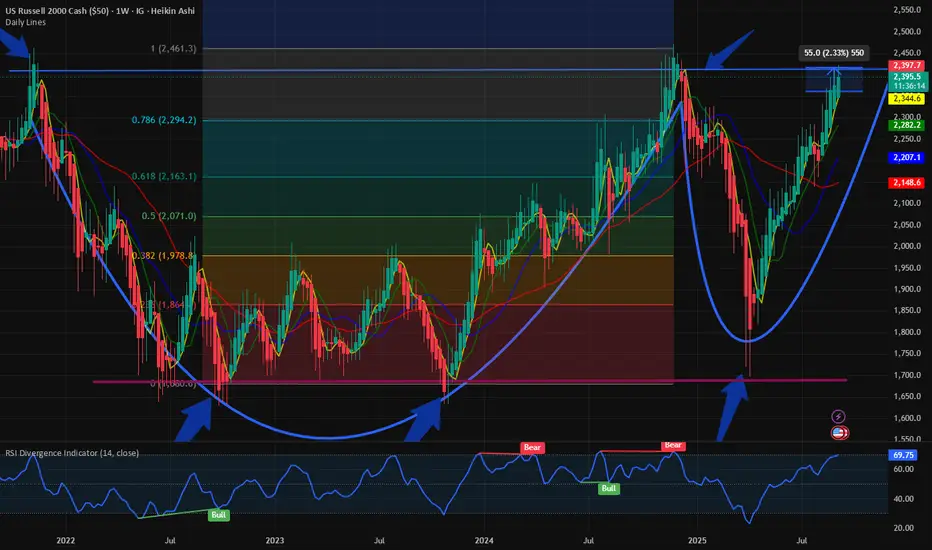
Breakout attempt by $RUSSELL. Can it do it? Supported by $DXYIn this blog space we have been watching the Cup and Handle pattern in the small cap index $RUSSELL. Back in July 15 we said that there is a major resistance @ 2400.
$RUSSEL: Completion of Cup and Handle formation or higher? for IG:RUSSELL by RabishankarBiswal — TradingView
But as we are near the top of the previous high and towards the end of the completion pattern of this major Cup and handle formation for almost 3 years, we must see which direction the index will resolve. For that we need to investigate US Dollar index $DXY.
We have been bearish on TVC:DXY with 95 as our short-term target. Currently @ 97 this 2% down movement can provide major boost to risk assets and $RUSSELL.
TVC:DXY : New lows begets new lows. ECONOMICS:USM2 : Why is it increasing? for TVC:DXY by RabishankarBiswal — TradingView
With major Fed decision coming next week and weakness by TVC:DXY we can say the path of least resistance for IG:RUSSELL is upwards and breaks above the major resistance in this cup and handle pattern.
Verdict: IG:RUSSELL can go higher if TVC:DXY goes lower and Fed cuts. Once above 2400 then we are in price discovery mode for $RUSSELL.
Gold Pullback Toward 3,630 as Uptrend Remains IntactHey Traders, in tomorrow's trading session we are monitoring XAUUSD (Gold) for a buying opportunity around the 3,630 zone. Gold is trading in an uptrend, with price currently correcting toward this key support/resistance level.
Structure: The broader bias remains bullish, but price is retracing after recent highs.
Key level in focus: 3,630 — a significant zone where buyers may look to rejoin the prevailing trend.
Fundamentals: A softer U.S. Dollar and steady demand for safe-haven assets continue to support the case for Gold strength on dips.
Trade safe,
Joe.


Head and Shoulders Pattern on U.S. Dollar Index (DXY) – Bearish Overview of the Idea (as shown in the chart)
The chart illustrates a Head and Shoulders (H&S) reversal pattern forming on the U.S. Dollar Index (DXY). This classical technical pattern signals a potential trend reversal from bullish to bearish.
Left Shoulder: The first peak followed by a pullback.
Head: A higher peak, forming the top of the pattern.
Right Shoulder: A lower peak compared to the head, roughly equal to the left shoulder.
Neckline: A support line connecting the lows between the shoulders. Once broken, it indicates potential bearish continuation.
The chart highlights:
A breakout below the neckline.
A retest of the neckline (common in H&S setups, where old support becomes resistance).
A projected downside target aligned with the height of the head-to-neckline move.
Detailed Analysis
1. Pattern Identification
The H&S is clear: higher high (Head) flanked by two lower highs (Shoulders).
The neckline is slightly ascending, but once broken, it signals sellers stepping in.
2. Breakout Confirmation
Price broke below the neckline, confirming the bearish pattern.
The retest at ~97.62 shows rejection, strengthening the bearish outlook.
3. Bearish Projection
Technical rule: the expected downside target is approximately equal to the distance from the head to the neckline, projected downwards from the breakout point.
The chart projects a move toward 97.25, which aligns with the marked support zone.
Timing
The projection points to Monday, 15/09/25, suggesting this bearish move may unfold in the upcoming trading sessions.
Walkthrough Thought Process
Think of the market like a battle between buyers and sellers:
The buyers pushed price higher (Head), but then failed to sustain strength at the right shoulder.
When price breaks the neckline, it shows sellers are gaining control.
The retest confirms that what was once support (neckline) has now become resistance.
This setup gives traders confidence to enter a short (sell) trade, targeting the projected downside.
Trade Idea
Entry : After retest rejection around 97.62.
Target (TP) : 97.25 (support zone based on H&S projection).
Stop Loss (SL) : Above the right shoulder at 97.80 (to protect if pattern fails).

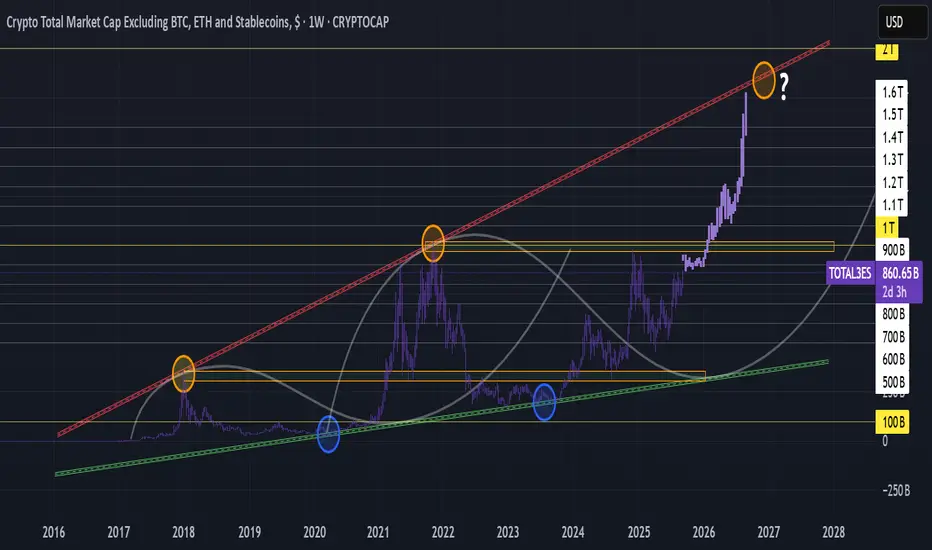
TOTAL3ES (Excluding BTC/ETH/stables) is coiled up."History doesn't repeat itself, but it often rhymes"
$1T is the line in the sand - reclaim & retest and the runway opens.
DXY rolling over (see previous post) = perfect fuel.
Alt season & beyond may almost be here.
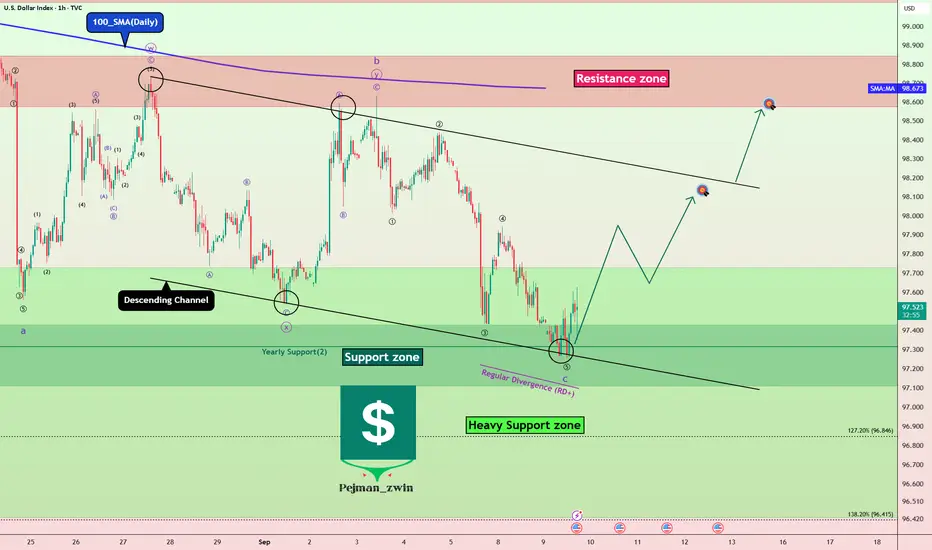
DXY at Major Support – Dollar Ready to Rebound?Today, I want to analyze the DXY index ( TVC:DXY ) for you. First, I must say that this week, US indexes can have an impact on the DXY index trend .
US indexes to be released this week:
Core PPI m/m: Tomorrow
PPI m/m: Tomorrow
Core CPI m/m: Thursday
CPI m/m: Thursday
CPI y/y: Thursday
Unemployment Claims: Thursday
Prelim UoM Consumer Sentiment: Friday
Prelim UoM Inflation Expectations: Friday
The DXY Index is currently moving near the Support zone($97.989-$97.834) , Yearly Support(2) , and the lower line of the descending channel .
In terms of Elliott Wave theory , it seems that the DXY index has managed to complete microwave 5 of the main wave C . The corrective structure is of the Zigzag Correction(ABC/5-3-5) type.
Also, we can see the Regular Divergence (RD+) between consecutive valleys .
I expect the DXY index to rise to at least $98.07(First Target) before the US indexes are announced.
Second Target: $98.56
Stop Loss(SL): $96.997
Note: With the DXY index rising, we can expect a correction in Gold( OANDA:XAUUSD ), Bitcoin( BINANCE:BTCUSDT ), and major Forex pairs (dollar strength).
Please respect each other's ideas and express them politely if you agree or disagree.
U.S. Dollar Index Analyze (DXYUSD), 1-hour time frame.
Be sure to follow the updated ideas.
Do not forget to put a Stop loss for your positions (For every position you want to open).
Please follow your strategy and updates; this is just my Idea, and I will gladly see your ideas in this post.
Please do not forget the ✅' like '✅ button 🙏😊 & Share it with your friends; thanks, and Trade safe.
Gold Setting Up for Weekly Low Sweep – Watching 3650sGold has stalled out at the highs this week and is showing signs of exhaustion after a strong 2-week bullish run. Thursday’s close left us hovering just above key support in the 3650s.
For Friday, I’m watching for a break and close below yesterday’s low on the 1H chart. If we get that confirmation, I’ll be looking for continuation shorts targeting Monday’s low and potentially the 8HR FVG around 3600–3620 to close out the week.
If bulls defend this level again, then the range may extend — but the cleaner move is down into untested imbalances below.
This sets up Friday as a key day:
✅ Break yesterday’s low = downside liquidity run in play
❌ Hold support again = chop/range into next week

Trade Insight BTC, ETH & GOLD📢 NFX Market Update – BITSTAMP:BTCUSD BTC, BINANCE:ETHUSD & FX:XAUUSD
Similar to Ethereum, Bitcoin (BTCUSD.r) is facing a potential heavy block order between 114,750 – 115,000. On the H1 chart, a divergence formation is signaling the risk of a short-term retracement. Price is consolidating, and I expect a pullback toward the ascending triangle breakout zone, which now acts as support.
Given current volatility and conflicting signals, I strongly recommend staying off trading on Ethereum, Bitcoin, and Gold until the market cools off and provides a clearer direction.
Patience here is key - let the market reveal its next move before stepping in.💚

XAU/USD (Gold) - Trendline Breakout (US - CPI Data) (11.09.2025)The XAU/USD Pair on the M30 timeframe presents a Potential Selling Opportunity due to a recent Formation of a Trendline Breakout Pattern.
This suggests a shift in momentum towards the downside in the coming hours.
Possible Short Trade:
Entry: Consider Entering A Short Position around Trendline Of The Pattern.
Target Levels:
1st Support – 3583
2nd Support – 3546
🎁 Please hit the like button and
🎁 Leave a comment to support for My Post !
Your likes and comments are incredibly motivating and will encourage me to share more analysis with you.

GBP/USD - Breakout (US - CPI Data) (11.09.2025)The GBP/USD Pair on the M30 timeframe presents a Potential Selling Opportunity due to a recent Formation of a Breakout Pattern.
This suggests a shift in momentum towards the downside in the coming hours.
Possible Short Trade:
Entry: Consider Entering A Short Position around Trendline Of The Pattern.
Target Levels:
1st Support – 1.3475
2nd Support – 1.3441
🎁 Please hit the like button and
🎁 Leave a comment to support for My Post !
Your likes and comments are incredibly motivating and will encourage me to share more analysis with you.

Bearish reversal off 61.8% Fibonacci resistance?The US Dollar Index (DXY) is rising towards the pivot which aligns with the 61.8% Fibonacci retracement, and could reverse to the 1st support.
Pivot: 98.11
1st Support: 97.36
1st Resistance: 98.47
Disclaimer:
The above opinions given constitute general market commentary, and do not constitute the opinion or advice of IC Markets or any form of personal or investment advice.
Any opinions, news, research, analyses, prices, other information, or links to third-party sites contained on this website are provided on an "as-is" basis, are intended only to be informative, is not an advice nor a recommendation, nor research, or a record of our trading prices, or an offer of, or solicitation for a transaction in any financial instrument and thus should not be treated as such. The information provided does not involve any specific investment objectives, financial situation and needs of any specific person who may receive it. Please be aware, that past performance is not a reliable indicator of future performance and/or results. Past Performance or Forward-looking scenarios based upon the reasonable beliefs of the third-party provider are not a guarantee of future performance. Actual results may differ materially from those anticipated in forward-looking or past performance statements. IC Markets makes no representation or warranty and assumes no liability as to the accuracy or completeness of the information provided, nor any loss arising from any investment based on a recommendation, forecast or any information supplied by any third-party.
