USD/CHF - Trendline Rejection (10.11.2025)📊 Setup Overview : FX:USDCHF
USD/CHF continues to respect the descending trendline and Ichimoku cloud resistance, signaling potential downside pressure. Price is currently retesting the resistance zone (0.8070–0.8085) — a strong supply area that has rejected multiple times.As long as this zone holds, we expect a move toward the next support zones.
🧭 Trade Plan
Bias: 🔻 Sell / Short-term Bearish
Entry Zone: 0.8060 – 0.8080 (wait for confirmation candle or rejection)
Target 1 (1st Support): 0.8015
Target 2 (2nd Support): 0.7995
Invalidation: Break and close above 0.8085 (Resistance Zone)
⚡ Fundamental Updates
1️⃣ U.S. Treasury yields eased slightly as consumer confidence declined.
2️⃣ Markets now price a 66% chance of a rate cut in December, according to CME’s FedWatch Tool.
3️⃣ U.S. government shutdown concerns keep the dollar under mild pressure as investors watch debt issuance risk.
💬 Summary
A clear trendline rejection combined with fundamental USD weakness supports a short bias.
Wait for confirmation before entering — patience protects capital.
⚠️ Disclaimer
This analysis is for educational purposes only and not financial advice.
Always do your own research and manage risk wisely.
📢 Support My Work
💚 Like, Comment & Share this idea to motivate more chart updates!
🧠 “Charts Don’t Lie, Traders Don’t Quit.”
#USDCHF #ForexAnalysis #TradingView #PriceAction #Trendline #Ichimoku #TechnicalAnalysis #ForexTrader #Fundamentals #SwingTrading #KABHI_TA_TRADING
J-USD

EUR/USD – H4 Wedge Pattern | Dollar Weakness & Fed Cut Bets🧠 Setup Overview:
EUR/USD is forming a falling wedge pattern on the H4 chart — a potential bullish reversal structure after weeks of downside pressure. The pair is testing the upper wedge trendline, suggesting a possible breakout, but confirmation is still pending. FX:EURUSD
📊 Trading Plan: ✅ Bullish Scenario:
🟢Watch for a confirmed breakout above the wedge and cloud resistance zone.
🟢If confirmed, expect a move toward 1.1730 (1st Resistance) and 1.1800 (2nd Resistance).
⚙️ Technical Levels:
🟢 1st Resistance: 1.1732
🟢 2nd Resistance: 1.1804
🔴 Support Zone: 1.1500 – 1.1470
🧩 Fundamental Updates (Today – 9 Nov 2025):
1️⃣ U.S. Treasury yields slipped slightly as surveys showed weaker consumer confidence, softening the dollar’s tone.
2️⃣ Fed rate cut expectations increased — markets now price a 66% chance of a 25 bps cut in December, according to CME FedWatch.
3️⃣ Government funding worries: renewed concerns over a potential U.S. government shutdown weighed on sentiment and limited USD demand.
🔴These factors combined create short-term bearish pressure on USD, which may fuel a EUR/USD rebound if momentum sustains above the wedge.🔴
#EURUSD #Forex #PriceAction #TechnicalAnalysis #ChartPattern #FallingWedge
#FundamentalAnalysis #FedWatch #USD #EUR #ForexSignals #KABHI_TA_TRADING #ChartsDontLieTradersDontQuit #SwingTrading #ForexEducation #FXMarket #TradingView
⚠️ Disclaimer:
This post is for educational purposes only — not financial advice. Always perform your own analysis and manage risk carefully before entering trades.
💬 Support My Work ❤️
If you like this analysis — drop a LIKE 👍, leave a COMMENT 💭, and FOLLOW 🔔 to stay updated with more Forex setups, price action insights, and live market fundamentals!

GBPUSD Potential UpsidesHey Traders, in today's trading session we are monitoring GBPUSD for a buying opportunity around 1.31400 zone, GBPUSD is trading in an uptrend and currently is in a correction phase in which it is approaching the trend at 1.31400 support and resistance area.
Trade safe, Joe.

EUR/USD: Bearish Setup Confirmed After Head and Shoulders BreaksHi guys!
The chart shows a Three Drives pattern followed by a Head and Shoulders formation, both signaling potential bearish continuation.
The Three Drives Pattern:
The price completed three consecutive bullish drives, each showing signs of exhaustion. This structure often indicates a weakening uptrend and prepares the ground for a larger reversal.
The Head and Shoulders Pattern:
After the third drive, the market formed a clear head and shoulders structure, confirming distribution at the top. The neckline has already been broken, suggesting a shift from bullish to bearish sentiment.
Current Structure and Expectation:
Price is now retesting the neckline area after the breakdown. A rejection from this level would likely trigger a deeper decline toward the highlighted target zone, which aligns with previous demand and the flip area.
Target:
The projected target of the head and shoulders pattern falls near 1.12500, matching the lower pink zone on the chart.
In summary, unless the market decisively reclaims the neckline and trendline support, EUR/USD remains biased to the downside, with the 1.1250 area as the next key level to watch.
Disclaimer: As part of ThinkMarkets’ Influencer Program, I am sponsored to share and publish their charts in my analysis.

AUDUSD H1 | Heading Into Overlap ResistanceMomentum: Bearish
Price is rising toward the sell entry, which aligns with the 50% Fibonacci retracement and the 127.2% Fibonacci extension.
Sell Entry: 0.6538
Overlap resistance
50% Fibonacci retracement and 127.2% Fibonacci extension
Stop Loss: 0.6557
Strong overlap resistance
61.8% Fibonacci retracement
Take Profit: 0.6503
Pullback support
Stratos Markets Limited (tradu.com ):
CFDs are complex instruments and come with a high risk of losing money rapidly due to leverage. 68% of retail investor accounts lose money when trading CFDs with this provider. You should consider whether you understand how CFDs work and whether you can afford to take the high risk of losing your money.
Stratos Europe Ltd (tradu.com ):
CFDs are complex instruments and come with a high risk of losing money rapidly due to leverage. 70% of retail investor accounts lose money when trading CFDs with this provider. You should consider whether you understand how CFDs work and whether you can afford to take the high risk of losing your money.

USD/JPY - Wedge Breakdown |Watch 150.00 & 148.00✅ USD/JPY Analysis – H4 Chart - Rising Wedge Breakdown Potential
Price is currently respecting a Rising Wedge structure, showing signs of exhaustion near the Key Zone (≈154.20–154.70). We’ve seen a break + minor retest, indicating possible bearish continuation if sellers maintain pressure.
A drop toward the Psychological Level – 150.00 remains likely, followed by a deeper move into the 148.00 Key Zone if momentum continues.
✅ Market Context:
1️⃣Downward structure building inside the pattern.
2️⃣Sellers are showing strength near support levels.
3️⃣Breakdown below the trendline indicates momentum continuation toward lower zones.
✅ Trade Plan:
Entry: Sell after confirmed breakdown below the support (Candle close below trendline or retest of the breakout).
💰Take Profit (TP): At the Key Zone – major support area identified ahead.
🛑Stop Loss (SL): Above the pattern structure / recent swing high.
✅Psychological Discipline:
1️⃣Stick to plan – No Revenge Trades.
2️⃣Accept losing trades as part of the strategy.
3️⃣Risk only 1–2% of your account balance per trade.
✅ Support this analysis with a
LIKE 👍 | COMMENT 💬 | FOLLOW 🔔
It helps a lot & keeps the ideas coming!
⚠️ Disclaimer: This analysis is for educational purposes only and does not constitute financial advice. Forex trading involves high risk. Trade only with capital you can afford to lose and always do your own research.

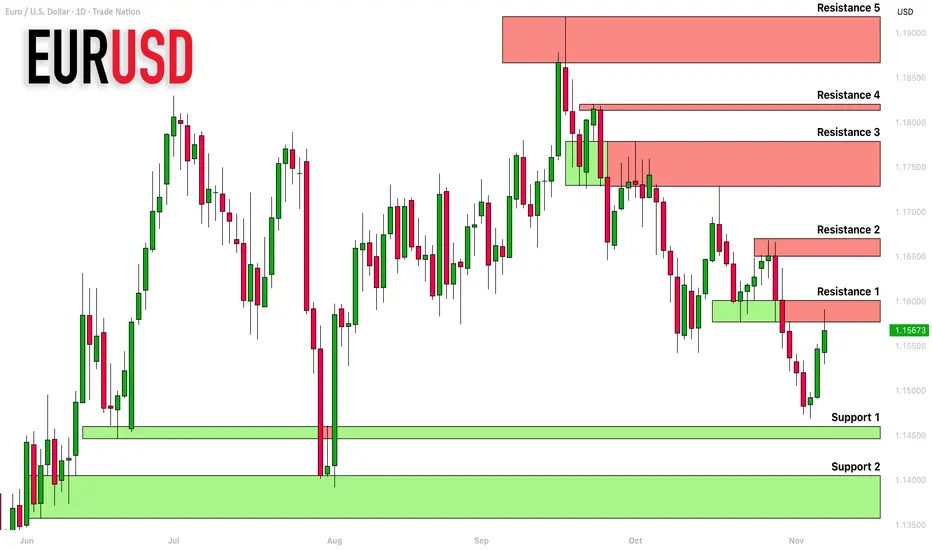
EURUSD: Support & Resistance Analysis For Next Week 🇪🇺🇺🇸
Here is my latest structure analysis and important
supports and resistances for EURUSD for next week.
Consider these structures for pullback/breakout trading.
❤️Please, support my work with like, thank you!❤️
I am part of Trade Nation's Influencer program and receive a monthly fee for using their TradingView charts in my analysis.
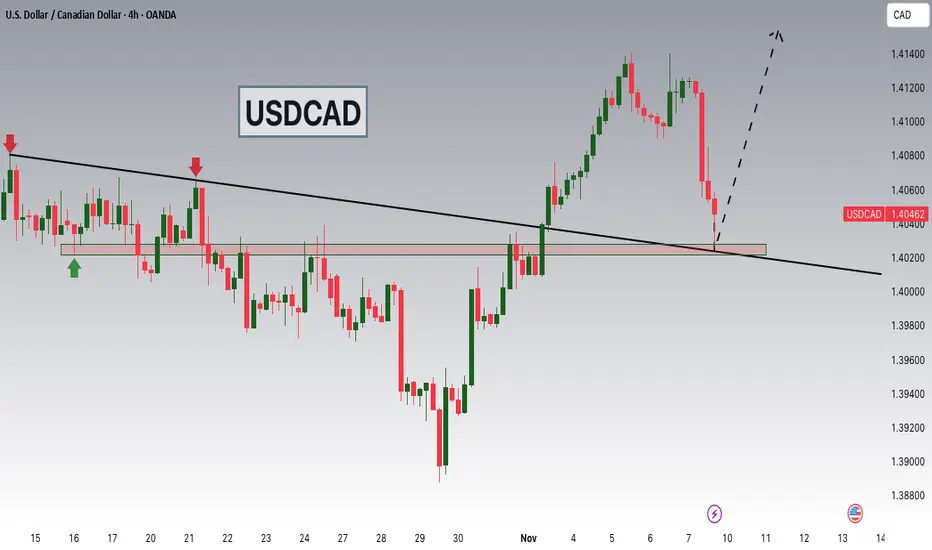
USDCAD Breakout and Potential RetraceHey Traders, in tomorrow's trading session we are monitoring USDCAD for a buying opportunity around 1.40250 zone, USDCAD was trading in a downtrend and successfully managed to break it out. Currently is in a correction phase in which it is approaching the retrace area at 1.40250 support and resistance area.
Trade safe, Joe.
USDCHF H4 | Bearish Reversal Off Pullback ResistanceMomentum: Bearish
Price is currently reacting to a sell entry at a pullback resistance level that aligns with the 38.2% Fibonacci retracement.
Sell Entry: 0.8068 (Pullback resistance, 38.2% Fibonacci retracement
Stop Loss: 0.8125
Swing high resistance
Take Profit: 0.8007
Overlap support, slightly above the 50% Fibonacci retracement.
Stratos Markets Limited (tradu.com ):
CFDs are complex instruments and come with a high risk of losing money rapidly due to leverage. 68% of retail investor accounts lose money when trading CFDs with this provider. You should consider whether you understand how CFDs work and whether you can afford to take the high risk of losing your money.
Stratos Europe Ltd (tradu.com ):
CFDs are complex instruments and come with a high risk of losing money rapidly due to leverage. 70% of retail investor accounts lose money when trading CFDs with this provider. You should consider whether you understand how CFDs work and whether you can afford to take the high risk of losing your money.

LONG ON GBP/USDGBP/USD has given us a nice retracement after a CHOC (Change of Character) to the upside.
I expect GU to rise to the next high for about 100-200 pips.

Potential bullish rise?GBP/USD has bounced off the support level, which is a pullback support that aligns iwth rhe 50% Fibonacci retracement and could bounce from this level to our take profit.
Entry: 1.3103
Why we like it:
There is a pullback support that lines up with the 50% Fibonacci retracement.
Stop loss: 1.3013
Why we like it:
There is a swing low support level.
Take profit: 1.3260
Why we like it:
There is a pullback resistance at the 50% Fibonacci retracement.
Enjoying your TradingView experience? Review us!
Please be advised that the information presented on TradingView is provided to Vantage (‘Vantage Global Limited’, ‘we’) by a third-party provider (‘Everest Fortune Group’). Please be reminded that you are solely responsible for the trading decisions on your account. There is a very high degree of risk involved in trading. Any information and/or content is intended entirely for research, educational and informational purposes only and does not constitute investment or consultation advice or investment strategy. The information is not tailored to the investment needs of any specific person and therefore does not involve a consideration of any of the investment objectives, financial situation or needs of any viewer that may receive it. Kindly also note that past performance is not a reliable indicator of future results. Actual results may differ materially from those anticipated in forward-looking or past performance statements. We assume no liability as to the accuracy or completeness of any of the information and/or content provided herein and the Company cannot be held responsible for any omission, mistake nor for any loss or damage including without limitation to any loss of profit which may arise from reliance on any information supplied by Everest Fortune Group.

EURUSD H1 | Bullish Bounce OffMomentum: Bullish
Price has rebounded from the buy entry level, which aligns with the 38.2% Fibonacci retracement, suggesting a continuation of the bullish momentum.
Buy Entry: 1.1561
Pullback support
Confluence with 38.2% Fibonacci retracement
Stop Loss: 1.1521
Pullback support
Slightly above the 61.8% Fibonacci retracement
Take Profit: 1.1586
Strong overlap resistance
Stratos Markets Limited (tradu.com ):
CFDs are complex instruments and come with a high risk of losing money rapidly due to leverage. 68% of retail investor accounts lose money when trading CFDs with this provider. You should consider whether you understand how CFDs work and whether you can afford to take the high risk of losing your money.
Stratos Europe Ltd (tradu.com ):
CFDs are complex instruments and come with a high risk of losing money rapidly due to leverage. 70% of retail investor accounts lose money when trading CFDs with this provider. You should consider whether you understand how CFDs work and whether you can afford to take the high risk of losing your money.

Potential bullish reversal?Kiwi (NZD/USD) is falling towards the pivot and could reverse to the 1st resistance.
Pivot: 0.5577
1st Support: 0.5479
1st Resistance: 0.5762
Disclaimer:
The above opinions given constitute general market commentary, and do not constitute the opinion or advice of IC Markets or any form of personal or investment advice.
Any opinions, news, research, analyses, prices, other information, or links to third-party sites contained on this website are provided on an "as-is" basis, are intended only to be informative, is not an advice nor a recommendation, nor research, or a record of our trading prices, or an offer of, or solicitation for a transaction in any financial instrument and thus should not be treated as such. The information provided does not involve any specific investment objectives, financial situation and needs of any specific person who may receive it. Please be aware, that past performance is not a reliable indicator of future performance and/or results. Past Performance or Forward-looking scenarios based upon the reasonable beliefs of the third-party provider are not a guarantee of future performance. Actual results may differ materially from those anticipated in forward-looking or past performance statements. IC Markets makes no representation or warranty and assumes no liability as to the accuracy or completeness of the information provided, nor any loss arising from any investment based on a recommendation, forecast or any information supplied by any third-party.

EUR/USD Could Drop Soon — Watch This 4H FVG Area!Hi everyone, this is my new analysis on EUR/USD.
As you can see, the price is currently in a downtrend on the 4-hour timeframe.
We have a clear Fair Value Gap (FVG) that aligns with the downtrend line. At the same time, the price is approaching the 61.8% Fibonacci retracement level, while the DXY chart is sitting at a support zone.
Based on this confluence, I expect the price to reach the 4H FVG zone soon.
Once it gets there, we need to wait for a Change of Character (CHOCH) to the downside on the 15-minute or 5-minute timeframe before entering a sell position.
I’ve also marked the daily support level on the chart. I expect the price to create a new low and test this daily support before any potential bounce.
⚠️ Important:
If we don’t see any CHOCH on the 15M or 5M timeframe once the price reaches the FVG zone, then this setup becomes invalid.
The setup is only valid if the price taps into the 4H FVG and shows a clear CHOCH to the downside — that’s our signal to go short.
This setup offers a very good risk-to-reward ratio if confirmed.

Bearish drop off?USD/CAD could rise to he resistance level, which is a pullback resistance and could reverse from this level to our take profit.
Entry: 1.4069
Why we like it:
There is a pullback resistance level.
Stop loss: 1.4139
Why we like it:
There is a swing high resistance level.
Take profit: 1.3982
Why we like it:
There is a pullback support level that aligns with the 61.8% Fibonacci retracement.
Enjoying your TradingView experience? Review us!
Please be advised that the information presented on TradingView is provided to Vantage (‘Vantage Global Limited’, ‘we’) by a third-party provider (‘Everest Fortune Group’). Please be reminded that you are solely responsible for the trading decisions on your account. There is a very high degree of risk involved in trading. Any information and/or content is intended entirely for research, educational and informational purposes only and does not constitute investment or consultation advice or investment strategy. The information is not tailored to the investment needs of any specific person and therefore does not involve a consideration of any of the investment objectives, financial situation or needs of any viewer that may receive it. Kindly also note that past performance is not a reliable indicator of future results. Actual results may differ materially from those anticipated in forward-looking or past performance statements. We assume no liability as to the accuracy or completeness of any of the information and/or content provided herein and the Company cannot be held responsible for any omission, mistake nor for any loss or damage including without limitation to any loss of profit which may arise from reliance on any information supplied by Everest Fortune Group.

Bearish reversal off pullback resistance?EUR/USD has rejected off the resistance level, which is an overlap resistance that is slightly below the 61.8% Fibonacci retracement, and could drop from this level to our take profit.
Entry: 1.1581
Why we like it:
There is an overlap resistance that is slightly below the 61.8% Fibonacci retracement.
Stop loss: 1.1620
Why we like it:
There is an overlap resistance that lines up with the 78.6% Fibonacci retracement.
Take profit: 1.1509
Why we like it:
There is a pullback support that is slightly below the 61.8% Fibonacci retracement.
Enjoying your TradingView experience? Review us!
Please be advised that the information presented on TradingView is provided to Vantage (‘Vantage Global Limited’, ‘we’) by a third-party provider (‘Everest Fortune Group’). Please be reminded that you are solely responsible for the trading decisions on your account. There is a very high degree of risk involved in trading. Any information and/or content is intended entirely for research, educational and informational purposes only and does not constitute investment or consultation advice or investment strategy. The information is not tailored to the investment needs of any specific person and therefore does not involve a consideration of any of the investment objectives, financial situation or needs of any viewer that may receive it. Kindly also note that past performance is not a reliable indicator of future results. Actual results may differ materially from those anticipated in forward-looking or past performance statements. We assume no liability as to the accuracy or completeness of any of the information and/or content provided herein and the Company cannot be held responsible for any omission, mistake nor for any loss or damage including without limitation to any loss of profit which may arise from reliance on any information supplied by Everest Fortune Group.

USDJPY Intraday Technical AnalysisUSDJPY Intraday Technical Analysis - 10 Nov 2025
USDJPY at 154.039 (12:25 PM UTC+4) coiling in a tight range before its next major move.
Market Context: Wyckoff distribution pattern forming after a strong uptrend. Dow Theory shows trend exhaustion.
Daily/4H View: 1D shows a spinning top candle, signaling indecision. 4H chart reveals a clear range between 153.80 and 154.25, with RSI bearish divergence.
1H/30M View: A tight Bollinger Band squeeze on the 30M chart confirms imminent volatility. Price is oscillating around a flat VWAP.
15M/5M View: A symmetrical triangle is forming, indicating a breakout is near. Price action is choppy, ideal for range-bound scalps.
Range-Bound Short Setup:
Entry: 154.20-154.25 (Range High).
SL: 154.40.
TP: 154.00, 153.85.
Range-Bound Long Setup:
Entry: 153.80-153.85 (Range Low).
SL: 153.65.
TP: 154.00, 154.20.
Breakout Long Setup: Enter on a confirmed 1H close > 154.30. SL: 154.10, TP: 154.60.
Breakdown Short Setup: Enter on a confirmed 1H close < 153.75. SL: 153.95, TP: 153.40.
Key Levels:
Resistance: 154.25, 154.50, 154.80.
Support: 153.80, 153.50, 153.20.
Indicators: 4H RSI bearish divergence, 30M BB Squeeze, flat VWAP, bearish Tenkan/Kijun cross on 1H Ichimoku.
Risk: High risk of sharp moves (intervention risk). Wait for confirmation on breakouts.
This is an educational analysis, not financial advice. Trade with a plan.

Bearish drop off?The Loonie (USD/CAD) has rejected the pivot level, which is acting as pullback resistance, and could decline toward the overlap support that aligns with the 38.2% Fibonacci retracement.
Pivot: 1.4148
1st Support: 1.3911
1st Resistance: 1.4301
Disclaimer:
The above opinions given constitute general market commentary, and do not constitute the opinion or advice of IC Markets or any form of personal or investment advice.
Any opinions, news, research, analyses, prices, other information, or links to third-party sites contained on this website are provided on an "as-is" basis, are intended only to be informative, is not an advice nor a recommendation, nor research, or a record of our trading prices, or an offer of, or solicitation for a transaction in any financial instrument and thus should not be treated as such. The information provided does not involve any specific investment objectives, financial situation and needs of any specific person who may receive it. Please be aware, that past performance is not a reliable indicator of future performance and/or results. Past Performance or Forward-looking scenarios based upon the reasonable beliefs of the third-party provider are not a guarantee of future performance. Actual results may differ materially from those anticipated in forward-looking or past performance statements. IC Markets makes no representation or warranty and assumes no liability as to the accuracy or completeness of the information provided, nor any loss arising from any investment based on a recommendation, forecast or any information supplied by any third-party.

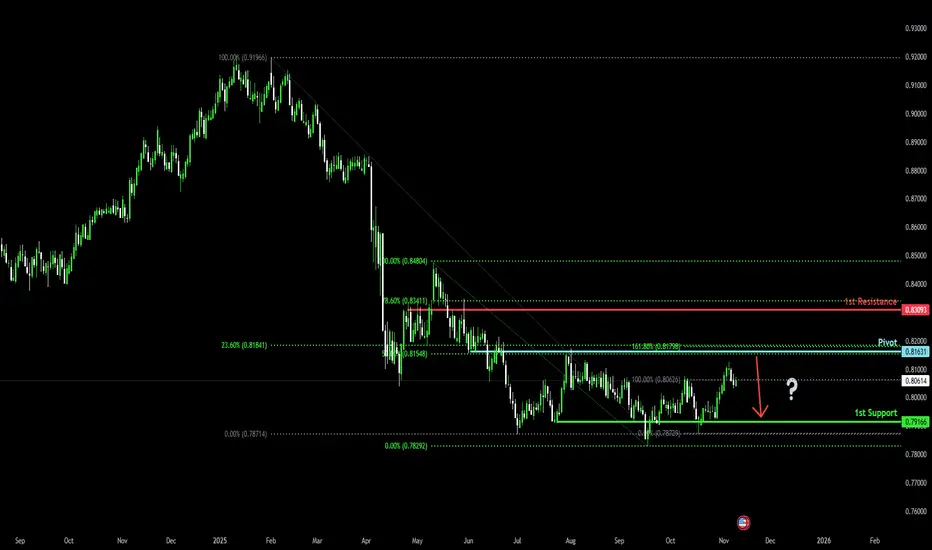
Bearish reversal off Fibonacci confluence?USD/CHF (Swissie) is rising toward the pivot level, which serves as an overlap resistance. A reversal from this area could see the pair decline toward the 1st support, which acts as a pullback support.
Pivot: 0.8163
1st Support: 0.7916
1st Resistance: 0.8309
Disclaimer:
The above opinions given constitute general market commentary, and do not constitute the opinion or advice of IC Markets or any form of personal or investment advice.
Any opinions, news, research, analyses, prices, other information, or links to third-party sites contained on this website are provided on an "as-is" basis, are intended only to be informative, is not an advice nor a recommendation, nor research, or a record of our trading prices, or an offer of, or solicitation for a transaction in any financial instrument and thus should not be treated as such. The information provided does not involve any specific investment objectives, financial situation and needs of any specific person who may receive it. Please be aware, that past performance is not a reliable indicator of future performance and/or results. Past Performance or Forward-looking scenarios based upon the reasonable beliefs of the third-party provider are not a guarantee of future performance. Actual results may differ materially from those anticipated in forward-looking or past performance statements. IC Markets makes no representation or warranty and assumes no liability as to the accuracy or completeness of the information provided, nor any loss arising from any investment based on a recommendation, forecast or any information supplied by any third-party.
AUDUSD Intraday Technical Analysis - 10 Nov 2025AUDUSD Intraday Technical Analysis - 10 Nov 2025
Australian Dollar/US Dollar at 0.65320 (3:40 PM UTC+4) — consolidation breakout imminent.
📌 Market Context: Wyckoff Phase D accumulation post-August correction; Dow Theory secondary uptrend forming; Gann Square-of-9 targets 0.6580/0.6480.
🗺️ Multi-Timeframe Pulse:
1D: Inverted head-and-shoulders pattern neckline at 0.6500; RSI 55 (neutral); Ichimoku cloud support 0.6420; bullish reversal signal forming.
4H: Rising channel 0.6480-0.6580; EMA21>EMA50 (golden cross); VWAP from Sept 20 = 0.6510 (support level).
1H: Cup-and-handle breakout attempt from 0.6480 base; BB midline 0.6520; VWAP slope neutral-bullish.
30M: Symmetrical triangle 0.6500-0.6560; hidden bull divergence on RSI; volume contracting.
15M: Bull flag over 0.6510; Tenkan>Kijun bullish alignment; stochastic RSI ready for extension.
5M: Falling wedge retest 0.6500; hammer candlestick signals intraday demand; false breakout risk above 0.6560.
🎯 PRIMARY LONG SETUP
Entry: 0.6510-0.6525 (triangle support + VWAP) — confirm on 15M bullish close >0.6535.
Stop Loss: 0.6485 (below triangle base).
Target 1: 0.6555 (+35 pips).
Target 2: 0.6580 (+60 pips — channel top).
Target 3: 0.6620 (+100 pips — harmonic extension).
Confirmation: RSI>55, volume +20%, VWAP support holding.
⚡ MOMENTUM ADD: Scale above 0.6580 ONLY if RSI>65 + volume surge; trail stop to 0.6560.
🔻 REVERSAL SHORT SETUP
Entry: 0.6600-0.6625 (supply zone) — trigger on bearish engulfing + RSI divergence.
Stop Loss: 0.6650 (above channel resistance).
Targets: 0.6560 → 0.6520 → 0.6480 (Gann support).
Confirmation: 5M/15M RSI bearish divergence; BB upper band rejection.
🚨 BREAKOUT PROTOCOL:
BULL: 1H close >0.6580 confirms H&S breakout; target 0.6700; move stop to BE+15.
BEAR: 1H close <0.6500 with volume expansion triggers retest of 0.6420 cloud support.
📊 INDICATOR SNAPSHOT: BB squeeze (30M) tightening; MACD histogram positive; VWAP slope neutral-up; EMA21 acting as trigger line on 1H.
⚠️ PATTERN ALERTS: Harmonic bat PRZ at 0.6600; H&S neckline breakout >0.6500 = trend confirmation; channel failure <0.6510 = Wyckoff spring risk.
📈 TIMING & RISK: RBA decision watch; Gann 90° cycle 20:00 UTC; expect 0.80% intraday range. Risk ≤1% per setup; avoid chasing; lock gains at TP1.
Educational analysis only. Trade with your plan, manage risk, adapt to live price action.

GBPUSD H1 | Bullish Momentum To ExtendMomentum: Bullish
Price is currently moving within an ascending channel and remains above the Ichimoku cloud, indicating sustained bullish momentum.
Buy Entry: 1.3136
Pullback support
23.6% Fibonacci retracement
Stop Loss: 1.3096
Pullback support
50% Fibonacci retracement
Take Profit: 1.3248
Overlap resistance
Slightly above the 61.8% Fibonacci retracement.
Stratos Markets Limited (tradu.com ):
CFDs are complex instruments and come with a high risk of losing money rapidly due to leverage. 68% of retail investor accounts lose money when trading CFDs with this provider. You should consider whether you understand how CFDs work and whether you can afford to take the high risk of losing your money.
Stratos Europe Ltd (tradu.com ):
CFDs are complex instruments and come with a high risk of losing money rapidly due to leverage. 70% of retail investor accounts lose money when trading CFDs with this provider. You should consider whether you understand how CFDs work and whether you can afford to take the high risk of losing your money.

USDJPY IDEA FOR 10TH OCT, 2025. (2H)A New Trading week is here again, expecting fresh information, volumes, and data to flood the markets this week, plus we expect high-impact news releases as well
However, currently the USD against the JPY is still overall bullish and trending because the pair is still breaking higher highs and forming new swings and structure patterns from my frame work below. I expect a short move downwards during LND sessions and, hopefully, a continuation later during the NY session. meanwhile, we wait for possible confirmations of trade ideas.
As usual, my calls or analysis are based on what I see, the current Bias, and from a probability standpoint, meaning that this projection may be or may not be validated, so tread carefully. This is not financial advice; trade responsibly.

Bullish reversal for the Cable?The price has bounced off the pivot, which is acting as pullback support, and could rise toward the first resistance level, which serves as pullback resistance.
Pivot: 1.3040
1st Support: 1.2809
1st Resistance: 1.3326
Disclaimer:
The above opinions given constitute general market commentary, and do not constitute the opinion or advice of IC Markets or any form of personal or investment advice.
Any opinions, news, research, analyses, prices, other information, or links to third-party sites contained on this website are provided on an "as-is" basis, are intended only to be informative, is not an advice nor a recommendation, nor research, or a record of our trading prices, or an offer of, or solicitation for a transaction in any financial instrument and thus should not be treated as such. The information provided does not involve any specific investment objectives, financial situation and needs of any specific person who may receive it. Please be aware, that past performance is not a reliable indicator of future performance and/or results. Past Performance or Forward-looking scenarios based upon the reasonable beliefs of the third-party provider are not a guarantee of future performance. Actual results may differ materially from those anticipated in forward-looking or past performance statements. IC Markets makes no representation or warranty and assumes no liability as to the accuracy or completeness of the information provided, nor any loss arising from any investment based on a recommendation, forecast or any information supplied by any third-party.
