DXY Has 99 Problems, Getting Above 100 Is One!Here we have TVC:DXY on the Weekly Chart.
Now clearly outlined we can see there is a very valuable level here @ 99-100 that the USD:
- Used as Resistance from 2015 til the Bullish Breakout in April 2020
- Used as Support from 2023 til the Bearish Breakdown in April 2025
Fundamentally is a very sketchy scenario because with the Shutdown causing lack of important data needed, The Federal Reserve is making Interest Rate cuts. This weakens the Dollar because it makes it less favorable to Foreign Investing.
On the flip side, Consumers Dollars are able to stretch further allowing them to purchase more but unfortunately we still combat the inflated prices on goods. Companies have the ability to get there raw ingredients cheaper, resume hiring processes, etc.
The slow creeping rise in Inflation has the Federal Reserve in a position to want to be ready to potentially Hike Rates when the Inflation, they believe, from the Tariffs will hit but as of yet, the recent CPI numbers came out not as hot as they thought, possibly playing into the reason for making the latest cut.
Nevertheless, by the last FOMC meeting, it would seem that there is a chance that was the last cut this year that may be made, if:
- Inflation continues to rise
or
- Continued softening labor market
J-USD

EURUSD - Preparing for the Next Wave of Bearish Momentum!🏹EURUSD remains trapped within a well-defined descending channel, with the market structure clearly favoring the bears.
Each rally has been met with selling pressure, forming a series of lower highs and lower lows, a textbook example of controlled downside continuation.
⚔️As price approaches the confluence zone, where the upper red trendline meets the horizontal structure around 1.1680–1.1700, I’ll be looking for potential trend-following short setups. This intersection has acted as a strong rejection point in previous moves, and it remains a key decision zone for sellers to step back in.
If rejection confirms there, the next leg lower could retest the 1.1550, then 1.1500 support areas.
On the flip side, a daily close above 1.1720 would be the first sign of a possible short-term shift in sentiment.
Until proven otherwise, the trend is clear — rallies are for selling.
⚠️ Disclaimer: This is not financial advice. Always do your own research and manage risk properly.
📚All Strategies Are Good; If Managed Properly!
~Richard Nasr

EUR/USD: Classic Breakout Trade - Don't Miss the Move!The 📉EURUSD pair experienced a decisive breakout and closed below a significant daily/intraday horizontal support cluster on Friday.
Following this breakout, the pair started to consolidate on an hourly timeframe, on the previously breached structure.
The bearish violation of this consolidation serves as a strong bearish confirmation.
Conversely, the price is projected to continue its downward trajectory, with a likely target of at least 1.1500.

EURUSD: Bounce from Support Could Trigger Move Toward 1.1640Hello everyone, here is my breakdown of the current Euro setup.
Market Analysis
EURUSD has been trading in a corrective phase after breaking down from the Upward Channel that previously guided its bullish movement. The pair formed a Range near the 1.1760 Resistance Area, showing consolidation before sellers regained control. Multiple Breakouts confirmed shifts in market structure — first to the upside within the channel, and later to the downside, signaling the transition from bullish to neutral-bearish momentum.
Recently, price found strong demand within the 1.1550–1.1560 Support Zone, which aligns with the Triangle Support Line. This level has been tested multiple times, acting as a significant pivot point for potential bullish reactions. The Triangle Resistance Line above continues to limit upward movement, forming a contracting structure that reflects growing pressure from both sides.
My Scenario & Strategy
From my view, EURUSD is currently setting up for a possible bullish rebound from the support zone near 1.1560. If buyers defend this level, the price could rise toward the Triangle Resistance Line around 1.1630–1.1640. A confirmed breakout above this resistance could open the way toward the key 1.1760 Resistance Zone, signaling a shift in sentiment back to bullish.
However, if the pair fails to hold above the Triangle Support Line, a breakdown could trigger a deeper decline toward 1.1500. For now, I maintain a short-term bullish bias, looking for long opportunities near support with clear confirmation signals.
That's the setup I'm tracking. Thank you for your attention, and always manage your risk.

EtHUSD M30 | Bullish Bounce Off Key SupportETH/USD has bounced off the buy entry, which is a pullback support that aligns with the 50% Fibonacci retracement and could potentially rise from this level to the upside.
Buy entry is at 787.96, which is a pullback support that aligns with the 50% Fibonacci retracement
Stop loss is at 3,679.04, which is a swing low support.
Take profit is at 3,4.94, which his an overlap resistance that is slightly above the 40% Fibonacci retracement.
Stratos Markets Limited (tradu.com ):
CFDs are complex instruments and come with a high risk of losing money rapidly due to leverage. 68% of retail investor accounts lose money when trading CFDs with this provider. You should consider whether you understand how CFDs work and whether you can afford to take the high risk of losing your money.
Stratos Europe Ltd (tradu.com ):
CFDs are complex instruments and come with a high risk of losing money rapidly due to leverage. 70% of retail investor accounts lose money when trading CFDs with this provider. You should consider whether you understand how CFDs work and whether you can afford to take the high risk of losing your money.

BNBUSD H4 | Price Drop-Off Signals Bearish ContinuationBNB?USD is rising towards the sell entry, which is an overlap resistance that lines up with the 38.2% Fibonacci retracement and could drop from this level to the downside.
Sell entry is at 1,089.90, whic is an overlap resistance that lines up with the 38.2% Fibonacci retracement.
Stop loss is at 1,136.97, whic is a pullback resistance that is slightly above the 61.8% Fibonacci retracement.
Take profit is at 1,021.35, whic is an overlap support.
Stratos Markets Limited (tradu.com ):
CFDs are complex instruments and come with a high risk of losing money rapidly due to leverage. 68% of retail investor accounts lose money when trading CFDs with this provider. You should consider whether you understand how CFDs work and whether you can afford to take the high risk of losing your money.
Stratos Europe Ltd (tradu.com ):
CFDs are complex instruments and come with a high risk of losing money rapidly due to leverage. 70% of retail investor accounts lose money when trading CFDs with this provider. You should consider whether you understand how CFDs work and whether you can afford to take the high risk of losing your money.

BCHUSD H | Bearish Reversal DevelopingBCH/USD has rejected off the sell entry, which is a pullback resistance that is slightly below the 78.6% Fibonacci retracement and could drop from this level to the take profit.
Sell entry is at 566.81, which is a pullback resistance that is slightly below the 78.6% Fibonacci retracement.
Stop loss is at 611.6, which is a pullback resistance.
Take profit is at 507.42, which is a pullback support that aligns with the 61.8% Fibonacci retracement.
Stratos Markets Limited (tradu.com ):
CFDs are complex instruments and come with a high risk of losing money rapidly due to leverage. 68% of retail investor accounts lose money when trading CFDs with this provider. You should consider whether you understand how CFDs work and whether you can afford to take the high risk of losing your money.
Stratos Europe Ltd (tradu.com ):
CFDs are complex instruments and come with a high risk of losing money rapidly due to leverage. 70% of retail investor accounts lose money when trading CFDs with this provider. You should consider whether you understand how CFDs work and whether you can afford to take the high risk of losing your money.

Bearish reversal off Fibonacci confluence?USD/JPY is rising towards the pivot and could reverse to the 1st support, which has been identified as an overlap support.
Pivot: 155.39
1st Support: 151.24
1st Resistance: 158.94
Disclaimer:
The above opinions given constitute general market commentary, and do not constitute the opinion or advice of IC Markets or any form of personal or investment advice.
Any opinions, news, research, analyses, prices, other information, or links to third-party sites contained on this website are provided on an "as-is" basis, are intended only to be informative, is not an advice nor a recommendation, nor research, or a record of our trading prices, or an offer of, or solicitation for a transaction in any financial instrument and thus should not be treated as such. The information provided does not involve any specific investment objectives, financial situation and needs of any specific person who may receive it. Please be aware, that past performance is not a reliable indicator of future performance and/or results. Past Performance or Forward-looking scenarios based upon the reasonable beliefs of the third-party provider are not a guarantee of future performance. Actual results may differ materially from those anticipated in forward-looking or past performance statements. IC Markets makes no representation or warranty and assumes no liability as to the accuracy or completeness of the information provided, nor any loss arising from any investment based on a recommendation, forecast or any information supplied by any third-party.

Bulish bounce off?The Loonie (USD/CAD) has bounced off the pivot, which is a pullback support, and could rise to the 61.8% Fibonacci retracement.
Pivot: 1.3913
1st Suport: 1.3736
1st Resistance: 1.4259
Disclaimer:
The above opinions given constitute general market commentary, and do not constitute the opinion or advice of IC Markets or any form of personal or investment advice.
Any opinions, news, research, analyses, prices, other information, or links to third-party sites contained on this website are provided on an "as-is" basis, are intended only to be informative, is not an advice nor a recommendation, nor research, or a record of our trading prices, or an offer of, or solicitation for a transaction in any financial instrument and thus should not be treated as such. The information provided does not involve any specific investment objectives, financial situation and needs of any specific person who may receive it. Please be aware, that past performance is not a reliable indicator of future performance and/or results. Past Performance or Forward-looking scenarios based upon the reasonable beliefs of the third-party provider are not a guarantee of future performance. Actual results may differ materially from those anticipated in forward-looking or past performance statements. IC Markets makes no representation or warranty and assumes no liability as to the accuracy or completeness of the information provided, nor any loss arising from any investment based on a recommendation, forecast or any information supplied by any third-party.

Bearish reversal off Fibonacci cofluence?The Swissie (USD/CHF) is rising towards the pivot and could reverse to the 1st support, which acts as a pullback support.
Pivot: 0.8159
1st Support: 0.7850
1st Resistance: 0.380
Disclaimer:
The above opinions given constitute general market commentary, and do not constitute the opinion or advice of IC Markets or any form of personal or investment advice.
Any opinions, news, research, analyses, prices, other information, or links to third-party sites contained on this website are provided on an "as-is" basis, are intended only to be informative, is not an advice nor a recommendation, nor research, or a record of our trading prices, or an offer of, or solicitation for a transaction in any financial instrument and thus should not be treated as such. The information provided does not involve any specific investment objectives, financial situation and needs of any specific person who may receive it. Please be aware, that past performance is not a reliable indicator of future performance and/or results. Past Performance or Forward-looking scenarios based upon the reasonable beliefs of the third-party provider are not a guarantee of future performance. Actual results may differ materially from those anticipated in forward-looking or past performance statements. IC Markets makes no representation or warranty and assumes no liability as to the accuracy or completeness of the information provided, nor any loss arising from any investment based on a recommendation, forecast or any information supplied by any third-party.

Bullish bonce off key support?GBP/USD is falling towards the pivot and could bounce to the 1st resistance.
Pivot: 1.3035
1st Support: 1.2807
1st Resistance: 1.330
Disclaimer:
The above opinions given constitute general market commentary, and do not constitute the opinion or advice of IC Markets or any form of personal or investment advice.
Any opinions, news, research, analyses, prices, other information, or links to third-party sites contained on this website are provided on an "as-is" basis, are intended only to be informative, is not an advice nor a recommendation, nor research, or a record of our trading prices, or an offer of, or solicitation for a transaction in any financial instrument and thus should not be treated as such. The information provided does not involve any specific investment objectives, financial situation and needs of any specific person who may receive it. Please be aware, that past performance is not a reliable indicator of future performance and/or results. Past Performance or Forward-looking scenarios based upon the reasonable beliefs of the third-party provider are not a guarantee of future performance. Actual results may differ materially from those anticipated in forward-looking or past performance statements. IC Markets makes no representation or warranty and assumes no liability as to the accuracy or completeness of the information provided, nor any loss arising from any investment based on a recommendation, forecast or any information supplied by any third-party.

Falling towards overlap support?Disclaimer:
The above opinions given constitute general market commentary, and do not constitute the opinion or advice of IC Markets or any form of personal or investment advice.
Any opinions, news, research, analyses, prices, other information, or links to third-party sites contained on this website are provided on an "as-is" basis, are intended only to be informative, is not an advice nor a recommendation, nor research, or a record of our trading prices, or an offer of, or solicitation for a transaction in any financial instrument and thus should not be treated as such. The information provided does not involve any specific investment objectives, financial situation and needs of any specific person who may receive it. Please be aware, that past performance is not a reliable indicator of future performance and/or results. Past Performance or Forward-looking scenarios based upon the reasonable beliefs of the third-party provider are not a guarantee of future performance. Actual results may differ materially from those anticipated in forward-looking or past performance statements. IC Markets makes no representation or warranty and assumes no liability as to the accuracy or completeness of the information provided, nor any loss arising from any investment based on a recommendation, forecast or any information supplied by any third-party.

EURUSD 3-7Nov NFP week. Two gates decide it: 1.1525 and 1.1635If you trade EURUSD only one week at a time, clarity beats prediction. We closed Friday around 1.1535, near the lower edge of the October range. That puts the pair in a simple state. The market is either building a base above 1.1525 and preparing to challenge 1.1635, or it is slipping back into the mid 1.14s where liquidity sits. I am not here to guess. I am here to define the levels, the triggers, and the discipline that keeps the drawdown small while leaving room for upside if momentum appears.
What matters this week
The calendar clusters the real moves around the US session. Expect a faster tape around midweek and into Friday jobs data.
The driver under the hood is still rate spreads. If yields firm and the dollar catches a bid, 1.1525 is the first line of truth.
The plan uses a two gate structure. Lose the lower gate and you trade short toward the next support shelf. Reclaim the upper gate and you trade long toward the next resistance shelf. Between the gates you keep risk tiny or flat.
Levels that define the week
• Support map: 1.1525 then 1.1500 then 1.1450 then 1.1400 to 1.1350
• Resistance map: 1.1575 then 1.1635 then 1.1700 then 1.1760
Plot them on H4 and H1. Add session separators. Shade the October value area if you keep a volume profile. This gives you a visual spine for every decision.
How I will trade it
I treat 1.1525 to 1.1575 as the neutral band. I call it the noise strip. Inside this band I either reduce size to a probe or I do nothing. I want confirmation from the tape before I put real risk on.
Long idea, momentum reclaim
Base above 1.1575 for at least thirty minutes.
Hold above the level through one pullback. The first pullback must find buyers above 1.1560.
Enter long on a clean break and retest that holds, or on a strong close above 1.1600 if the retest never comes.
Initial stop goes below the pullback low or one H4 ATR from entry. If you prefer structure, use 1.1555.
First target is 1.1635. Take partials there. If momentum remains healthy, let a runner work toward 1.1700.
Invalidation is a close back under 1.1575 after entry. If that happens you flatten without debate.
Short idea, downside continuation
Lose 1.1525 on expanding range.
Do not chase the first break. Wait for a retest from below that fails near 1.1525 to 1.1535.
Enter short when the retest stalls and H1 rolls over.
Initial stop above 1.1550 or one H4 ATR from entry.
First target is 1.1500. If that gives way, work the position into 1.1450. Keep a measured pace around 1.1450 to 1.1400 since liquidity often lives there.
Invalidation is a clean close back above 1.1525 after entry.
Position sizing and risk
The metric to respect this week is Return divided by Drawdown. You can call it R over D. Aim for R over D above one on each trade and above one for the week. That means you size entries so that a normal loss on a single attempt costs less than half of the average win to the next level. Use a fixed fraction per trade or a volatility target based on H4 ATR. For most day traders in majors the sweet spot is one half to one percent of account risk per idea. If your first two attempts fail, you cut size in half for the third. This alone keeps you in the game when the band chops you.
Execution windows
London open often sets the day’s path but New York confirms it. I give more trust to signals that survive the US open.
News minutes are not bravery minutes. If you open a new position inside a data bar you accept slippage as the price of impatience. My rule is simple. Ten minutes before a tier one release I stop initiating new risk unless the trade is already well in profit.
The week closes on Friday with higher volatility risk. If you are green, pay yourself. If you are red, do not try to make it back during the last hour.
Common mistakes to avoid
Trading inside the noise strip with full size.
Averaging down inside the strip when the market is waiting for the next data impulse.
Taking profits early at the first ten pips then giving the rest back on a late chase.
Forgetting that levels are areas not single prints. Build a cushion into stops and entries.
Checklist for your chart
H4 and H1 with session separators.
Lines at 1.1525, 1.1575, 1.1635, 1.1700, and the mid 1.14 shelf.
One ATR measure on H4 for dynamic stops.
A simple label on the chart that says R over D target greater than one.
Optional view. A rates panel or at least a ten year yield overlay on a side chart to keep the macro driver in sight.
I will update the levels only if the market prints fresh structure. Until then the plan is to let price prove direction at the gates and to trade only when the proof is there. If you prefer fewer decisions, pick a single gate for the week. Many traders do well with a one side rule. They only trade longs above the upper gate or only trade shorts below the lower gate. That cuts noise and keeps focus tight.
Reminder
Education and analytics only. No advice. No guarantees. Process beats prediction.

Bearish drop off?The Ethereum (ETH/USD) could rise to the pivot and could reverse to the 1st support, which is an overlap support.
Pivot: 4,270.27
1st Support: 3,471.82
1st Resistance: 4,852.38
Disclaimer:
The above opinions given constitute general market commentary, and do not constitute the opinion or advice of IC Markets or any form of personal or investment advice.
Any opinions, news, research, analyses, prices, other information, or links to third-party sites contained on this website are provided on an "as-is" basis, are intended only to be informative, is not an advice nor a recommendation, nor research, or a record of our trading prices, or an offer of, or solicitation for a transaction in any financial instrument and thus should not be treated as such. The information provided does not involve any specific investment objectives, financial situation and needs of any specific person who may receive it. Please be aware, that past performance is not a reliable indicator of future performance and/or results. Past Performance or Forward-looking scenarios based upon the reasonable beliefs of the third-party provider are not a guarantee of future performance. Actual results may differ materially from those anticipated in forward-looking or past performance statements. IC Markets makes no representation or warranty and assumes no liability as to the accuracy or completeness of the information provided, nor any loss arising from any investment based on a recommendation, forecast or any information supplied by any third-party.

Bullish bounce off?The Bitcoin (BTC/USD) has bounced off the pivot, which is a multi-swing low support, and could rise to the 1st resistance.
Pivot: 197,582.22
1st Support: 191,969.5
1st Resistance: 17,384.29
Disclaimer:
The above opinions given constitute general market commentary, and do not constitute the opinion or advice of IC Markets or any form of personal or investment advice.
Any opinions, news, research, analyses, prices, other information, or links to third-party sites contained on this website are provided on an "as-is" basis, are intended only to be informative, is not an advice nor a recommendation, nor research, or a record of our trading prices, or an offer of, or solicitation for a transaction in any financial instrument and thus should not be treated as such. The information provided does not involve any specific investment objectives, financial situation and needs of any specific person who may receive it. Please be aware, that past performance is not a reliable indicator of future performance and/or results. Past Performance or Forward-looking scenarios based upon the reasonable beliefs of the third-party provider are not a guarantee of future performance. Actual results may differ materially from those anticipated in forward-looking or past performance statements. IC Markets makes no representation or warranty and assumes no liability as to the accuracy or completeness of the information provided, nor any loss arising from any investment based on a recommendation, forecast or any information supplied by any third-party.

Potential bullish bounce?AUD/USD is falling towards the support level, which is an overlap support that aligns with the 50% Fibonacci retracement and could bounce from this level to our take profit.
Entry: 0.6525
Why we like it:
There is an overlap support that aligns with the 50% Fibonacci retracement.
Stop loss: 0.6484
Why we like it:
There is a pullback support that aligns with the 78.6% Fibonacci retracement.
Take profit: 0.6606
Why we like it:
There is a multi-swing high resistance level.
Enjoying your TradingView experience? Review us!
Please be advised that the information presented on TradingView is provided to Vantage (‘Vantage Global Limited’, ‘we’) by a third-party provider (‘Everest Fortune Group’). Please be reminded that you are solely responsible for the trading decisions on your account. There is a very high degree of risk involved in trading. Any information and/or content is intended entirely for research, educational and informational purposes only and does not constitute investment or consultation advice or investment strategy. The information is not tailored to the investment needs of any specific person and therefore does not involve a consideration of any of the investment objectives, financial situation or needs of any viewer that may receive it. Kindly also note that past performance is not a reliable indicator of future results. Actual results may differ materially from those anticipated in forward-looking or past performance statements. We assume no liability as to the accuracy or completeness of any of the information and/or content provided herein and the Company cannot be held responsible for any omission, mistake nor for any loss or damage including without limitation to any loss of profit which may arise from reliance on any information supplied by Everest Fortune Group.

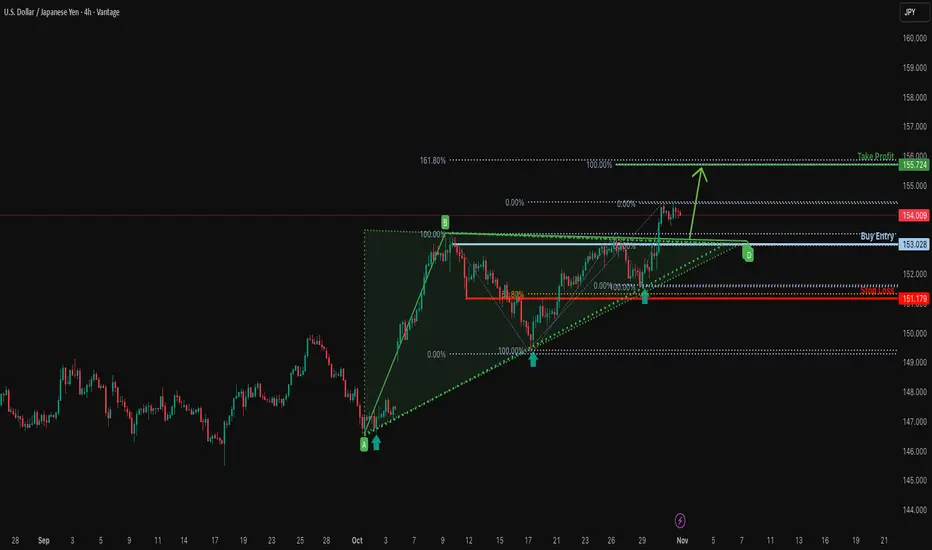
Falling towards pullback support?USD/JPY is falling towards the support level, which is a pullback support that aligns with the 50% Fibonacci retracement and could bounce from this level to our take-profit.
Entry: 153.92
Why we like it:
There is a pullback support that aligns with the 50% Fibonacci retracement.
Stop loss: 151.17
Why we like it:
There is a pullback support that aligns with the 61.8% Fibonacci retracement.
Take profit: 155.72
Why we like it:
There is a resistance level at the 161.8% Fibonacci extension and the 100% Fibonacci projection.
Enjoying your TradingView experience? Review us!
Please be advised that the information presented on TradingView is provided to Vantage (‘Vantage Global Limited’, ‘we’) by a third-party provider (‘Everest Fortune Group’). Please be reminded that you are solely responsible for the trading decisions on your account. There is a very high degree of risk involved in trading. Any information and/or content is intended entirely for research, educational and informational purposes only and does not constitute investment or consultation advice or investment strategy. The information is not tailored to the investment needs of any specific person and therefore does not involve a consideration of any of the investment objectives, financial situation or needs of any viewer that may receive it. Kindly also note that past performance is not a reliable indicator of future results. Actual results may differ materially from those anticipated in forward-looking or past performance statements. We assume no liability as to the accuracy or completeness of any of the information and/or content provided herein and the Company cannot be held responsible for any omission, mistake nor for any loss or damage including without limitation to any loss of profit which may arise from reliance on any information supplied by Everest Fortune Group.
Could we see a bearish reversal from here?USD/CAD is reacting off the resistance level, which is an overlap resistance and could reverse from this level to our take profit.
Entry: 1.4022
Why we like it:
There is an overlap resistance level.
Stop loss: 1.4079
Why we like it:
There is a swing high resistance.
Take profit: 1.3947
Why we like it:
There is an overlap support that aligns with the 61.8% Fibonacci retracement.
Enjoying your TradingView experience? Review us!
Please be advised that the information presented on TradingView is provided to Vantage (‘Vantage Global Limited’, ‘we’) by a third-party provider (‘Everest Fortune Group’). Please be reminded that you are solely responsible for the trading decisions on your account. There is a very high degree of risk involved in trading. Any information and/or content is intended entirely for research, educational and informational purposes only and does not constitute investment or consultation advice or investment strategy. The information is not tailored to the investment needs of any specific person and therefore does not involve a consideration of any of the investment objectives, financial situation or needs of any viewer that may receive it. Kindly also note that past performance is not a reliable indicator of future results. Actual results may differ materially from those anticipated in forward-looking or past performance statements. We assume no liability as to the accuracy or completeness of any of the information and/or content provided herein and the Company cannot be held responsible for any omission, mistake nor for any loss or damage including without limitation to any loss of profit which may arise from reliance on any information supplied by Everest Fortune Group.

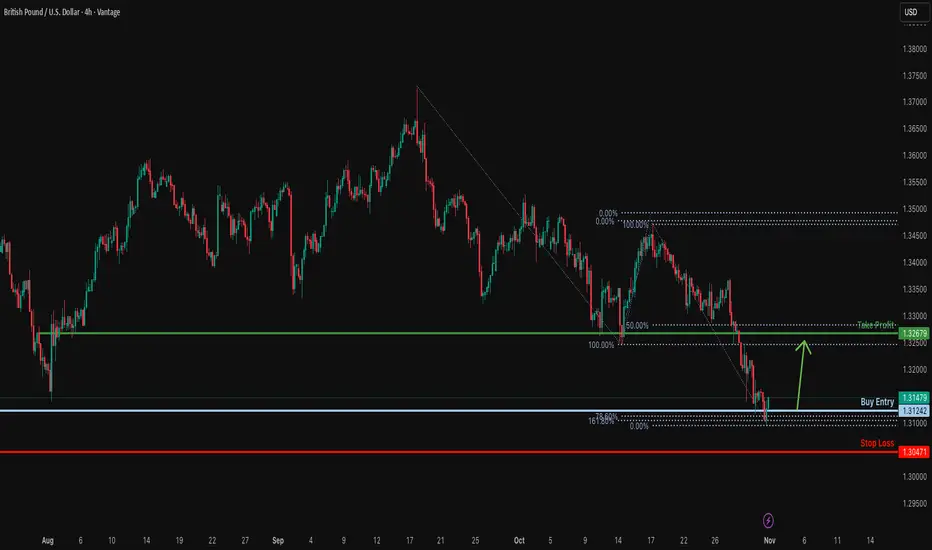
Bullish reversal off Fibonacci confluence?GBP/USD is reacting off the support level, which is a pullback support that is slightly above the 161.8% Fibonacci extension and the 78.6% Fibonacci projection, and could rise from this level to our take profit.
Entry: 1.3124
Why why we like it:
There is a pullback support that is slightly above the 161.8% Fibonacci extension and the 78.6% Fibonacci projection.
Stop loss: 1.3047
Why we like it:
There is a pullback support level.
Take profit: 1.3267
Why we like it:
There is an overlap resistance that is slightly below the 50% Fibonacci retracement.
Enjoying your TradingView experience? Review us!
Please be advised that the information presented on TradingView is provided to Vantage (‘Vantage Global Limited’, ‘we’) by a third-party provider (‘Everest Fortune Group’). Please be reminded that you are solely responsible for the trading decisions on your account. There is a very high degree of risk involved in trading. Any information and/or content is intended entirely for research, educational and informational purposes only and does not constitute investment or consultation advice or investment strategy. The information is not tailored to the investment needs of any specific person and therefore does not involve a consideration of any of the investment objectives, financial situation or needs of any viewer that may receive it. Kindly also note that past performance is not a reliable indicator of future results. Actual results may differ materially from those anticipated in forward-looking or past performance statements. We assume no liability as to the accuracy or completeness of any of the information and/or content provided herein and the Company cannot be held responsible for any omission, mistake nor for any loss or damage including without limitation to any loss of profit which may arise from reliance on any information supplied by Everest Fortune Group.
Hawkish Fed Tone Caps EURUSD Near 1.1580!!Hey Traders, in today’s trading session we’re monitoring EURUSD for a potential selling opportunity around the 1.15800 zone.
The pair remains in a downtrend, and the current correction phase is bringing price back toward the 1.15800 resistance area, aligning with the broader bearish structure.
On the fundamental side, the recent U.S.–China deal combined with Powell’s hawkish tone has reduced the odds of a December rate cut — a setup that continues to favor USD strength and weigh on EURUSD.
Watching for rejection signs near 1.15800 for possible continuation to the downside.
Trade safe,
Joe.

EURUSD: Support & Resistance Analysis For Next Week 🇪🇺🇺🇸
Here is my latest structure analysis and
important supports & resistances for EURUSD for next week.
Consider these structures for pullback/breakout trading.
❤️Please, support my work with like, thank you!❤️
I am part of Trade Nation's Influencer program and receive a monthly fee for using their TradingView charts in my analysis.

Possiblity for euro successful choch This is my first FX analysis.
Dollar might lose some value against euro
This is not financial advice
DOYR
Just my personal speculation

GBPUSD Rejection: Has the Pound Topped Out?GBPUSD Rejection: Has the Pound Topped Out? A Critical Deep Dive for Nov 3-7
Hello, TradingView fam! 👋 The British Pound has had a powerful run, but it has slammed into a wall of sellers, closing the week at a pivotal 1.31440 . The euphoric buying has given way to a sharp rejection from the highs, and a classic bearish reversal pattern is now staring us in the face. Is this the end of the road for the bulls, or just a healthy correction before the next leg up? The week of November 3rd to 7th will be absolutely crucial.
Let's break down the technicals across all timeframes, blending timeless theories with key indicators to map out the opportunities ahead. 🇬🇧🇺🇸
🔭 The Macro Perspective: Weekly & Daily Charts - The Bullish Engine Stalls
The market tells you a story. Your job is to listen.
The higher timeframes show a strong uptrend that has encountered a formidable obstacle, and the bears are beginning to make their presence known.
Weekly Chart (1W) : While the primary trend under Dow Theory is still bullish, the most recent candle is a major cause for concern. We have a textbook Shooting Star ( Japanese Candlestick ), a powerful rejection candle, forming right at a multi-month resistance zone. This indicates that sellers have aggressively defended this level and have overwhelmed the buyers for now.
Daily Chart (1D) : The daily chart confirms the bearish reversal thesis. A potential Double Top pattern has emerged, with the second peak failing to hold. More importantly, there is a clear and significant bearish divergence on the RSI. Price made a higher high, but the RSI made a lower high, signaling a severe exhaustion of bullish momentum.
⚔️ The Swing Trader's Arena: 4-Hour & 1-Hour Analysis
This is where the most compelling evidence for a top is found. A classic and highly reliable reversal pattern has formed.
4-Hour Chart (4H) : This is the money chart for the week ahead. A clear and well-defined Head and Shoulders pattern is now in play. The left shoulder, head, and right shoulder are all visible, and the price is currently sitting directly on the crucial neckline support . A confirmed break and close below this neckline is a high-probability signal for a significant move lower. From a Wyckoff Theory perspective, this represents a completed distribution phase.
1-Hour Chart (1H) : The short-term trend has already flipped bearish. The price has broken decisively below the Ichimoku Cloud and the VWAP, both of which are now acting as dynamic resistance. Any rally back towards the 1.3180-1.3200 area is likely to be viewed as a prime selling opportunity by short-term traders.
🔬 The Intraday Microscope: 30M, 15M, & 5M Views
For intraday traders, the momentum is firmly with the sellers. The strategy is to follow the path of least resistance.
30M/15M Charts : These timeframes show a clear downtrend with a series of lower lows and lower highs. We can see a Bearish Flag pattern forming, which typically represents a brief consolidation before the next wave of selling pressure resumes. The RSI is staying below the 60 mark, indicating bearish control.
5M Chart : On the 5-minute chart, the VWAP is the line in the sand. As long as the price stays below it, shorts are in control. Scalpers should be cautious of any sharp bounces, as they could be bear traps . A sustained break above the VWAP would be the first sign that the intraday selling pressure is easing.
🎯 Actionable Trade Scenarios for the Week Ahead
The technical evidence is heavily skewed towards the bears, hinging on the confirmation of the Head and Shoulders pattern.
The Primary Bearish Breakdown Scenario 🐻
Entry: The highest probability entry is to short a confirmed 4H candle close below the Head and Shoulders neckline, which sits around 1.3100 . A more conservative entry is to wait for a breakdown and then short the retest of the broken neckline as new resistance.
Targets: The first target is the psychological support at 1.3000 . The measured move target for the Head and Shoulders pattern projects a move down towards the major support zone of 1.2920 .
Invalidation: A strong reclaim of the right shoulder's high, specifically a daily close above 1.3220 , would invalidate the bearish setup.
The Low-Probability Bullish Reversal Scenario 🐂
Entry: This is a counter-trend trade. It would require an extremely strong defense of the neckline around 1.3100 , confirmed by a large bullish engulfing candle on the 4H or daily chart.
Targets: A retest of the right shoulder at 1.3200 , and then the recent highs around 1.3280 .
Invalidation: Any confirmed 4H close below the 1.3100 neckline.
Conclusion: The Bears Are Knocking at the Door
The confluence of factors—a weekly rejection candle, daily bearish divergence, and a clear 4H Head and Shoulders pattern—presents a powerful bearish case for GBPUSD. While the bulls could still mount a defense at the neckline, the weight of the technical evidence suggests a breakdown is more likely.
This week is all about confirmation and execution . The plan is set. Now, we wait for the market to give us the signal.
What are your thoughts on Cable? Are you preparing to short the breakdown, or are you buying the dip? Let's discuss in the comments below! 👇
Disclaimer: This analysis is for educational purposes only and should not be considered financial advice. Trading involves significant risk. Always do your own research.
