#038: SHORT Investing Opportunity on NZD/USD
The NZD/USD exchange rate is exhibiting behavior that warrants attention from institutional traders. Hello, I'm Andrea Russo, an independent Forex trader and prop trader with $200,000 in capital under management. Thank you in advance for your time.
After a consolidation phase characterized by progressively higher lows, the market has reached a technical area that historically represents a decision point for directional flow.
In recent sessions, price action has shown a slowdown in the bullish momentum, with small-bodied candles and clear upper wicks, a sign of absorption of buying pressure. At the same time, an increase in intraday volatility has been observed, typical of phases in which liquidity begins to change sides.
Fundamentally, the environment remains fragile for the New Zealand dollar. Expectations of a more accommodative monetary policy from the RBNZ, combined with mixed macroeconomic data, are keeping medium-term sentiment anchored to a cautious outlook. The US dollar, while not showing particular strength, continues to benefit from the rate differential and demand for hedging in times of uncertainty.
From a technical perspective, recent price behavior suggests that the market is seeking liquidity near resistance areas, where pending orders and potential profit-taking by those who have been long in previous weeks are concentrated. This is often where the institutional transition between accumulation and distribution occurs, a prelude to broader directional movements.
Professional traders are closely monitoring the price reaction in this range: a confirmed rejection of the upper range, accompanied by consistent volume, could be an early sign of a return to bearish interest.
J-USD

USD Bullish Reversal Into Resistance - Next Week Is Pivotal The Fed have pushed back on committing to another 25bp cut in December, maintaining a data-dependent stance. Traders will keep a close watch on next week’s ADP employment and ISM reports to gauge the likelihood of a Christmas cut from the Fed. I update my longer-term outlook for the US dollar index and review the FX majors to pick out the strong from the weak.
Matt Simpson, Market Analyst at City Index.

Bullish reversal off major support?The Ethereum (ETH/USD) is reacting off the pivot and could bounce to the 1st resistance.
Pivot: 3,710/52
1st Support: 3,395.28
1st Resistance: 4,063.46
Disclaimer:
The above opinions given constitute general market commentary, and do not constitute the opinion or advice of IC Markets or any form of personal or investment advice.
Any opinions, news, research, analyses, prices, other information, or links to third-party sites contained on this website are provided on an "as-is" basis, are intended only to be informative, is not an advice nor a recommendation, nor research, or a record of our trading prices, or an offer of, or solicitation for a transaction in any financial instrument and thus should not be treated as such. The information provided does not involve any specific investment objectives, financial situation and needs of any specific person who may receive it. Please be aware, that past performance is not a reliable indicator of future performance and/or results. Past Performance or Forward-looking scenarios based upon the reasonable beliefs of the third-party provider are not a guarantee of future performance. Actual results may differ materially from those anticipated in forward-looking or past performance statements. IC Markets makes no representation or warranty and assumes no liability as to the accuracy or completeness of the information provided, nor any loss arising from any investment based on a recommendation, forecast or any information supplied by any third-party.

Could we see a reversal on the Bitcoin?The price is reacting off the pivot which acts as a multi swing low support nd could bounce to the 61.8% Fibonacci resistance.
Pivot: 107,360.16
1st Support: 103,408.67
1st Resistance: 112,683.68
Disclaimer:
The above opinions given constitute general market commentary, and do not constitute the opinion or advice of IC Markets or any form of personal or investment advice.
Any opinions, news, research, analyses, prices, other information, or links to third-party sites contained on this website are provided on an "as-is" basis, are intended only to be informative, is not an advice nor a recommendation, nor research, or a record of our trading prices, or an offer of, or solicitation for a transaction in any financial instrument and thus should not be treated as such. The information provided does not involve any specific investment objectives, financial situation and needs of any specific person who may receive it. Please be aware, that past performance is not a reliable indicator of future performance and/or results. Past Performance or Forward-looking scenarios based upon the reasonable beliefs of the third-party provider are not a guarantee of future performance. Actual results may differ materially from those anticipated in forward-looking or past performance statements. IC Markets makes no representation or warranty and assumes no liability as to the accuracy or completeness of the information provided, nor any loss arising from any investment based on a recommendation, forecast or any information supplied by any third-party.

Bullish bounce off?The Aussie (AUD/USD) has bounced off the pivot and could potentially rise to the 1st resistance, which is an overlap resistance.
Pivot: 0.6539
1st Support: 0.6521
1st Resistance: 0.6581
Disclaimer:
The above opinions given constitute general market commentary, and do not constitute the opinion or advice of IC Markets or any form of personal or investment advice.
Any opinions, news, research, analyses, prices, other information, or links to third-party sites contained on this website are provided on an "as-is" basis, are intended only to be informative, is not an advice nor a recommendation, nor research, or a record of our trading prices, or an offer of, or solicitation for a transaction in any financial instrument and thus should not be treated as such. The information provided does not involve any specific investment objectives, financial situation and needs of any specific person who may receive it. Please be aware, that past performance is not a reliable indicator of future performance and/or results. Past Performance or Forward-looking scenarios based upon the reasonable beliefs of the third-party provider are not a guarantee of future performance. Actual results may differ materially from those anticipated in forward-looking or past performance statements. IC Markets makes no representation or warranty and assumes no liability as to the accuracy or completeness of the information provided, nor any loss arising from any investment based on a recommendation, forecast or any information supplied by any third-party.

Heading into 61.8% Fibonacci resistance?The Fiber (EUR/USD) is rising towards the pivot, which has been identified as an overlap resistance that aligns with the 61.8% Fibonacci retracement and could reverse to the 1st support.
Pivot: 1.1620
1st Support: 1.1541
1st Resistance: 1.6684
Disclaimer:
The above opinions given constitute general market commentary, and do not constitute the opinion or advice of IC Markets or any form of personal or investment advice.
Any opinions, news, research, analyses, prices, other information, or links to third-party sites contained on this website are provided on an "as-is" basis, are intended only to be informative, is not an advice nor a recommendation, nor research, or a record of our trading prices, or an offer of, or solicitation for a transaction in any financial instrument and thus should not be treated as such. The information provided does not involve any specific investment objectives, financial situation and needs of any specific person who may receive it. Please be aware, that past performance is not a reliable indicator of future performance and/or results. Past Performance or Forward-looking scenarios based upon the reasonable beliefs of the third-party provider are not a guarantee of future performance. Actual results may differ materially from those anticipated in forward-looking or past performance statements. IC Markets makes no representation or warranty and assumes no liability as to the accuracy or completeness of the information provided, nor any loss arising from any investment based on a recommendation, forecast or any information supplied by any third-party.

Bearish reversal off pullback resistance?Bitcoin (BTC/USD) is rising towards the pivot and could revert to the first support, which is a swing low support.
Pivot: 111,191.38
1st Support: 104,980.51
1st Resistance: 115,531.59
Disclaimer:
The above opinions given constitute general market commentary, and do not constitute the opinion or advice of IC Markets or any form of personal or investment advice.
Any opinions, news, research, analyses, prices, other information, or links to third-party sites contained on this website are provided on an "as-is" basis, are intended only to be informative, is not an advice nor a recommendation, nor research, or a record of our trading prices, or an offer of, or solicitation for a transaction in any financial instrument and thus should not be treated as such. The information provided does not involve any specific investment objectives, financial situation and needs of any specific person who may receive it. Please be aware, that past performance is not a reliable indicator of future performance and/or results. Past Performance or Forward-looking scenarios based upon the reasonable beliefs of the third-party provider are not a guarantee of future performance. Actual results may differ materially from those anticipated in forward-looking or past performance statements. IC Markets makes no representation or warranty and assumes no liability as to the accuracy or completeness of the information provided, nor any loss arising from any investment based on a recommendation, forecast or any information supplied by any third-party.

US Dollar: Bullish-Neutral. Buys Are Valid As +FVG Holds!Welcome back to the Weekly Forex Forecast for the week of Oct 27 - 31st.
In this video, we will analyze the following FX market: USD Dollar
The USD didn't move a lot last week, but it did move higher with Monday and Tuesday moves. The rest of the week was sideways, but it held above the +FVG. As long as the +FVG holds, prices should continue higher.
A candle body close below the +FVG will be a bearish indication.
Mindful that FOMC is Wednesday. That is decision day for the markets. Don't jump into long term moves until after the announcements for Wednesday.
Enjoy!
May profits be upon you.
Leave any questions or comments in the comment section.
I appreciate any feedback from my viewers!
Disclaimer:
I do not provide personal investment advice and I am not a qualified licensed investment advisor.
All information found here, including any ideas, opinions, views, predictions, forecasts, commentaries, suggestions, expressed or implied herein, are for informational, entertainment or educational purposes only and should not be construed as personal investment advice. While the information provided is believed to be accurate, it may include errors or inaccuracies.
I will not and cannot be held liable for any actions you take as a result of anything you read here.
Conduct your own due diligence, or consult a licensed financial advisor or broker before making any and all investment decisions. Any investments, trades, speculations, or decisions made on the basis of any information found on this channel, expressed or implied herein, are committed at your own risk, financial or otherwise.

Bullish momentum set to continue?USD/JPY is falling towards the support level, which is a pullback support that aligns with the 50% Fibonacci retracement and could bounce from this level to our take profit.
Entry: 153.02
Why we like it:
There is a pullback support that aligns with the 50% Fibonacci retracement.
Stop loss: 151.17
Why we like it:
There is a pullback support level.
Take profit: 155.72
Why we like it:
There is a resistance level at the 161.8% Fibonacci extension and the 100% Fibonacci projection.
Enjoying your TradingView experience? Review us!
Please be advised that the information presented on TradingView is provided to Vantage (‘Vantage Global Limited’, ‘we’) by a third-party provider (‘Everest Fortune Group’). Please be reminded that you are solely responsible for the trading decisions on your account. There is a very high degree of risk involved in trading. Any information and/or content is intended entirely for research, educational and informational purposes only and does not constitute investment or consultation advice or investment strategy. The information is not tailored to the investment needs of any specific person and therefore does not involve a consideration of any of the investment objectives, financial situation or needs of any viewer that may receive it. Kindly also note that past performance is not a reliable indicator of future results. Actual results may differ materially from those anticipated in forward-looking or past performance statements. We assume no liability as to the accuracy or completeness of any of the information and/or content provided herein and the Company cannot be held responsible for any omission, mistake nor for any loss or damage including without limitation to any loss of profit which may arise from reliance on any information supplied by Everest Fortune Group.

Potential bullish bounce off?USD/CHF has bounced off the support level, which is an overlap support that aligns with the 38.2% and 50% Fibonacci retracement, and could bounce from this level to our take profit.
Entry: 0.7981
Why we like it:
There is an overlap support that aligns with the 38.2% and the 50% Fibonacci retracement.
Stop loss: 0.7928
Why we like it:
There is an overlap support that lines up with the 61.8% Fibonacci retracement.
Take profit: 0.8067
Why we like it:
There is a multi-swing high resistance.
Enjoying your TradingView experience? Review us!
Enjoying your TradingView experience? Review us!

Bearish reversal of major resistance?USD/CAD is reacting off the resistance level, which is an overlap resistance that is slightly above the 61.8% Fibonacci retracement and could drop from this level to our take profit.
Entry: 1.4022
Why we like it:
There is an overlap resistance that is slightly above the 61.8% Fibonacci retracement.
Stop loss: 1.4079
Why we like it:
There is a swing high resistance level.
Take profit: 1.3890
Why we like it:
There is an overlap support level.
Enjoying your TradingView experience? Review us!

Potential bearish continuation?EUR/USD is rising towards the resistance level, which is a pullback resistance that aligns with the 61.8% Fibonacci retracement and could reverse from this level to our take profit.
Entry: 1.1601
Why we like it:
There is a pullback resistance that aligns with the 61.8% Fibonacci retracement.
Stop loss: 1.1637
Why we like it:
There is an overlap resistance level.
Take profit: 1.1542
Why we like it:
There is a multi-swing low support level.
Enjoying your TradingView experience? Review us!

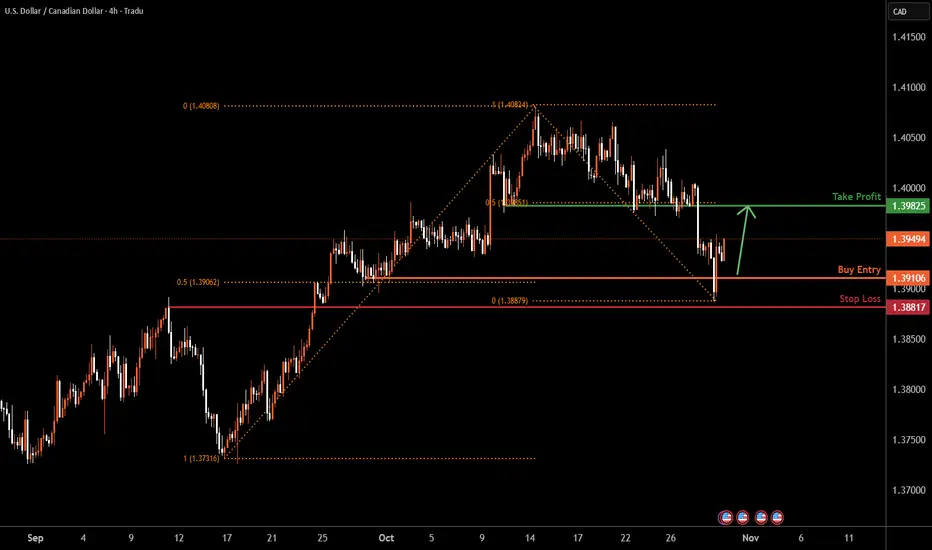
USDCAD H4 | Potential Bullish Bounce Off SupportBased on the H4 chart analysis, we can see that the price has bounced off the buy entry, which is a pullback support that lines up with the 50% Fibonacci retracemnt and could rise from this level to the take profit.
Buy entry is at 1.3910, whichis a pullback support that lines up with the 50% Fibonacci retracement.
Stop loss is at 1.3881, whichis a pullback support.
Take profit is at 1.3982, which s a pullback resistance that lines up with the 50% Fibonacci retracemnt.
Stratos Markets Limited (tradu.com ):
CFDs are complex instruments and come with a high risk of losing money rapidly due to leverage. 68% of retail investor accounts lose money when trading CFDs with this provider. You should consider whether you understand how CFDs work and whether you can afford to take the high risk of losing your money.
Stratos Europe Ltd (tradu.com ):
CFDs are complex instruments and come with a high risk of losing money rapidly due to leverage. 70% of retail investor accounts lose money when trading CFDs with this provider. You should consider whether you understand how CFDs work and whether you can afford to take the high risk of losing your money.
XAUUSD H4 | Bullish Rebound from SupportGold (XAU/USD) has bounced off the buy entry at 3,893.61, which is a pullback support that aligns with the 61.8% Fibonacci retracement and could potentially rise from this level to the take profit.
Stop loss is at 3,794.38, whichis a pullback support that aligns with the 78.6% Fibonacci retracement.
Take profit is at 4,060.49, which is an overlap resistance that lines up with the 38.2% Fibonacci retracement.
Stratos Markets Limited (tradu.com ):
CFDs are complex instruments and come with a high risk of losing money rapidly due to leverage. 68% of retail investor accounts lose money when trading CFDs with this provider. You should consider whether you understand how CFDs work and whether you can afford to take the high risk of losing your money.
Stratos Europe Ltd (tradu.com ):
CFDs are complex instruments and come with a high risk of losing money rapidly due to leverage. 70% of retail investor accounts lose money when trading CFDs with this provider. You should consider whether you understand how CFDs work and whether you can afford to take the high risk of losing your money.

EURUSD Bulls Eye 1.16050 for Fresh BounceHey Traders, in today’s trading session we are monitoring EURUSD for a potential buying opportunity around the 1.16050 zone.
The pair remains in a broader uptrend and is currently in a correction phase, approaching a key support and resistance area at 1.16050.
Structurally, EURUSD has been forming higher highs and higher lows, suggesting that the current retracement could offer another continuation setup within the bullish leg.
Next move: Watching how price reacts near 1.16050 — if bullish momentum builds from this area, we could see a renewed push toward recent highs.

XAGUSD H4 | Bearish Continuation ExpectedXAG/USD is rising towards the sell entry which is an overlap resistance that aligns with the 38.2% Fibonacci retracement and could reverse from this levle to the downside.
Sell entry is at 48.65, whichis an overlap resistance that aligns with the 38.2% Fibonacci retracemnt.
Stop loss is at 49.95, whichis a pullback resistance that aligns withthe 50% Fibonacci retracement.
Take profit is at 45.88, which is a multi swing low support.
Stratos Markets Limited (tradu.com ):
CFDs are complex instruments and come with a high risk of losing money rapidly due to leverage. 68% of retail investor accounts lose money when trading CFDs with this provider. You should consider whether you understand how CFDs work and whether you can afford to take the high risk of losing your money.
Stratos Europe Ltd (tradu.com ):
CFDs are complex instruments and come with a high risk of losing money rapidly due to leverage. 70% of retail investor accounts lose money when trading CFDs with this provider. You should consider whether you understand how CFDs work and whether you can afford to take the high risk of losing your money.

Potential bearish drop?The Gold (XAU/USD) has rejected off the pivot and could drop to the 1st support, which aligns with the 78.6% Fibonacci retracement.
PivotL 4,016.90
1st Support: 3,791.73
1st Resistance: 4,131.50
Disclaimer:
The above opinions given constitute general market commentary, and do not constitute the opinion or advice of IC Markets or any form of personal or investment advice.
Any opinions, news, research, analyses, prices, other information, or links to third-party sites contained on this website are provided on an "as-is" basis, are intended only to be informative, is not an advice nor a recommendation, nor research, or a record of our trading prices, or an offer of, or solicitation for a transaction in any financial instrument and thus should not be treated as such. The information provided does not involve any specific investment objectives, financial situation and needs of any specific person who may receive it. Please be aware, that past performance is not a reliable indicator of future performance and/or results. Past Performance or Forward-looking scenarios based upon the reasonable beliefs of the third-party provider are not a guarantee of future performance. Actual results may differ materially from those anticipated in forward-looking or past performance statements. IC Markets makes no representation or warranty and assumes no liability as to the accuracy or completeness of the information provided, nor any loss arising from any investment based on a recommendation, forecast or any information supplied by any third-party.

Potential bullish reversal?The Loonie (USD/CAD) has bounced off the pivot and could rise to the 1st resistance.
Pivot: 1.3913
1st Support: 1.3864
1st Resistance: 1.3981
Disclaimer:
The above opinions given constitute general market commentary, and do not constitute the opinion or advice of IC Markets or any form of personal or investment advice.
Any opinions, news, research, analyses, prices, other information, or links to third-party sites contained on this website are provided on an "as-is" basis, are intended only to be informative, is not an advice nor a recommendation, nor research, or a record of our trading prices, or an offer of, or solicitation for a transaction in any financial instrument and thus should not be treated as such. The information provided does not involve any specific investment objectives, financial situation and needs of any specific person who may receive it. Please be aware, that past performance is not a reliable indicator of future performance and/or results. Past Performance or Forward-looking scenarios based upon the reasonable beliefs of the third-party provider are not a guarantee of future performance. Actual results may differ materially from those anticipated in forward-looking or past performance statements. IC Markets makes no representation or warranty and assumes no liability as to the accuracy or completeness of the information provided, nor any loss arising from any investment based on a recommendation, forecast or any information supplied by any third-party.

Bullish momentum building?The Swissie (USD/CHF) is reacting off the pivot, which is a pullback suport and oculd bounce to the 1st resistance which has been identified as a swing high resistance.
Pivot: 0.7982
1st Support: 0.7932
1st Resistance: 0.8065
Disclaimer:
The above opinions given constitute general market commentary, and do not constitute the opinion or advice of IC Markets or any form of personal or investment advice.
Any opinions, news, research, analyses, prices, other information, or links to third-party sites contained on this website are provided on an "as-is" basis, are intended only to be informative, is not an advice nor a recommendation, nor research, or a record of our trading prices, or an offer of, or solicitation for a transaction in any financial instrument and thus should not be treated as such. The information provided does not involve any specific investment objectives, financial situation and needs of any specific person who may receive it. Please be aware, that past performance is not a reliable indicator of future performance and/or results. Past Performance or Forward-looking scenarios based upon the reasonable beliefs of the third-party provider are not a guarantee of future performance. Actual results may differ materially from those anticipated in forward-looking or past performance statements. IC Markets makes no representation or warranty and assumes no liability as to the accuracy or completeness of the information provided, nor any loss arising from any investment based on a recommendation, forecast or any information supplied by any third-party.

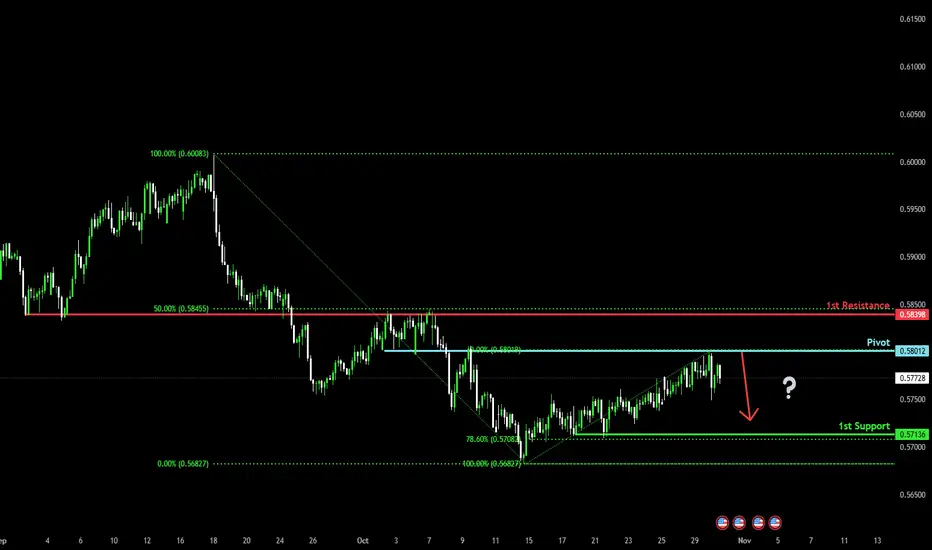
Bearish drop off?The Kiwi (NZD/USD) has rejected off the pivot which is an overlap resistance and cold drop to the 78.6% Fibonacci support.
Pivot: 0.5801
1st Suport: 0.5713
1st Resistance: 0.5839
Disclaimer:
The above opinions given constitute general market commentary, and do not constitute the opinion or advice of IC Markets or any form of personal or investment advice.
Any opinions, news, research, analyses, prices, other information, or links to third-party sites contained on this website are provided on an "as-is" basis, are intended only to be informative, is not an advice nor a recommendation, nor research, or a record of our trading prices, or an offer of, or solicitation for a transaction in any financial instrument and thus should not be treated as such. The information provided does not involve any specific investment objectives, financial situation and needs of any specific person who may receive it. Please be aware, that past performance is not a reliable indicator of future performance and/or results. Past Performance or Forward-looking scenarios based upon the reasonable beliefs of the third-party provider are not a guarantee of future performance. Actual results may differ materially from those anticipated in forward-looking or past performance statements. IC Markets makes no representation or warranty and assumes no liability as to the accuracy or completeness of the information provided, nor any loss arising from any investment based on a recommendation, forecast or any information supplied by any third-party.
ETHUSD H1 | Bearish Momentum Building UpBased on the H1 chart analysis, we can see that the price has rejected off the sell entry at 3,987.68, which is a pullback resistance that aligns with the 38,2% Fibonacci retracement and could drop from this levle to the downside.
Stop loss is at 4,144.26, whichis a pullback resistance that is slightly below the 78.6% Fibonacci retracement.
Take profit is at 3,744.29, whichis a swing low support.
Stratos Markets Limited (tradu.com ):
CFDs are complex instruments and come with a high risk of losing money rapidly due to leverage. 68% of retail investor accounts lose money when trading CFDs with this provider. You should consider whether you understand how CFDs work and whether you can afford to take the high risk of losing your money.
Stratos Europe Ltd (tradu.com ):
CFDs are complex instruments and come with a high risk of losing money rapidly due to leverage. 70% of retail investor accounts lose money when trading CFDs with this provider. You should consider whether you understand how CFDs work and whether you can afford to take the high risk of losing your money.

LTCUSD H4 | Bullish Bounce Off Pullback SupportLTC/USD has bounced off the buy entry which is a pullback support that aligns with he 50% Fibonacci retracemnt and could rise from this level to the upside.
Buy entry is at 96.09, which is a pullback support that aligns with he 50% Fibonacci retracemnt.
Stop loss is at 84.76, which is a swing low support.
Take profit is at 115.31, whichis a pullback resistance that aligns with the 61.8% Fibonacci retracemnt.
Stratos Markets Limited (tradu.com ):
CFDs are complex instruments and come with a high risk of losing money rapidly due to leverage. 68% of retail investor accounts lose money when trading CFDs with this provider. You should consider whether you understand how CFDs work and whether you can afford to take the high risk of losing your money.
Stratos Europe Ltd (tradu.com ):
CFDs are complex instruments and come with a high risk of losing money rapidly due to leverage. 70% of retail investor accounts lose money when trading CFDs with this provider. You should consider whether you understand how CFDs work and whether you can afford to take the high risk of losing your money.

SOLUSD H4 | Bearish Drop-Off in MomentumSOL/USD has rejected off the sell entry which is an overlap resistance that aligns with the 50% Fibonacci retracemnt and could drop from this level to the downside.
Sell entry is at 204.97, whichis an overlap resistance that aligns with the 50% Fibonacci retracemnt.
Stop loss is at 221.25, whichis a pullback resistance that is slightly below the 78.6% Fibonacci retracement.
Take profit is at 174.91, whichis a swing low support.
Stratos Markets Limited (tradu.com ):
CFDs are complex instruments and come with a high risk of losing money rapidly due to leverage. 68% of retail investor accounts lose money when trading CFDs with this provider. You should consider whether you understand how CFDs work and whether you can afford to take the high risk of losing your money.
Stratos Europe Ltd (tradu.com ):
CFDs are complex instruments and come with a high risk of losing money rapidly due to leverage. 70% of retail investor accounts lose money when trading CFDs with this provider. You should consider whether you understand how CFDs work and whether you can afford to take the high risk of losing your money.
