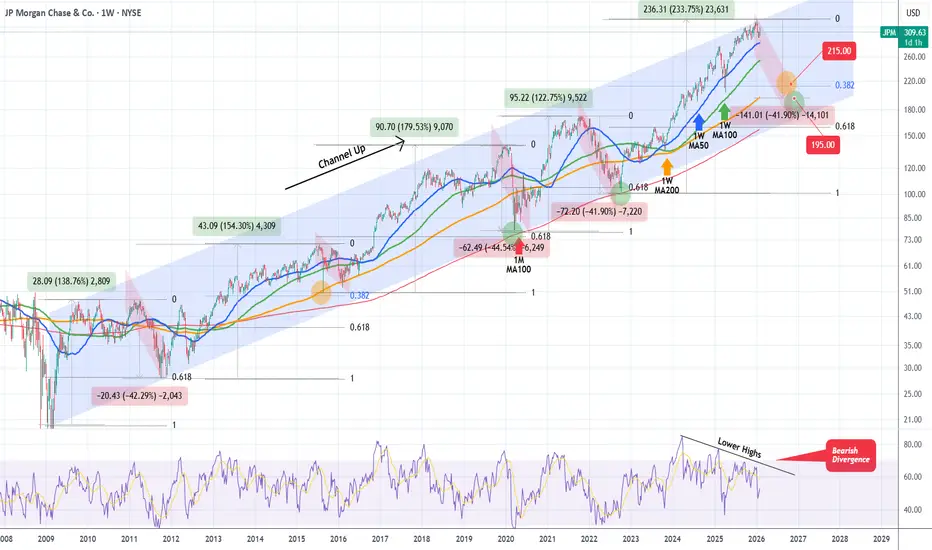
JP MORGAN topped on its 17-year Channel Up. Bear Cycle started.JP Morgan Chase (JPM) has been trading within a 17-year Channel Up since the March 2009 market bottom of the U.S. Housing Crisis. Last month the price hit the exact top of that multi-year pattern and got rejected. Despite the recent rebound, we expect that to be short-lived, as it's not just the Head and Shoulders (H&S) pattern that is being formed but that Channel Up Top alone calls for a strong, potentially 1-year long Bear Cycle.
Such have historically been most major corrections within this pattern, with the last two (2022 Inflation Crisis and 2020 COVID crash) bottomed near the 1M MA100 (red trend-line), which is the utmost long-term Support and the before (2015) bottoming on the 1W MA200 (orange trend-line).
With the 1W RSI currently on a huge Bearish Divergence (Lower Highs against price's Higher Highs) since March 2024, we expect the stock to drop to at least $215.00, which like 2015 will make contact with both the 1W MA200 and the 0.382 Fibonacci retracement level. At most, if the market repeats the -41.90% decline of 2022, we expect it to hit $195.00 just above the 1M MA100.
A deeper correction (which is quite unlikely based on the current fundamentals) would see JPM target the 0.618 Fib, which is where the 2022 and 2020 corrections bottomed, at $160.00.
---
** Please LIKE 👍, FOLLOW ✅, SHARE 🙌 and COMMENT ✍ if you enjoy this idea! Also share your ideas and charts in the comments section below! This is best way to keep it relevant, support us, keep the content here free and allow the idea to reach as many people as possible. **
---
💸💸💸💸💸💸
👇 👇 👇 👇 👇 👇
Jpmorgan
JPM JP Morgan Chase 1Y Chart Review - RSI focus pointToday you can review the technical analysis idea on a 1Y linear scale chart for JP Morgan Chase Bank (JPM).
It seems there is some action going on here with JPM reviewing the RSI and the ATH. This may be a concern.
If you enjoy my ideas, feel free to like it and drop in a comment. I love reading your comments below.
Disclosure: This is just my opinion and not any type of financial advice. I enjoy charting and discussing technical analysis. Don't trade based on my advice. Do your own research! #millionaireeconomics #JPM

Paper silver = $0, physical silver = to the moon and beyond!!!!What majority of idea's here are completely oblivious of and not mentioning. COMEX and JPM are out of physical silver. Once deliveries cease and they force contracts to settle in cash the entire system will collapse!

BTCUSDT - Range-Bound at $87KExecutive Summary
BINANCE:BTCUSDT is trading at approximately $87,740 after a turbulent 2025 that saw Bitcoin hit an all-time high of $126,272 in October before correcting 30%. The price is now stuck in a tight consolidation range between $85,000 support and $90,000 resistance. While short-term metrics show slight recovery (+1.5% weekly, +3.53% monthly), the bigger picture is concerning: YTD performance is -6.25%, and multiple on-chain indicators suggest we may be entering a late-cycle distribution phase with bear market risk in early 2026.
BIAS: NEUTRAL TO SLIGHTLY BEARISH - Bullish Potential with Bearish Undertones
The short-term structure allows for bullish breakout, but the weight of on-chain evidence and macro factors lean bearish for Q1 2026. Trade the range, respect the levels.
Current Market Context - December 23, 2025
Bitcoin finds itself at a critical juncture:
Current Price: $87,825.99 (-0.99% on the day)
Day's Range: $86,601.90 - $88,940.00
52-Week Range: $74,508.00 - $126,199.63
All-Time High: $126,272.76 (October 6, 2025)
Volume: 9.22K (below 30D average of 17.23K)
Down 30.06% from ATH
Performance Metrics - MIXED:
1 Week: +1.50% (Green)
1 Month: +3.53% (Green)
3 Months: -21.67% (Red)
6 Months: -18.27% (Red)
YTD: -6.25% (Red)
1 Year: -7.83% (Red)
The short-term green metrics mask a deeply concerning longer-term picture. Bitcoin is underperforming its 2024 and 2023 seasonal patterns significantly.
THE WARNING SIGNS - 5 Charts Suggest Bear Market Risk
Multiple on-chain and market-structure indicators are flashing caution:
1. Bitcoin's Apparent Demand Growth Is Rolling Over
Demand growth slowing after multiple waves earlier in the cycle
While price remained elevated through 2025, demand failed to make new highs
This divergence indicates price strength relied more on momentum and leverage than fresh spot buying
When demand growth flattens while price stays high, markets shift from accumulation to distribution
This often marks early stages of a bear market or long consolidation
2. US Spot Bitcoin ETF Inflows Are Losing Momentum
ETFs have been the strongest source of structural demand this cycle
In 2024, ETF inflows accelerated steadily into year-end
Q4 2025 shows inflows flattening and, in some periods, declining
ETFs represent long-term capital, not short-term trading
When ETF demand slows while price remains high, large buyers are stepping back
Without sustained institutional inflows, Bitcoin becomes more vulnerable to derivatives-driven volatility
3. Dolphin Wallets (100-1,000 BTC) Are Reducing Exposure
"Dolphins" are typically sophisticated investors and funds
Sharp decline in dolphin holdings on a one-year basis
Similar behavior appeared in late 2021 and early 2022, ahead of deeper drawdowns
This points to risk reduction by experienced holders
When this cohort distributes while price remains elevated, it reflects expectations of lower returns ahead
4. Funding Rates Are Trending Lower Across Exchanges
Funding rates measure cost to hold leveraged positions
Clear downward trend across major exchanges
Indicates waning demand for leverage even as price remains relatively high
In bull markets, strong rallies are supported by rising funding and persistent long demand
Falling funding rates suggest traders are less confident and less willing to pay to stay long
This environment often precedes choppy price action or broader trend reversals
5. Bitcoin Broke Below the 365-Day Moving Average
The 365-day MA historically separates bull markets from bear markets
Bitcoin has now crossed below this level for the first sustained period since early 2022
Previous macro-driven sell-offs in 2024 and early 2025 tested this level but failed to close below it
A sustained break signals a shift in long-term momentum
Increases probability that rallies will face stronger resistance
CRITICAL: None of these signals confirms a full bear market alone. Together, they suggest rising downside risk and weakening support.
How Low Could Bitcoin Go?
If bear market develops:
Bitcoin's realized price is currently near $56,000 (average cost basis of all holders)
In prior bear markets, Bitcoin often bottomed near or slightly below this level
This doesn't mean Bitcoin must fall to $56,000
But in a full bear scenario, long-term buyers historically step in closer to that zone
Wide range of outcomes possible, including prolonged sideways movement rather than sharp decline
THE BULL CASE - Wall Street Is Coming
Despite the warning signs, major bullish catalysts are emerging:
JPMorgan Exploring Crypto Trading
Largest US bank considering crypto trading services for institutional clients
Assessing spot and derivatives trading products
Would represent major evolution for JPMorgan
CEO Jamie Dimon has been critical of Bitcoin but bank is expanding blockchain activity
In May, Dimon said JPMorgan would allow clients to buy Bitcoin
Bank launched tokenized money-market fund (MONY) on Ethereum with $100M initial capital
Arranged short-term bond for Galaxy Digital on Solana blockchain
Wall Street's Broader Embrace
Morgan Stanley offering crypto trading on E*Trade platform (H1 2026)
Charles Schwab ($11.6 trillion firm) launching Bitcoin trading (H1 2026)
20% of Schwab clients already own crypto
Growing institutional demand as regulatory frameworks clarify
Trump administration pledged to make America "crypto capital of the world"
JPMorgan Analysts' Price Target
JPMorgan analysts projected Bitcoin could climb to $170,000 within 6-12 months
Contingent on perpetual futures deleveraging completing
Global crypto market valued at ~$3.1 trillion
Bitcoin accounts for ~$1.8 trillion
Projected to reach new ATH next year as adoption grows
Arizona Crypto-Friendly Legislation
Senator Wendy Rogers proposed bills to exempt virtual currency from taxation
SB 1044: Exempt crypto from state taxation
SB 1045: Bar cities/counties from taxing blockchain nodes
SCR 1003: Amend constitution to exclude crypto from property tax
Arizona already has digital asset reserve law
Other states (New Hampshire, Texas) have similar laws
Technical Structure Analysis
Price Action Overview - 4 Hour Timeframe
The chart shows a clear consolidation structure:
Current Range:
MAJOR RESISTANCE: $89,000-$90,500 zone
SUPPORT: $86,600-$87,200 zone
Price oscillating between these levels
Multiple tests of both zones without sustained follow-through
Neither bulls nor bears have full control
Equilibrium state - buyers step in near support, sellers defend resistance
Recent Price Action:
Sharp rejection from ~$90,500 area
Price dropped to current ~$87,740 level
Testing mid-range support
Two scenarios visible on chart:
Bullish: Break above resistance toward $89,000+
Bearish: Break below support toward $85,000
Key Observations:
Volume below 30-day average (9.22K vs 17.23K) - thin liquidity
Range-bound trading suggests indecision
Breakout direction will determine next major move
Holiday period typically sees lower liquidity, amplifying moves
Key Support and Resistance Levels
Resistance Levels:
$88,940 - Day's high / immediate resistance
$89,000-$90,500 - MAJOR RESISTANCE ZONE
$92,000-$93,000 - Secondary resistance (breakout target)
$95,000 - Psychological level
$100,000 - Major psychological barrier
$126,272 - All-time high (October 2025)
Support Levels:
$87,200 - Immediate support
$86,600-$87,000 - MAJOR SUPPORT ZONE
$85,000 - Critical support (strong demand in early December)
$82,000-$83,000 - Secondary support
$74,508 - 52-week low
$56,000 - Realized price (bear market bottom zone)
Chart Pattern Analysis
Current structure shows a consolidation rectangle :
Clear horizontal support at $86,600-$87,200
Clear horizontal resistance at $89,000-$90,500
Price compressing within this range
Breakout imminent - direction TBD
Volume declining during consolidation (typical)
Watch for volume spike on breakout for confirmation
Moving Average Analysis
Price trading BELOW 365-day moving average - bearish signal
This is first sustained break below 365 MA since early 2022
Short-term MAs may be providing temporary support
Long-term trend structure has weakened significantly
Rallies likely to face resistance at declining MAs
Volume Analysis
Current volume: 9.22K (significantly below 30D average of 17.23K)
Thin liquidity environment
Low volume consolidation typical before breakouts
Holiday period reducing participation
Watch for volume confirmation on any breakout
Low volume moves are less reliable
Market Structure Assessment
Current State:
Range-bound with thin liquidity
High sensitivity to leverage-driven moves
Retail participation appears cautious
Institutional flows have slowed
Selling pressure primarily retail-driven from leveraged and short-term participants
US spot Bitcoin ETF holdings declined less than 5% despite 30%+ drawdown - institutions holding
Expert Analysis - Ray Youssef (NoOnes CEO):
"BTC's upside is now tied to liquidity expansion, sovereign policy clarity, and risk sentiment, rather than to monetary debasement alone."
"From a market-structure perspective, Bitcoin remains stuck in a compressing, range-bound action bout."
Bitcoin has failed to deliver on its hedge narrative in 2025, demonstrating heightened sensitivity to macroeconomic factors rather than trading like digital gold.
SCENARIO ANALYSIS
BULLISH SCENARIO - Breakout Above $90,000
Trigger Conditions:
Daily close above $90,500 with volume
ETF inflows resume/accelerate
JPMorgan or other major bank announces crypto trading launch
Positive regulatory news
Break above 365-day MA
Price Targets if Bullish:
Target 1: $92,000-$93,000 - First resistance above range
Target 2: $95,000 - Psychological level
Target 3: $100,000 - Major psychological barrier
Extended: $170,000 (JPMorgan analyst target for 2026)
Bullish Catalysts:
JPMorgan crypto trading launch
Morgan Stanley E*Trade crypto (H1 2026)
Charles Schwab Bitcoin trading (H1 2026)
Arizona crypto tax exemption bills
Trump administration pro-crypto policies
ETF inflow recovery
Institutional adoption acceleration
BEARISH SCENARIO - Breakdown Below $85,000
Trigger Conditions:
Daily close below $85,000
ETF outflows accelerate
Funding rates continue declining
Dolphin wallets continue distributing
Break below 365-day MA confirmed
Macro risk-off event
Price Targets if Bearish:
Target 1: $82,000-$83,000 - Secondary support
Target 2: $74,508 - 52-week low
Target 3: $65,000-$70,000 - Major support zone
Bear Market Bottom: $56,000 area (realized price)
Bearish Risks:
5 on-chain indicators warning of bear market
Below 365-day MA for first time since 2022
Demand growth rolling over
ETF inflows losing momentum
Dolphin wallets reducing exposure
Funding rates trending lower
YTD performance negative (-6.25%)
30% down from ATH
NEUTRAL SCENARIO - Continued Range Trading
Most likely short-term outcome:
Price continues oscillating between $85,000-$90,000
Low volume holiday trading
Wait for January 2026 for directional clarity
Institutions reassess positions in new year
Watch for ETF flow data in early January
MY ASSESSMENT - NEUTRAL TO SLIGHTLY BEARISH
The evidence is genuinely mixed, but the weight leans bearish:
Bearish Factors (Dominant):
5 on-chain indicators warning of distribution phase
Below 365-day MA - historically bearish
Demand growth diverging from price
ETF inflows slowing
Sophisticated holders (dolphins) reducing exposure
Funding rates declining
YTD, 3M, 6M, 1Y all negative
30% down from ATH with no recovery momentum
Bullish Factors (Secondary):
Wall Street adoption accelerating (JPMorgan, Morgan Stanley, Schwab)
Pro-crypto regulatory environment under Trump
Arizona tax exemption bills
JPMorgan $170K price target
Institutions holding ETF positions despite drawdown
Short-term metrics slightly positive
My Stance: NEUTRAL with Bearish Lean
I believe the path of least resistance is sideways to down in Q1 2026. The on-chain data is too concerning to ignore. However, Wall Street adoption could provide a floor and eventually drive recovery.
Strategy:
Trade the range - buy support, sell resistance
Don't get caught in the middle
Respect $85,000 as critical support
Respect $90,000 as critical resistance
Wait for breakout confirmation before directional bets
Reduce position size given uncertainty
Trade Framework
Scenario 1: Bullish Breakout Trade
Entry Conditions:
4H candle closes above $90,500
Volume exceeds recent average
ETF inflows positive
Trade Parameters:
Entry: $90,500-$91,000 on confirmed breakout
Stop Loss: $88,000 below recent support
Target 1: $93,000 (Risk-Reward ~1:1)
Target 2: $95,000 (Risk-Reward ~1:1.8)
Target 3: $100,000 (Extended)
Scenario 2: Range Trade - Buy Support
Entry Conditions:
Price tests $86,600-$87,200 support zone
Bullish rejection candle
Volume spike on bounce
Trade Parameters:
Entry: $86,800-$87,200 at support
Stop Loss: $85,500 below support zone
Target 1: $89,000 (Risk-Reward ~1:1.5)
Target 2: $90,500 (Risk-Reward ~1:2.5)
Scale out at resistance
Scenario 3: Bearish Breakdown Trade
Entry Conditions:
4H candle closes below $85,000
Volume confirmation
ETF outflows accelerating
Trade Parameters:
Entry: $84,500-$85,000 on confirmed breakdown
Stop Loss: $87,500 above recent support
Target 1: $82,000 (Risk-Reward ~1:1)
Target 2: $78,000 (Risk-Reward ~1:2.5)
Target 3: $74,500 (52-week low)
Risk Management Guidelines
Position sizing: 1-2% max risk per trade (reduced due to uncertainty)
Thin liquidity = amplified moves - use wider stops
Holiday period trading - expect erratic price action
Watch ETF flow data closely
Monitor on-chain metrics for trend confirmation
Don't fight the range - trade within it
Scale out at targets rather than all-or-nothing
Be prepared for extended consolidation
Invalidation Levels
Bullish thesis invalidated if:
Price closes below $85,000 on daily timeframe
ETF outflows accelerate significantly
Funding rates go deeply negative
Dolphin distribution accelerates
Break below 52-week low ($74,508)
Bearish thesis invalidated if:
Price closes above $93,000 with volume
ETF inflows surge
Reclaim 365-day moving average
JPMorgan announces crypto trading launch
Major institutional adoption news
Conclusion
BINANCE:BTCUSDT is at a critical juncture. After hitting an all-time high of $126,272 in October 2025, Bitcoin has corrected 30% and is now stuck in a consolidation range between $85,000 and $90,000.
The Concerning Data:
5 on-chain indicators warning of potential bear market in 2026
Below 365-day MA for first time since 2022
Demand growth diverging from price
ETF inflows losing momentum
Sophisticated holders reducing exposure
YTD: -6.25%, 3M: -21.67%, 6M: -18.27%
The Hopeful Data:
JPMorgan exploring crypto trading
Morgan Stanley, Charles Schwab launching crypto in H1 2026
Arizona crypto tax exemption bills
JPMorgan analysts target $170,000
Institutions holding ETF positions despite drawdown
Key Levels:
$90,000-$90,500 - MAJOR RESISTANCE (breakout level)
$86,600-$87,200 - MAJOR SUPPORT (current test)
$85,000 - CRITICAL SUPPORT (must hold)
$70,000 - Realized price (bear market bottom zone)
The Setup:
Bitcoin is range-bound with thin liquidity. The on-chain data suggests we may be in a late-cycle distribution phase with bear market risk in early 2026. However, Wall Street adoption is accelerating, which could provide a floor.
Strategy:
Trade the range - don't predict the breakout
Buy $86,600-$87,200 support with stops below $85,000
Sell $89,000-$90,500 resistance
Wait for confirmed breakout before directional bets
Reduce position size given mixed signals
Watch January 2026 for clarity
The market is at a decision point. Let price action guide you, not predictions.

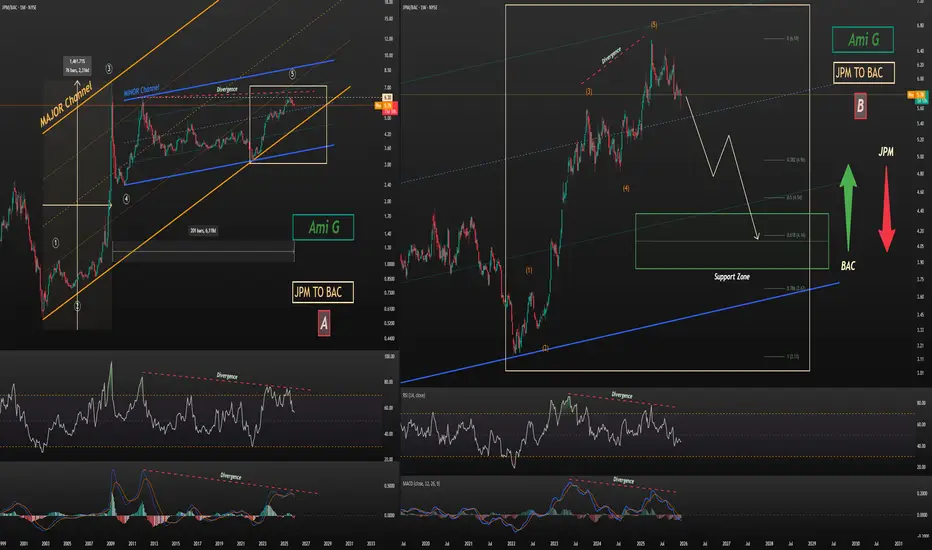
JPM vs BAC — Relative CheckRelative Analysis: JPMorgan vs Bank of America
Chart A (Monthly):
Over the past 8 years, JPMorgan has significantly outperformed Bank of America, completing a 3-wave Elliott structure and entering its Wave 4 correction, which has lasted 201 weeks. Price is currently contained within two major channels: the impulse (major) and a minor corrective channel.
Chart B (Weekly):
On the weekly chart, JPMorgan recently completed a 5-wave impulse in its last move and is now in a corrective phase. While the monthly supercycle Wave 5 does not appear fully complete, the relative chart indicates that Bank of America is likely to outperform JPMorgan over the next 1–2 years.
Conclusion / Implications:
During bullish phases → Bank of America may experience larger gains
During corrections → JPMorgan may face larger declines
Note: This is my personal analysis. I’d be happy to hear your thoughts!
Follow me on TradingView for more analyses and live stock trades.
NYSE:JPM
NYSE:BAC
Copper price predictions from Wall Street Citi forecasts copper reaching USD 13,000 per tonne in early 2026, with a potential move to USD 15,000 by the second quarter, driven by energy transition and AI related demand.
ING also expects higher prices, with its outlook targeting USD 12,000 per tonne in the second quarter of next year.
Deutsche Bank points to supply constraints as a key driver, describing 2025 as a highly disrupted year for mining. The bank sees the market in clear deficit, with the tightest conditions in late 2025 and early 2026, and peak prices in the first half of 2026.
J.P. Morgan thinks demand from China will eventually come into play, too, noting signs of growing pressure on smelters to secure raw material. The bank expects prices to reach USD 12,500 per tonne in the second quarter of 2026, averaging around USD 12,075 for the year.

JPMorgan Chase (NYSE: $JPM) UK Expansion Signals Strong OutlookJPMorgan Chase (NYSE: NYSE:JPM ) is reinforcing its long-term commitment to the UK with a landmark plan to build a new three-million-square-foot headquarters in Canary Wharf. The proposed Riverside Tower, designed by Foster + Partners, will accommodate up to 12,000 employees and serve as the bank’s primary UK base. The six-year project highlights JPMorgan’s confidence in London’s role as a global financial powerhouse despite broader economic uncertainty.
The development includes sustainable infrastructure, public parkland, and improved transportation links, strengthening both workplace experience and community value. An independent study projects the new HQ could contribute £9.9 billion to the UK economy over the construction period. Additionally, an estimated 7,800 jobs are expected across construction, design, engineering, and related fields. JPMorgan’s existing operations already generate £7.5 billion annually for the local economy, reaffirming its status as one of London’s most influential financial institutions.
While construction progresses, JPMorgan will upgrade its 25 Bank Street location to maintain high workplace standards. The company will also remain active in its 60 Victoria Embankment and One Cabot Square offices, preserving stability for employees and clients.
Technical Outlook:
JPMorgan Chase maintains a broadly bullish technical structure. Price action has consistently respected a long-term ascending trendline, confirming strong institutional demand. Immediate support is marked at $258, a level where buyers may hold if price retraces lower before continuation.
A sustained hold above this zone may lead to continuation toward higher levels. The next major resistance sits at the $300 psychological barrier, a level that could trigger breakout momentum if cleared. Trendline strength and rising investor confidence support the bullish bias as the UK expansion enhances long-term fundamentals.

JP Morgan says EURCHF oversold --- Could target 0.96 on rebound?JP Morgan sees the surge in the Swiss franc as not justified. According to JP Morgan, the Eurozone economy is holding up better than markets had anticipated. Under this environment, JP Morgan believes the current EUR/CHF levels present an opportunity to fade franc strength and rebuild long positions.
If the pair does rebound from current levels, the first area of interest could be 0.9350, followed by 0.9450, where prior swing highs and short-term structure converge. A more sustained recovery could bring the pair back toward 0.9600–0.9700, a major resistance band that has capped every rally over the past year.

JPMorgan( $JPM) Gains on New Paid Fintech Data DealsJPMorgan Chase & Co. (JPM) has reached a series of landmark agreements requiring fintech companies to pay for access to customer bank-account data, marking a major shift in how financial data is shared across the U.S. banking ecosystem.
For years, data aggregators such as Plaid, Yodlee, Morningstar, and Akoya accessed JPMorgan customer data for free, enabling popular fintech apps to offer budgeting tools, payments, and portfolio tracking. Banks have long argued this model was unfair and risky, raising concerns over data privacy, security, and uncompensated use of bank infrastructure.
JPMorgan spokesperson Drew Pusateri confirmed the new paid arrangements, calling them a step toward a safer and more sustainable open-banking framework. The deals were finalized after weeks of negotiation, with JPMorgan reportedly settling for lower fees than initially proposed. In return, aggregators secured concessions on how data requests are processed and stored.
These agreements come as the CFPB’s updated “open banking” rule continues to reshape the data-sharing landscape. Introduced last year, the rule allows consumers to move financial data freely at no cost, sparking pushback from banks but support from fintechs and crypto-adjacent firms. After industry pressure, regulators began revising the rule earlier this year.
For JPMorgan, the new paid model could generate a fresh revenue stream while tightening oversight on third-party data access. It also positions the bank strategically as demand grows for secure data connectivity across fintech platforms.
Technical Outlook: JPM Eyes Bounce Toward $350
JPM has pulled back from recent highs and is now approaching a major support zone around $280, which previously acted as a breakout level. If the stock retests this area and holds, the structure favors a strong upside continuation.
A rebound from support could send JPM back toward $330 and $350, aligning with the stock external bullish trend.

JP MORGAN eyes a potential correction to $210 at least.JP Morgan Chase (JPM) has been trading within a Channel Up since the 2009 bottom of the Housing Crisis. Throughout its course, it has posted 5 strong Bullish Legs, with the current one being the strongest (+221% so far). The result of its strength is the price being exactly at the top (Higher Highs trend-line) of the Channel.
With the 1M RSI extremely overbought and on its highest level since February 2018, the pattern may have reached its upper limit and could be calling for a technical correction. This correction should be in the form of a long-term Bear Cycle (Bearish Leg). Out of the 4 previous Bearish Legs, 3 pulled-back to their 0.618 Fibonacci retracement levels, while 1 to its 0.382 (Fib). That was the only one that found Support on the 1W MA50 (blue trend-line), while the most recent two bottomed on the 1M MA100 (green trend-line).
Note also that 3 of those corrections dropped by around the same %, with the 'weakest' being -41.90% (also the most recent in 2022).
As a result, if JPM has indeed priced its new Top (Channel Up Higher High) currently, a minimum correction to the 0.382 Fib would target $210, while a -41.90% (also minimum) drop would test $190. The latter would also potentially made an ideal contact with the 1M MA100. A 0.618 Fib correction would be at $158, but also below the Channel Up, unless executed very violently, which makes it a less realistic scenario.
---
** Please LIKE 👍, FOLLOW ✅, SHARE 🙌 and COMMENT ✍ if you enjoy this idea! Also share your ideas and charts in the comments section below! This is best way to keep it relevant, support us, keep the content here free and allow the idea to reach as many people as possible. **
---
💸💸💸💸💸💸
👇 👇 👇 👇 👇 👇

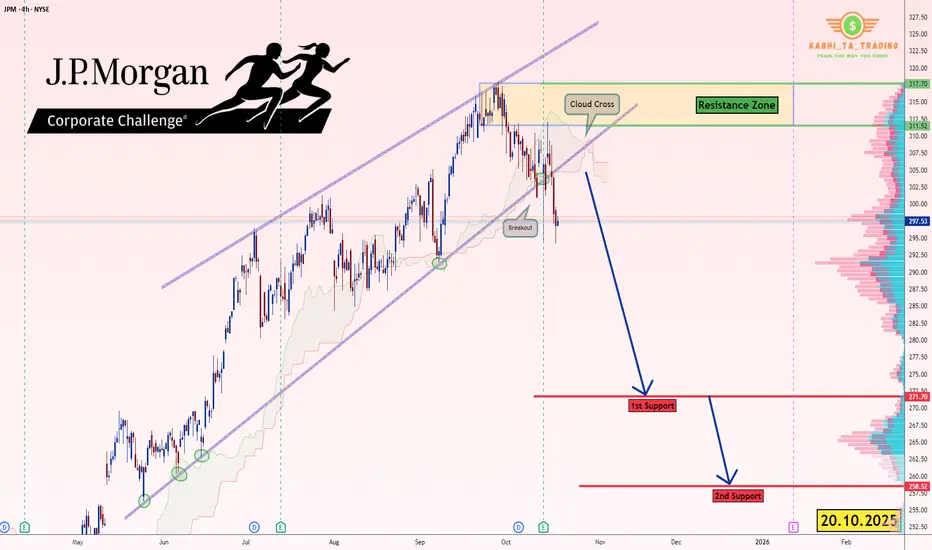
JP Morgan (JPM) - H4 - Breakout Pattern (20.10.2025)📊 Setup Overview:
J.P. Morgan ( NYSE:JPM ), presenting a bearish outlook based on the price action.
📈 Trade Plan:
Bias: Bearish below $310
1st Target: $272 ✅
2nd Target: $258.52 🎯
Resistance Zone: $311 – $318
🧩 Technical Confluence:
1.Price Breaks the Wedge Pattern.
2.Trendline break confirming reversal
3.Ichimoku Cloud crossover indicating bearish momentum
🏦 Key Fundamentals & Recent Performance
1.JPM reported third-quarter 2025 adjusted revenue of ~$47.12 billion, topping estimates.
2.Net interest income (NII) rose only ~2% YoY in Q3 to $24.1 billion, and the bank raised its 2025 NII outlook to ~$95.8 billion.
3.JPM itself flags major risks: ongoing geopolitical uncertainty, elevated asset valuations, potential credit stress and slower growth.
#JPM #JPMStock #NASDAQ #USStocks #TechnicalAnalysis #wedgePattern #BearishSetup #PriceAction #EarningsWatch #StockMarket #SwingTrading #TradingView #Ichimoku #CloudCrossover #ChartsDontLie #Kabhi_TA_Trading
⚠️ Disclaimer:
This analysis is for educational purposes only and not investment advice. Always perform your own due diligence and manage risk appropriately before taking any position.
💬 Support the Analysis:
If this chart helped you — LIKE 👍, COMMENT 💬 your thoughts, and FOLLOW ✅ for more daily stock & forex chart breakdowns from Kabhi_TA_Trading!
Gold breaks $4,100 as JPMorgan’s Dimon hints at $10K potentialJP Morgan CEO Jamie Dimon , speaking at Fortune’s Most Powerful Women conference in Washington, said there is “some logic” in holding gold even at its current record high price. He acknowledged that in the current macro environment, gold “could easily go to $5,000 or $10,000 .”
Gold reached record highs above 4,100 per ounce the past week. Dimon also cautioned that asset valuations appear “kind of high across almost everything at this point,”.

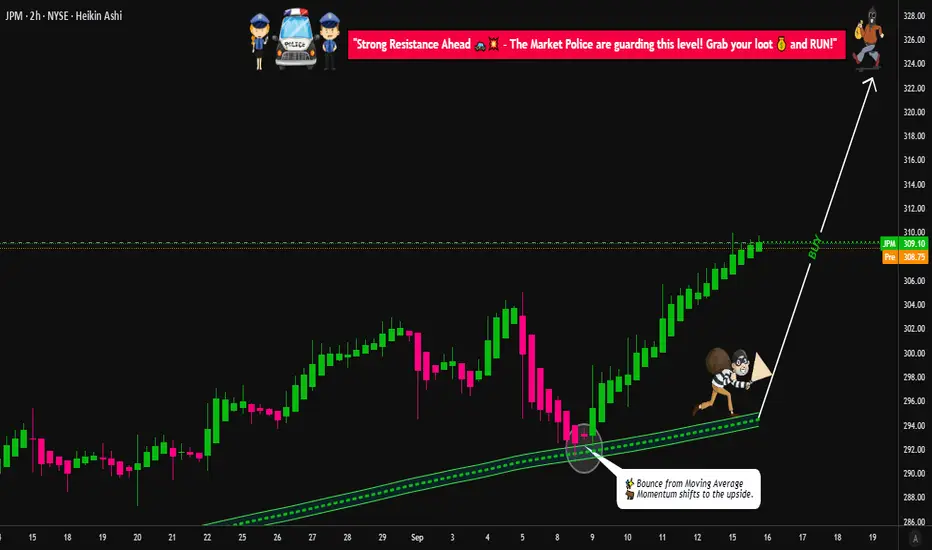
JPM Swing Plan → Layered Entries & Profit Targets Mapped😂 JPMorgan Chase (JPM) Swing/Day Trade: The Great Heist Blueprint 🤑💰
🚀 Asset: JPMorgan Chase & Co. ( NYSE:JPM )🎯 Market Profit Realization Plan: Swing/Day Trade📈 Outlook: Bullish vibes confirmed! 💪
📜 The Setup: Why JPM is Ready to Pop! 🎉
Bullish Confirmation: The chart is screaming BULLISH! 📈 A clean pullback to the moving average shows institutional big dogs 🐶 holding strong. This isn’t just a random pump — it’s a calculated move!
Market Context: JPM’s price action shows resilience, with buyers stepping in at key levels. The moving average is acting like a trusty springboard for the next leg up. 🏀
🕵️♂️ The Thief Strategy: Layered Entries for Max Gains! 🏦
Dear Ladies & Gentlemen, Thief OGs 😎, here’s how we pull off this heist with style:
Entry Plan: Use a layering strategy with multiple limit orders to stack your position like a pro. 🧱
Suggested buy limit layers: $302, $304, $306, $308, $310.
Pro Tip: Feel free to add more layers based on your risk appetite and account size! More layers = more flexibility. 🥞
New traders? You can enter at any price level within this range — the trend is your friend! 🤝
Why Layering?: This strategy lets you scale into the trade, reducing risk while catching the move. It’s like sneaking into the vault with multiple keys! 🔑
🛑 Stop Loss: Protect Your Loot! 💼
Thief SL: Set your stop loss at $298, just below the breakout level to dodge any fakeouts. 🕳️
Note: Dear Thief OGs, this SL is a suggestion. Adjust it based on your strategy and risk tolerance. You’re the mastermind of your own heist! 🧠
Risk Management: Never risk more than you’re willing to lose. Protect your hard-earned cash! 💸
🎯 Target: Cash Out Before the Trap! 🏃♂️
Profit Target: Aim for $325, where we expect strong resistance and potential overbought conditions. 📉
Why $325?: Historical resistance + overbought signals = a classic trap zone. Cash out your profits before the market pulls a fast one! 🪤
Note: Dear Thief OGs, this TP is a guideline. Take profits at your own discretion — secure the bag when you feel it’s right! 💰
🔗 Related Pairs to Watch (with $ Correlations) 👀
Keep an eye on these financial sector buddies to gauge market sentiment:
NYSE:BAC (Bank of America): Moves in tandem with JPM as a fellow banking giant. If BAC is pumping, it’s a good sign for JPM! 📈
Correlation: High positive correlation (~0.8). Strong financial sector momentum often lifts both.
NYSE:WFC (Wells Fargo): Another banking heavyweight. Watch for similar price action to confirm sector strength. 🏦
Correlation: Moderate positive correlation (~0.7). WFC’s moves can signal broader banking trends.
AMEX:XLF (Financial Select Sector SPDR Fund): Tracks the financial sector as a whole. If XLF is bullish, it’s a tailwind for JPM! 🌬️
Correlation: Strong positive correlation (~0.85). XLF’s direction often sets the tone for JPM’s price action.
Key Point: Monitor these pairs for confirmation of JPM’s bullish move. If they’re lagging, proceed with caution — the heist might need a backup plan! 🕵️♀️
✨ If you find value in my analysis, a 👍 and 🚀 boost is much appreciated — it helps me share more setups with the community!
#TradingView #JPM #StockMarket #SwingTrading #DayTrading #TechnicalAnalysis #ThiefStrategy #Bullish
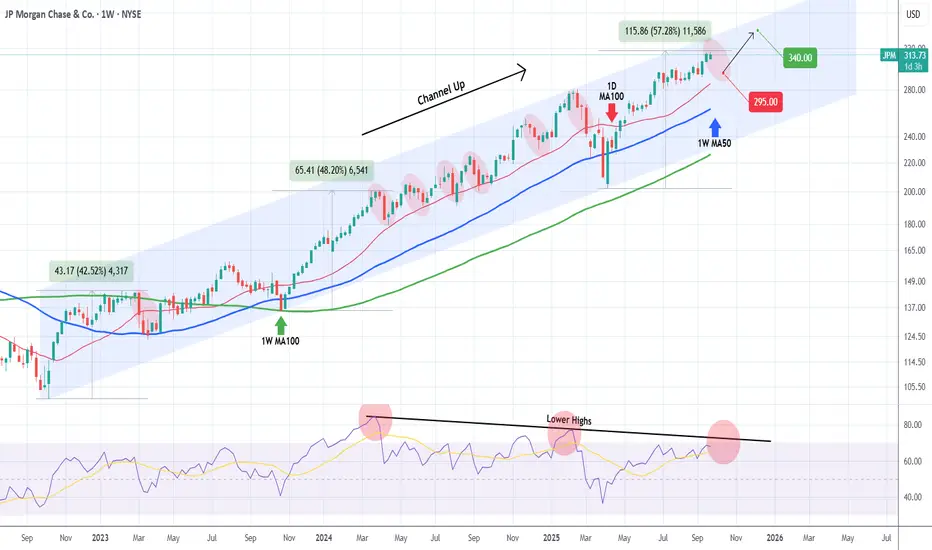
JP MORGAN In need of a relief correction.Last time we took a look at JP Morgan Chase (JPM) was 5 months ago (April 28, see chart below), issuing a strong long-term buy signal, which 2 weeks ago hit our $310 Target:
This time, having already completed a +57.28% rise from the April 07 bottom (Higher Low for the 3-year Channel Up), we expect a medium-term pull-back towards its 1D MA100 (red trend-line), which has systematically been its most common buy entry. The 1W MA50 (blue trend-line) - 1W MA100 (green trend-line) Zone has been the ultimate buy range but since March 2023 has only emerged 3 times.
As a result, given the trajectory of the 1D MA100, we expect the stock to pull-back to $295.00 and if it holds, rebound for an end-of-year rally to $340.00.
-------------------------------------------------------------------------------
** Please LIKE 👍, FOLLOW ✅, SHARE 🙌 and COMMENT ✍ if you enjoy this idea! Also share your ideas and charts in the comments section below! This is best way to keep it relevant, support us, keep the content here free and allow the idea to reach as many people as possible. **
-------------------------------------------------------------------------------
💸💸💸💸💸💸
👇 👇 👇 👇 👇 👇
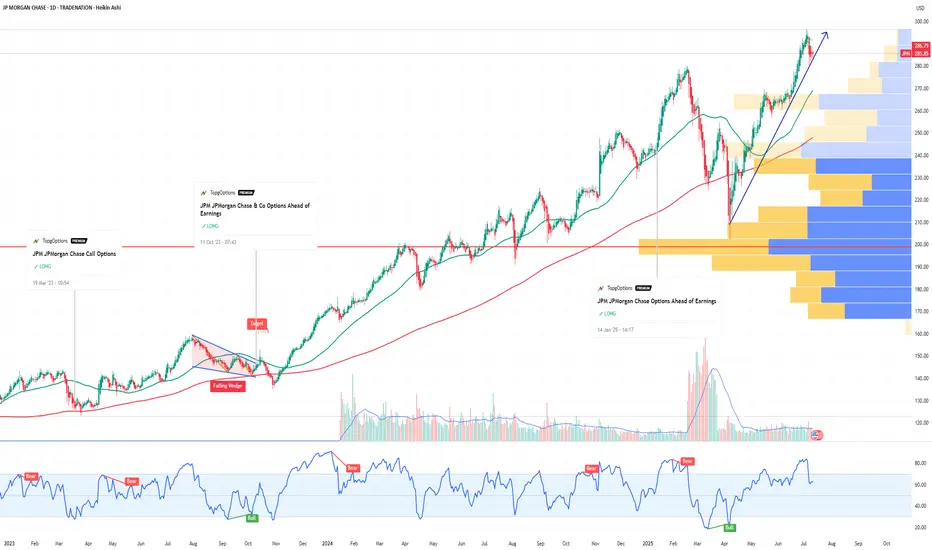
JPM JPMorgan Chase & Co Options Ahead of EarningsIf you haven`t bought JPM befor the rally:
Now analyzing the options chain and the chart patterns of JPM JPMorgan Chase & Co prior to the earnings report this week,
I would consider purchasing the 290usd strike price Calls with
an expiration date of 2026-1-16,
for a premium of approximately $20.20.
If these options prove to be profitable prior to the earnings release, I would sell at least half of them.
Disclosure: I am part of Trade Nation's Influencer program and receive a monthly fee for using their TradingView charts in my analysis.
$JPM Tradespoon – Long Entry $296.36Tradespoon model generated long signal for NYSE:JPM . Predicted range: $296.36–$298.79. Trend: +0.10%. NYSE:JPM

US Banks on Fire | Revenues Soar, and So Do the ProfitsWho Needs a Recession? Banks Are Swimming in Cash!
The largest U.S. banks have reported some of their best quarterly performances in recent years, with surging trading revenues, a resurgence in dealmaking, and an overall renewal of corporate confidence playing pivotal roles. Let’s break down the key details of the results.
Market Recovery
Across the major banks, investment banking and trading activities recorded impressive performances. Goldman Sachs saw investment banking revenue increase by 24%, while Bank of America (BofA) experienced a massive 44% jump, marking its strongest quarter in three years.
The market volatility stemming from factors like the U.S. election and changing expectations around interest rates continued to fuel robust trading revenues. Morgan Stanley’s equities division, for example, reached an all-time high, while JPMorgan and Goldman Sachs enjoyed notable gains in fixed-income trading.
A surge in CEO optimism has led to an uptick in mergers and acquisitions (M&A), initial public offerings (IPOs), and private credit demand. Morgan Stanley, in particular, is seeing the largest M&A pipeline in seven years, signaling a sustained wave of dealmaking.
Mixed Results for NII
Net interest income showed varying results across the banks, but forward guidance indicates that NII will likely see moderate growth in 2025, spurred by continued loan demand and higher asset yields.
Credit Risks on the Rise
Consumer lending pressures have persisted, with JPMorgan’s charge-offs rising by 9%. Many banks are preparing for a further increase in delinquencies, particularly in credit cards.
Commercial Real Estate Challenges
While the office sector remains under stress, banks are managing their exposures cautiously and have yet to face significant shocks in this area.
Regulatory Scrutiny Continues
Citigroup lowered its 2026 profitability target as it undergoes a transformation, while Bank of America faced increased scrutiny over its anti-money laundering compliance.
Resilient U.S. Economy
Banks are reporting strong consumer spending, loan growth, and corporate profitability, which supports an optimistic outlook for earnings growth heading into 2025.
Performance Breakdown for Each Bank
JPMorgan Chase
- JPMorgan posted a record annual net income of $58.5 billion, marking an 18% increase from the previous year.
- Investment banking saw a 46% surge in revenue, driven by strong advisory and equity underwriting.
- Trading revenue climbed by 21%, led by a 20% increase in fixed-income trading.
- Despite the impressive results, JPMorgan is still facing challenges such as rising charge-offs and pressures on loan margins. CEO Jamie Dimon emphasized concerns about persistent inflation and growing geopolitical risks.
Bank of America
- BofA experienced an 11% year over year growth in revenue, reaching $25.3 billion, with net income up 112% from the previous year.
- The investment banking division saw a dramatic 44% rise in revenue, the highest in three years, thanks to strong debt and equity underwriting.
- Trading revenue grew by 10%, driven by solid performance in fixed income (up 13%) and equities (up 6%) as market volatility spurred client activity.
- BofA also reported growth in its consumer and wealth management divisions, with credit card fees and asset management showing strength. Client balances grew to $4.3 trillion, a 12% increase from the previous year.
- After several quarters of decline, BofA’s NII grew by 3%, exceeding expectations and signaling stability. The bank expects NII to continue rising through 2025, with projections of $15.7 billion per quarter by the end of the year.
Wells Fargo
- Wells Fargo’s revenue remained flat at $20.4 billion, but net income surged by 50%.
- NII declined by 8% year-over-year but is expected to rise slightly in 2025 due to higher reinvestment rates on maturing assets.
- The bank made significant progress in cost-cutting efforts, reducing non-interest expenses by 12%, thanks to workforce reductions and efficiency initiatives.
- Investment banking fees rose by 59%, benefiting from the broader market recovery and the bank’s renewed focus on its Wall Street presence.
- Wells Fargo returned $25 billion to shareholders in 2024, including a 15% dividend increase and $20 billion in stock buybacks. However, the bank continues to face regulatory constraints, notably the asset cap imposed by the Federal Reserve.
- Looking ahead to 2025, Wells Fargo anticipates modest growth in fee-based revenue, with cost discipline and efficiency gains driving improvements.
Morgan Stanley
- Morgan Stanley saw a 26% increase in revenue, reaching $16.2 billion, while net income soared by 142%.
- Equity trading revenue jumped by 51%, setting a new all-time high as market volatility sparked increased client activity, particularly in prime brokerage and risk-repositioning trades.
- Investment banking revenue grew by 25%, fueled by strong demand for debt underwriting, stock sales, and M&A activity. CEO Ted Pick noted that the M&A pipeline is the strongest in seven years, signaling a potential multi-year recovery in dealmaking.
- Morgan Stanley’s wealth management division saw $56.5 billion in net new assets, increasing total client assets to $7.9 trillion. The firm is pushing toward its goal of $10 trillion in assets under management.
- In response to growing business complexities, the firm launched a new Integrated Firm Management division to streamline services across investment banking, trading, and wealth management.
Goldman Sachs
- Goldman Sachs experienced a 23% increase in revenue, reaching $13.9 billion, while net income more than doubled, up 105%.
- Record performance in equity trading contributed to a 32% increase in revenue from this segment, as market volatility drove greater client activity.
- Investment banking revenue grew by 24%, boosted by significant gains in equity and debt underwriting.
- The firm’s asset management division saw an 8% rise in assets under management, reaching $3.1 trillion, while management fees exceeded $10 billion for the year.
- Goldman is winding down legacy balance-sheet investments but also saw a gain of $472 million from these investments in Q4. The firm’s recent launch of its Capital Solutions Group is aimed at capturing growth opportunities in private credit and alternative financing.
Citigroup
- Citigroup posted a 12% increase in revenue, reaching $19.6 billion, with non-interest revenue surging 62%.
- Fixed-income and equity markets were key drivers, growing 37% and 34%, respectively, as market volatility tied to the U.S. election boosted performance.
- Investment banking revenue climbed by 35%, supported by strong corporate debt issuance and a pickup in dealmaking activity.
- The bank unveiled a $20 billion stock repurchase program, signaling confidence in future earnings.
- Citigroup also made strides in controlling operating expenses, which declined by 2% quarter-over-quarter. However, the bank lowered its 2026 return on tangible common equity (RoTCE) guidance to 10%-11% due to the costs of its ongoing transformation.
- CEO Jane Fraser emphasized Citigroup’s long-term growth trajectory, noting improvements in credit quality and continued progress with the strategic overhaul, including the postponed IPO of Banamex, the bank’s Mexican retail unit, now expected in 2026.
Long story short
Heading into 2025, the major U.S. banks are in strong positions, buoyed by a favorable economic backdrop, continued growth in trading, and a rebound in corporate dealmaking. Despite challenges such as rising credit risks, regulatory hurdles, and potential macroeconomic uncertainties, the outlook remains positive. With a recovering IPO market, continued wealth management growth, and strong trading revenue, the banks are poised to capitalize on the renewed corporate optimism. The key question will be whether the dealmaking frenzy continues or whether uncertainties in the global economy and market dynamics could temper the rally.

ETH/USDT ETH/SDT 1W The market has priced in most scenarios. At this point, the chart tells the story — and it’s playing out as expected

XAUGold is really have not time for wait ... why it should .. there are some kind of long teram pressing price down buyin buyin & buyin .. when they want to sell it ? Or it is already was sold ? who knows ... but ,its insane, how many ways there are to scam people :D

JPMorgan Forecasts Strong 60-90% Growth for Gold Mining JPMorgan Forecasts Strong 60-90% Growth for Gold Mining Sector as Gold Prices Reach Record Highs
Meta Description:
JPMorgan predicts the global gold mining industry will grow by 60% to 90% thanks to record-breaking gold prices, increasing investment demand, and stable production costs. Where are the opportunities for investors?
JPMorgan Forecasts 60-90% Growth for the Gold Mining Industry
According to the latest outlook from leading investment bank JPMorgan, the global gold mining sector is facing an exceptional growth opportunity, expected to rise by 60% to 90% in the near future. This forecast comes amid historic highs in gold prices and a strong surge in gold investment demand.
Rising Gold Prices – The Key Driver for Mining Industry Growth
JPMorgan experts note that gold prices have been setting multiple new records in global markets throughout 2024. The main factors are concerns about inflation, geopolitical instability, and continued monetary easing by major central banks. These conditions have driven investors to seek gold as a safe-haven asset.
Advantages for Gold Mining Companies
JPMorgan believes that gold mining companies will be among the biggest beneficiaries of this uptrend. With production costs remaining stable, gold companies are projected to see significant profit increases—some may even raise dividends for shareholders.
Key factors supporting the gold mining sector include:
Strong increases in international gold prices.
Consistent physical gold demand from central banks.
Growing purchases by both retail and institutional investors
Well-controlled production and mining costs.
Investment Opportunities and Potential Risks
JPMorgan recommends that investors prioritize shares in large gold mining companies with low production costs and strong financial foundations to optimize returns during this gold boom.
However, JPMorgan also warns that the gold mining sector still faces several risks, such as:
High volatility in global gold OANDA:XAUUSD prices.
Rising mining costs if energy prices fluctuate.
Legal and political risks in major gold-producing countries.
Conclusion
With a remarkable growth outlook of 60% to 90% as forecasted by JPMorgan, the gold mining industry is becoming a hotspot for global investment inflows. Still, investors should carefully consider potential risks and select the right gold companies to ensure both safety and effectiveness for their investment portfolios.

JP MORGAN's long-term bullish trend restored above the 1D MA50.JP Morgan Chase (JPM) broke above its 1D MA50 (red trend-line) last week for the first time since the first week of March and technically put an official end to the 3-month 'Trade War' correction.
This correction has technically been the Bearish Leg of the 2.5-year Channel Up. Every time the 1D MA50 broke and closed a 1W candle above it, the stock started the new Bullish Leg of the pattern. The last Bullish Leg was +6% (+48% against +42%) stronger than the previous one before the first pull-back to the 1D MA50 again.
As a result, we expect to see $310 (+54%) before this year is over.
-------------------------------------------------------------------------------
** Please LIKE 👍, FOLLOW ✅, SHARE 🙌 and COMMENT ✍ if you enjoy this idea! Also share your ideas and charts in the comments section below! This is best way to keep it relevant, support us, keep the content here free and allow the idea to reach as many people as possible. **
-------------------------------------------------------------------------------
💸💸💸💸💸💸
👇 👇 👇 👇 👇 👇

J.P. Morgan joins the $4K gold clubJ.P. Morgan now forecasts gold to average $3,675 per ounce by year-end and joins Goldman Sachs in projecting a move beyond $4,000 next year.
Spot gold has gained 29% year-to-date, setting 28 record highs and briefly surpassing $3,500 for the first time yesterday.
According to the bank, the main downside risk remains a sudden decline in central bank demand. Key support has potentially shifted higher, with $3,286 now seen as a potential pivot—aligned with both the 50-day moving average and the 61.8% Fibonacci retracement.

JPMorgan Chase Reports Earnings Today, Topping Q1 EstimatesShares of JPMorgan Chase (NYSE: NYSE:JPM ) are currently up 3% in Friday's premarket session as the asset tops Q1 estimates.
The company reported better-than-expected fiscal first-quarter results as big banks kicked off the new earnings season.
The banking giant reported earnings per share (EPS) of $5.07 on revenue of $45.31 billion, each up from $4.44 and $41.93 billion, respectively, a year ago. According to estimates compiled by Visible Alpha, some analysts had expected $4.64 and $43.55 billion. It generated $23.4 billion in net interest income (NII), above the $23.00 billion consensus.
Shares of JPMorgan were up 3% immediately following the release of Friday's report. They entered the day down roughly 5% year-to-date but up about 16% in the last 12 months.
"The economy is facing considerable turbulence (including geopolitics), with the potential positives of tax reform and deregulation and the potential negatives of tariffs and 'trade wars,' ongoing sticky inflation, high fiscal deficits and still rather high asset prices and volatility," JPMorgan CEO Jamie Dimon said. "As always, we hope for the best but prepare the Firm for a wide range of scenarios."
Dimon wrote in his annual letter to shareholders this week that he expected the Trump administration's tariffs "will slow down growth."
technical Outlook
As of the time of writing, NYSE:JPM shares are already up 1.5% with the asset trading above the support point. A break above the 1-month high pivot could set the course for a bullish campaign eyeing the $260- $280 region.
With the last close RSI at 46, NYSE:JPM shares has more room to capitalize on the dip and make a comeback prior the earnings beat.
