AUDUSD: Fake Breakout 🚀Sellers have officially been trapped! It now looks like price is pushing up to sweep their liquidity.
Will the liquidity sweep result in the true sell move to follow OR will we see bullish continuation from here?
Let me know your thoughts by voting below.
Keylevel

NZD-JPY Long From Support! Buy!
Hello,Traders!
NZD-JPY fell down sharply after
The retest of the horizontal level above
But now it is close to the support
After the retest of which
The expectation of the rebound
Will be reasonable
Buy!
Like, comment and subscribe to boost your trading!
See other ideas below too!

SILVER Resistance Ahead! Sell!
Hello,Traders!
SILVER is going up from the support
Just as I predicted in my previous analysis
But the resistance level is ahead of us
So I think we will see a move down
After the price retests the level
Sell!
Like, comment and subscribe to boost your trading!
See other ideas below too!

EUR-JPY Breakout Short! Sell!
Hello,Traders!
EUR-JPY broke the key horizontal support level
Which indicates an underlying weakness of the pair
Thus, the price is set to move lower
After the retest of the broken level
Sell!
Like, comment and subscribe to boost your trading!
See other ideas below too!

USDCHF - BREAK OF STRUCTURE 📉the NZDCAD price is in Ascending Channel and in Double Top Pattern .🧐
the Neckline is broken✔
the Trendline is broken 🔥
so, i predict a bearish move 📉 TARGET: 0.95678 🎯
...
if you agreed with this IDEA, please leave a LIKE, SUBSCRIBE or COMMENT!

✅AUD_USD WILL GO DOWN|SHORT🔥
✅AUD_USD is approaching a supply level
So according to our strategy
We will be looking for the signs of the reversal in the trend
To jump onto the bearish bandwagon just on time to get the best
Risk reward ratio for us
SHORT🔥
✅Like and subscribe to never miss a new idea!✅

AUD-NZD Will Go Up! Buy!
Hello,Traders!
AUD-NZD has broken the key
Horizontal resistance level
And because the pair is in the uptrend
It confirms our bullish bias
Thus, we are expecting bullish continuation
Buy!
Like, comment and subscribe to boost your trading!
See other ideas below too!

✅AUD_NZD BULLISH BREAKOUT|LONG🚀
✅AUD_NZD is going up currently
And the pair broke the key structure level
Which is now a support, and after the pullback
And the retest, I think the price will go up
LONG🚀
✅Like and subscribe to never miss a new idea!✅

AUD/USD: Possible continuation of the trendAustralian Dollar/U.S. Dollar still in this bullish market structure that we could to find up bought in the smart level to watch in H4 timeframe. I mark in the black circles the key to watch.
Also, as we break out this bearish channel, the trend could to turn bullish. So, we would need to know how the candlestick in H4 timeframe will closed up to take a tract if we could to entry to bought, or wait a little more to know if reach down the point $0.6853 USD to bought in this smart level.
I will update this par if we see an opportunity to long.
Keep pending this opportunity

EURUSD: Buying Lure ⚠️Are you being lured into buys? My gut is telling me that selling is not finished yet.
We created strong support at the key psychological level of 1.00000 and this was the initial buy trap that ended in a strong liquidity grab.
However, one liquidity grab is not enough nowadays and for this reason, I will be looking to continue selling with the trend from this lovely supply that is approaching.
If we show signs of rejection around this area, I will be taking a sell with the members to create a new low.

USDCAD - BEARISH MOVE !
the USDCAD price reached a daily resistance line 🧐
i predict a bearish move 📈 i'm waiting for breakout and retest📉 (SELL CONFIRMATION)
TARGET: 1.26410 🎯
...
if you agreed with this IDEA, please leave a LIKE, SUBSCRIBE or COMMENT!

✅EUR_GBP RISKY LONG🚀
✅EUR_GBP broke the key structure level
While trading in an local uptrend
Which makes me bullish
And I think that after the retest of the broken level is complete
A rebound and bullish continuation will follow
LONG🚀
✅Like and subscribe to never miss a new idea!✅

Key levels 2.0
Key levels are psychological price levels on the chart where many traders base their technical analyses on. These traders are likely to place their bullish or bearish entries, and exit points around these levels. And as a result, key levels tend to be crowded with a high trading volume.
Key levels also attract so much trading volume because that is where institutional traders make their trades as well. And thanks to their big-money moves, key levels are often resilient and lasting.
How to Identify Key Levels
There are three main types of key levels, and you are most likely familiar with them all even if you’re a novice forex trader. So identifying them should be quite easy.
The Horizontal Key Level
The horizontal key level is made up of support and resistance levels. But we aren’t talking about just any support and resistance level. We’re referring to those with lasting historical significance. You’ll find these horizontal key levels on the higher timeframes, such as the weekly and monthly timeframes.
The horizontal key levels remain active for months and years, and the price mostly never gets across them without strong opposition. In the chart above, notice how the level keeps getting a lot of reactions from the price before it finally breaks.
The Slanting Key Level
The slanting key level forms on trends. It appears as a trendline on the chart. And just like their horizontal counterparts, slanting key levels mostly form on the weekly and monthly charts.
The Rounded Key Level
Rounded levels on the charts also form key levels. Our article on rounded levels tells you everything you need to know about rounded levels. But for the sake of this article, rounded levels are those price levels that are easily divisible by 100. They often end with two or more zeroes.
Traders often place their trades around the rounded key levels because it is psychologically easier and simpler to trade at 120.00 as opposed to 119.97 The same way you would say you bought an item for $100 when you actually bought it for $99.99.
Tips on Trading Key Levels
Here are some tips have at the back of your mind when trading the key levels:
Pick your key levels from higher time frames. The key levels on the higher timeframes tend to be stronger than those on the lower timeframes. The reason is that this is where the market movers, big banks, and other institutional traders make their trades. Any level below the 4-hour chart could easily falter and is prone to false breakouts. But to be on the safe side, use the key levels on the timeframes higher than the daily chart.
Set your stop losses wisely. Where you place your stop losses could make or break your forex account. There are many schools of thought when it comes to setting stop losses, and each one is perfect for varying trade scenarios. But one objective method of setting stop losses that works for most trading scenarios is using the Stop Loss Cluster indicator.
The Stop Loss Cluster indicator tells you where most traders have placed their stop losses. And these are the levels the price is most likely to hit during a false breakout.
Conclusion
You too can base your trades on these key levels. But make sure you follow the strategies and tips we have discussed to help you make the best of the key levels

Key leves lets see how the candles react with levelskey levels are some strong they can send the price up or down
To create a leve first
1 Go to daily time frame and find 3 candles that touch exactly with red Horizontal line
when you finish drawing all lines in daily time frame go to 4H time frame and do exact the same thing that you did in daily time frame
if you found 2 key levels are to much near you can delete one take the one which touch lot of candles
2 the candles that are touching the levels called
CCL : Candle that created the level
CSL1 CSL2 CSL3 CSL4 CSL.......100 : Candle that Supported the Level
when you finish doing that change time frame to 5 or 15 minut and check how the candles react with these KEY LEVELS

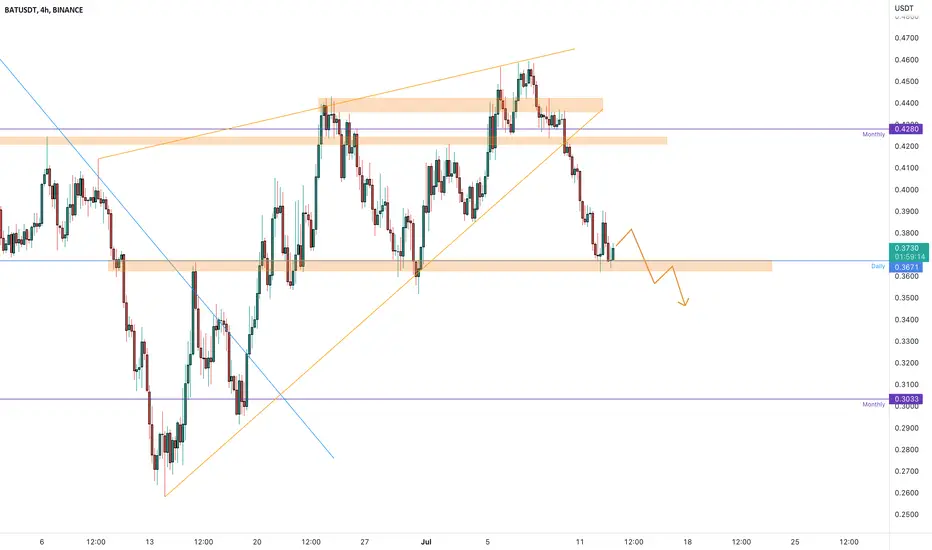
BATUSDT is testing the key levelThe price had a breakout from the rising wedge after a false breakout from the monthly resistance at 0.43$.
the price is testing the 4h support again, as you can see on the left that support is a key level for the price.
How to approach it?
IF the price is going to lose the support and retest as new resistance, According to Plancton's strategy , we can set a nice order
–––––
Keep in mind.
🟣 Purple structure -> Monthly structure.
🔴 Red structure -> Weekly structure.
🔵 Blue structure -> Daily structure.
🟡 Yellow structure -> 4h structure.
–––––
Follow the Shrimp 🦐
CRUDE OIL Risky Long! Buy!
Hello,Traders!
CRUDE OIL is trading in a downtrend
But a strong horizontal support level
Will soon be retested and I am expecting
A local rebound to the upside
Buy!
Like, comment and subscribe to boost your trading!
See other ideas below too!

✅EUR_USD TIME TO BUY|LONG🚀
✅EUR_USD is going down now
But a strong support level is ahead
Thus I am expecting a rebound
And a move up towards the target
LONG🚀
✅Like and subscribe to never miss a new idea!✅

EUR-CAD Swing Long! Buy!
Hello,Traders!
EUR-CAD is trading in a massive downtrend
And I am bearish on the pair
BUT a weekly key level has almost been retested
From where a pullback is reasonable to expect
With the target being the local resistance above
Buy!
Like, comment and subscribe to boost your trading!
See other ideas below too!

AUD-USD Will Keep Falling! Sell!
Hello,Traders!
AUD-USD is trading in a downtrend
And the pair broke another key level
So we are bearish biased
And I think that we will see
Bearish continuation after the pullback and retest
Sell!
Like, comment and subscribe to boost your trading!
See other ideas below too!

✅CAD_CHF WILL GO UP|LONG🚀
✅CAD_CHF is going up currently
And the pair broke the key structure level
Which is now a support, and after the pullback
And the retest, I think the price will go up
LONG🚀
✅Like and subscribe to never miss a new idea!✅

NZDUSD: Weekly Demand!Wow, price has finally reached the weekly demand zone we have all been waiting for!
Will we see immediate price reaction?
OR
Will we see a slow compression delivery to manipulate key level buyers before the true bullish move into the break and retest liquidity comes in?
Vote BELOW!

XAUUSD ( Goldie ) I see here another potential for a nice long from 1805 to 1830 +- . On Friday, the price tested the lowest level of 1790 +- and now I expect another growing impulse.
Gold is consolidating from a long-term perspective, but I am extremely bullish due to global inflation.

EURCAD Rise to channel Resistance + 100 PipsWelcome back! Here's an analysis of this pair!
**EURCAD - Listen to video!
We recommend that you keep this pair on your watchlist and enter when the entry criteria of your strategy is met.
Please support this idea with a LIKE and COMMENT if you find it useful and Click "Follow" on our profile if you'd like these trade ideas delivered straight to your email in the future.
Thanks for your continued support!
Brian & Kenya Horton, BK Forex Academy
