Wait for confirm and sell signal with GBPCHFH1 time frame.
Structure: Downtrend
Break Key level of Correction wave and retest at 1.26200.
Wait for confirm downtrend at a smaller time frame and sell signal to trigger order.
Target is next support at 1.25000.
-----------------------------------------------------------------------------------------------
Wish you all have a good trading day!
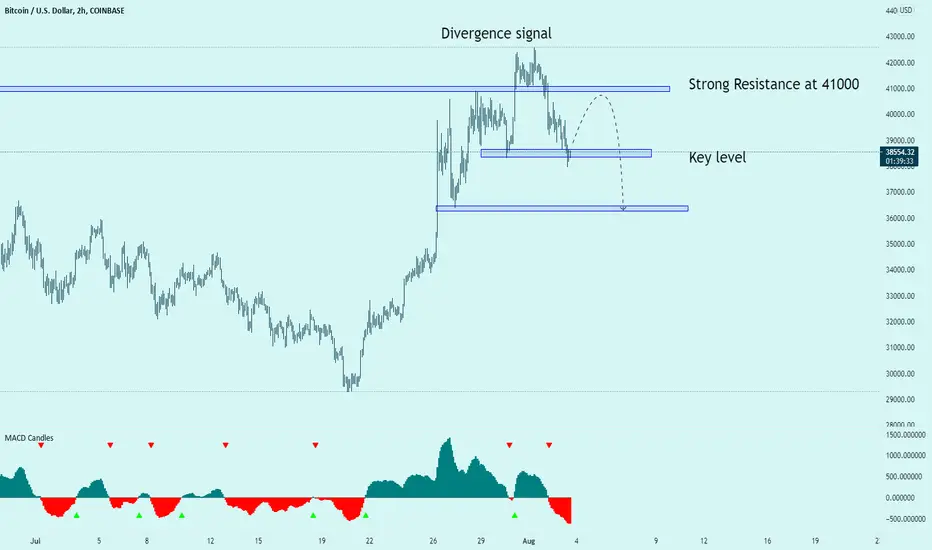
Keylevel

Wait for signal at support 36000 with BTCH1 time frame.
After divergence signal and price hit strong resistance at 41000, BTC made downtrend.
Target is support zone at 36000. Wait for bound or break at this price and signal to action after retest.
-----------------------------------------------------------------------------------------------
Wish you all have a good trading day!

Wait for confirm and buy signal with EURCADH4 time frame.
Structure: Uptrend.
Break Key level downtrend - retracement.
Wait for confirm uptrend and buy signal.
Target is next resistance at 1.51000.
-----------------------------------------------------------------------------------------------
Wish you all have a good trading day!

EURUSD 30m Short Position at 1.18899SL: 1.18950 (-5.0) | 5 pip stop loss
SE: 1.18899 (-0.1) | 0.1 pip slippage
TP: 1.18800 (3:1) | 3:1 risk-to-reward

Wait for sell signal when retracement to 41000 with BTCH2 time frame.
Structure: Uptrend - Break Key level.
Divergence signal at 42500 and fake-out.
Wait for sell signal when retracement to 41000.
Target is next support at 36000.
-----------------------------------------------------------------------------------------------
Wish you all have a good trading day!
Short GBPUSD Off Key LevelSell GBPUSD 1.39000 SL 1.39130 TP1 1.38500 TP2 1.38000
Context:
- USD favorited news catalyst for Wednesday's ADP
- New Minor Structure downtrend identified
Confluence Details:
-Trading off key area 1.39000
- H1 0.382 Fib level at 1.38980 (beginning of new trend so expecting strong downside)
- H1 20MA dynamic resistance level at 1.39000
- H1 50MA dynamic resistance level at 1.39080
- Looking for a pin bar reversal off 0.50 fib level to confirm downtrend continuation at 1.39050 + 1.39000 new resistance level
- Entry confirmed once H1 price action identified: Either bearish engulfing or some sort of 3-bar variation pattern.

Wait for Break Key level and buy signal with EURCADH4 time frame.
Structure: Uptrend.
Divergence at support 1.48000.
Wait for break out key level 1.49000 and confirm signal to buy.
-----------------------------------------------------------------------------------------------
Wish you all have a good trading day!

Wait for retest and sell signal with GBPCHFH1 time frame.
Structure: Downtrend.
Correction wave with Ascending channel.
Breakout Ascending channel at resistance 1.26400.
Wait for retest at this point and sell signal.
-----------------------------------------------------------------------------------------------
Wish you all have a good trading day!

Buy EURSGD with Inside Bar setupDaily time frame.
Structure: Uptrend.
Break Key Level, retracement, and confirm uptrend with Inside Bar.
Buy order with this setup.
Target is next resistance at 1.63000.
-------------------------------------------------------------------------
Wish you all have a good trading day!

Wait for confirm sell signal with AUDUSDH4 time frame.
Structure: Downtrend with Correction wave ABC hit trendline.
Resistance at 0.74000.
Wait for the confirmation and sell signal.
Target is next support at 0.73000.
-------------------------------------------------------------------------
Wish you all have a good trading day!

🐮 NZD bulls back in action?NZDCHF has fakeout of an important support on the 4H chart, made a decent pullback to the 61.8% fib and is now continuing upwards.
On the 1D we have been supported and it seems that the bulls on NZD might be back in play.
Keeping this one short and sweet, long on NZDCHF

Wait for break key level and sell signal with EURJPYH4 time frame.
Structure: Downtrend, Triple Top pattern.
Wait for break key level and looking for sell signal.
Target is next support at 128.500
-------------------------------------------------------------------------
Wish you all have a good trading day!

Wait for Pullback and sell signal with USDJPYH1 time frame.
Structure: Downtrend.
Break key level of short-term uptrend.
Wait for pullback and sell signal at key level 110.000.
Target is next support at 109.100.
-------------------------------------------------------------------------
Wish you all have a good trading day!

Wait for Pullback confirm and sell signal with GBPJPYH4 time frame.
Structure: Price hit down trendline.
Bias: Downtrend.
Breakout move up correction. Wait for Pullback now and sell signal to trigger.
Target is next support at 128.500.
-------------------------------------------------------------------------
Wish you all have a good trading day!

Wait for confirm downtrend with GBPJPYH4 time frame.
Structure: Downtrend.
Price hit trendline and down. A divergence signal appears.
Wait for break key level and confirm downtrend to sell.
Target is support at 148.500.
-------------------------------------------------------------------------
Wish you all have a good trading day!

Wait for the key level to appear and sell signal with GBPCADH1 time frame.
Structure: Break Uptrend and Key level.
Bias: Downtrend.
Wait for one more move up to complete Double Top pattern and appearance Key level to find the sell signal with GBPCAD.
-------------------------------------------------------------------------
Wish you all have a good trading day!

Uptrend expected after correctionClosing the last day with a red candle coincided with breaking the steep slope trend in 4h. As the result of this, I'm waiting for the price to drop to $65 to $70 zone. Any abnormal pin bar or bullish candlestick pattern in the buy zone will trigger my buy signal. Hereby, $248 will be the stop loss, and $320 and $332 will be my 1st and 2nd targets, respectively.
There is another possibility, the price crosses the $300 level without correction and stabilizes there. If it happened, I will update the idea.
The support and resistance levels and pivot points are drawn by the Trend Key Points indicator.

EUR/GBP - 4HR Chart - Interesting Spot!Price is currently trading around the 0.8570 region. We have seen strong rejection off 0.8564, combined with key level, trendline and 61.8 fib level bounce. If we see a bullish candle close buyers could take control. A break through could see a test of 0.85. We remain bullish on this pair having bottomed out on the HTF and rising COVID cases weighing on the GBP.

Wait for break key level for the pattern to complete with AUDCADH4 time frame.
Structure: Downtrend with Simple Flat.
Pattern: Simple Flat reject resistance at 0.94000.
Key level at 0.93000. Wait for break key level for the pattern to complete.
Then wait for set up to sell.
-------------------------------------------------------------------------
Wish you all have a good trading day!

Waiting for confirmation of uptrend at EURGBPH4 time frame.
Structure: Descending Channel.
Bias: Uptrend.
Waiting for confirmation of uptrend after break key level and descending channel.
Target is next resistance at 0.87200.
-------------------------------------------------------------------------
Wish you all have a good trading day!

Wait for confirm Uptrend with BTCH4 time frame.
Structure: Break Downtrend, break key level.
Bias: Uptrend.
Strong support at 31000, wait for confirm uptrend without down move below this price.
Target is next resistance at 35000.
-------------------------------------------------------------------------
Wish you all have a good trading day!

ETHUSD : will going downtrend to seek a valid dipCurrent price : After the break out higher time frame, the price retest in key level zone in daily time frame which is a strong zone for price to going down, the pattern occur rally base rally (rbr) in higher time frame, following (rbr) in minor time frame

Wait for the signal to sell order with BTC H1 time frame.
Structure: Descending Channel.
Bias: Downside.
Resistance at 31000.
Wait for the signal Price Action to sell order.
Target is support 28800.
-------------------------------------------------------------------------
Wish you all have a good trading day!
