XBTUSD - Kraken - Scalp Session 004Initiated a trade based on my last prediction. Stop at below the red outlined green box, or if price follows the red arrows path.
This is not intended as a trading guide. Trade only what you can afford to lose.
Kraken

XBTUSD - Kraken - Pattern Repeat? or breaking out?2 possibilites, bounce here right now, or from 1980s, and breakout... or bounce at 1960s to 2000s and more down...
or none... of course...

XBTUSD - Kraken - Scalp Session 003Two possible trades. A small Long and a small Short. If you've already bought todays dip, feel free to use this to compare it with your own targets/ideas.
There's a chance for a lower Long entry, making a double bottom, but the 4hour chart already shows a clear Bull divergence, although it might still have some room for another entry at support.
This is not intended as a trading guide. Trade only what you can afford to lose.

ETHUSD - Kraken - Scalp Session 002Again... doing this in a rush... I feel safer buying here than yesterday though. Similar, or pretty much the same targets from yesterday. Expecting some resistance at 230 again, probably take profit there. Stop if 180 fails as support. Should have posted this before going to sleep, but I was tired and woke up to do some other stuff.

ETHUSD - Kraken - Scalp Session 001Quickly before it breaks out....
3 targets.
Cryptos mosnt known coins seen to be following BTCUSD lately. ETHUSD offers bigger % movements than BTCUSD. I remain Bearish for the midterm in ETHUSD, but this looks like a good scalp opportunity.
Stop below support. Not on it. Did this in a hurry---

XMRUSD - Kraken - Will we have a Bullish Summer?This is a pure TA, looks to me to be a Bullish setup, at least a Bullish Channel from these last days heading for a breakout, provided there aren't any catastrophic crypto news coming soon. Marked some possible prices in Red where I think price could bounce, which once they are broken I will turn Green as Support giving more buying opportunities before breakout. Stop loss at 36.5 since I think there's a potential to break 61.70 during this month, or the following, with targets that I got with the Trend Based Fib in the 70-80 USD area, giving a R-R ratio of above 1.5, decent to me. MACD looks choppy right now, but as long as Channel Support holds I wouldn't care about it.
Only trade what you can afford to lose.


/~/ ETH RoadMap /~/ Episode 1 Hi, Long time didn't post here. It is summer time and even crypto needs a vacation.
Reaching 310 Euro within a week doesn't mean I am bullish. wait for episode 2 to know what will happen next.
If you are buying now, I strongly advice you not to.
We are hitting very nice trading opportunity.
Tschüs

Bear vs Bull Death BattleIn my analysis from yesterday, named Potential for the Bull, I wrote about the new €240 support being tested and that €250 would be the major resistance to be tested before we know in what direction this, relative stagnant 12 hours, market will go. I mentioned that €245 could become the new support, which it has turned out to be.
If you only look at the short term graph, these levels doesn't seem to be as important as they really are though. As the Bollinger Band contracts, as we all know, there might be a storm brewing.
I read the post by Glg_trader - The "Wave Box Theory", and I must say that it is an excellent analysis.
So you also need to ask yourselves, what is Ethereum really worth? In my opinion it is fundamentally in a huge bubble, created primarily by all the money coming in for investments in all the recent ICO's. As soon as the big ones started to close the correction began.
That is why I have been margin trading shorts since about the €315 level on June 21.
If I had to throw out a "wild" guess I would say Ethereum is worth around €150. (More of a gut feeling than anything else)
That being said, I still stick by my Potential for the Bull. If we pass €250 and it holds as support for a couple of bounces, then I will happily go "all in" on the long side with 5x leverage :)
(But I will sit glued to the screen and be ready to cash in when it is time for a new correction) :)


Potential for the BullYesterday I wrote that there would be a new cemented support at €240, which is being tested right now. If it can hold a "double dip" after bouncing at €245, or maybe even make €245 the next support to be tested on the next dip, then we have €250 to be tested. Passed that I would take part profit at €260 and go short if we break down under €250 again. If support holds at €250 I will go "all in" on the long side.
Happy trading! :)
Thoughts?

Back to Long after struggle to break outSo finally we had our bottom tested and cemented it seems. At least at a high probability. I timed a great spot for my long position at €225.51. As I'm writing my position is up 4.72%, and I feel very confident that we have cemented a solid support after couple of days of the Ol' Bear .
My personal guess is that we keep going upwards until we meet some resistance at about €240. But I would actually go so far that I think we will pass that and hit our heads at around €265-€270 and have a slight correction down to €240, which in turn will be the new solid support.
Any thoughts?

Loss of momentum breaks upholding patternIt seems that there just wasn't any real energy to the rally as we have lost an important support line.. Expect a bit of a downturn.


BULL RUN AFTER BTC CORRECTION.JUST AN IDEA, btc back to 1500$ or break out and up and broken 3000$, WHAT DO YU THINK ?

BTC/EUR LongNice Head and Shoulders Pattern. Several robust indicators support this hypothesis.
I am in long 5x ;)

Triangle Formation - Decision point inboundI've just noticed this, strong support and a short term resistance forming a triangle to be broken. Given the strength of the support line, if it's broken downward I'll take that as a decision to go short, otherwise holding and staying long even if it breaks through sideways. But in any case, the news seems good in that we will know either way where the trend is going when this is completed. It would be a positive to see LTCBTC dictating USD cost as opposed to being stuck with BTC's movements, the break up might give us a chance to break the recent high of 36$, and from there the ATH of 48$ isn't all that far away.
As always, good luck.


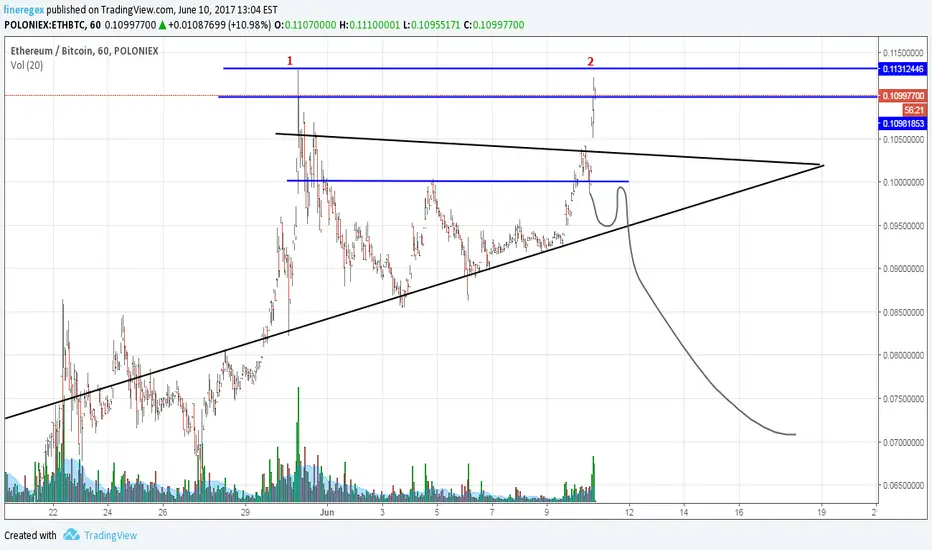
ETHereum double top! (+ rising wedge reversal)ETHereum double top!
may be confirmed through breaking through the lower black line or being rejected downwards by the the lowest blue line
BTCEUR to hi the target price of 2830 by the end of the week.The BTC EUR should hit the price target of 2830 EUR per BTC by the end of the week.
Currently in strong momentum, the price broke the triangle resistance and the break is backed by several robust indicators.


Bitcoin Reality 2I believe Bitcoin is between 20% and 40% into the 2017 bull run.
I refer readers to my first idea on the subject, Bitcoin Reality -
It is important to note the following:
1. Always use a logarithmic chart for Bitcoin. If there is any phenomenon that should be charted log instead of linear, it is Bitcoin!
2. Compare the long term log chart movements from Bitcoin's history with today. Bitcoin has a unique supply / demand dynamic. Read more in the original Bitcoin Reality post. My preference is for comparing the first part of the 2013 run-up with today, as we are in a similar moment fundamentally (see original post for more details).
3. Do not over-think on short time scales. I listed a few examples of rational and reasonable trades that have failed over the past few weeks in Bitcoin Reality . There were many more and there are a lot more to come. Look for yourself. In 2013 there was a bear trap of 50% in the second part of the run-up, when Bitcoin dropped from around $700 to $350 and came back again within a week before blowing past $1000. We have seen nothing of that scale yet, but it will likely happen at least once (with several more mid-size examples) before the definitive 2017 all time high is set.
Good luck everyone.

Bullish Flag depicts readiness for a break out.Looks like XMR EUR will pump soon, likely to test the previous structure highs of 50EUR.
