S&P 500 - Leading Diagonal May Be Among UsHey everyone, I wanted to give you all a technical update on the S&P 500 (SPX) as it's been moving sideways for a few weeks now, and it seems like it's not done yet. With a lot of options expiring today, we might see some volatility soon, but let's consider what the majority is currently thinking.
According to the American Association of Individual Investors (AAII), we have 27% bullish sentiment, 37% neutral, and the remaining percentage is bearish. This is a change from just a couple of weeks ago, when 33% were bullish. The spread shows some greed, but not too much. We're right in the middle, which could mean a bit more sideways movement or even a slight upside in the short term.
Now, let me give you a quick educational insight into a technical pattern called a leading diagonal. A leading diagonal is a type of impulsive wave structure that occurs in the first wave of a motive sequence. It consists of five subwaves, with the first, third, and fifth waves typically subdividing into three smaller waves.
Looking at the SPX chart, you'll see a classic leading diagonal with all the subwaves fitting within it. If the SPX remains below 4170, the bearish count will be valid. I believe it's highly possible we revisit the 4120-4124 range before bouncing back up to around 4150 early next week. If the corrective structure I've projected plays out, we should see a more aggressive move to the downside by mid-week next week.
Of course, many things still need to happen, but keep a close eye on the trendlines I've placed on the chart. Pay special attention to the leading diagonal in green, the support level in yellow, old support in red, and key resistance in orange. Don't forget the horizontal support and resistance that has been critical for more than just a few weeks, especially the 4130-4140 zone. We've been battling in this area for quite some time.
Trade carefully, friends, and remember to always do your own research and manage your risk. I'll keep you all updated as things progress.
Leading Diagonal

APEUSDT | Wave Projection Leading Diagonal Wave 5 BreakoutWave projection with price action and chart pattern analysis
Ape price recently breakout MA20 and squeezed under MA200 - MA20 about to golden cross MA200
If breakout MA200 successfully, a possible ABC pattern uptrend about to into an explosive leading diagonal wave 5 targeting 1 - 1.618 extension of wave 3
When a deep consolidation in wave 4 happening almost at the end of wave 2 level- a potential strong impulse leading wave 5 likely to occur.
TP1 + 60%, TP2 +100%
Indicator: MACD bullish signal - golden cross above 0 line

PLANB | Elliott Wave Projection - Leading Diagonal 5-WavePrice action and chart pattern trading
> Wave projection - Leading diagonal pattern with a possible 5-wave uptrend
> Entry @ pullback and breakout downtrend line wave 2 and wave 4 near lower support of uptrend wave channel.
> Target @ previous primary wave 3 | 0.786 - 1.0 zone +30% upside
> Stoploss @ upcoming wave 3 and upcoming wave 5 zone -10% downside
> Risk reward ratio 2:1
Always trade with affordable risk and respect your stoploss

Leading Diagonal Starts a Large Zig ZagIn the world of technical analysis, patterns play a crucial role in forecasting the future movements of a financial instrument. One such pattern is the leading diagonal, which can signify the start of a more extensive zig zag formation. In this article, I will delve into the recent price movements of the S&P 500 Index (SPX) and how a leading diagonal pattern has emerged as the beginning of a large zig zag formation. I will also discuss the significance of a leading diagonal in a zig zag formation and how it can serve as a valid trading signal.
Leading Diagonal Pattern in SPX
SPX recently witnessed a move that started around 3808 and peaked at nearly 4040. This price movement, characterized by a series of higher highs and higher lows, is indicative of a leading diagonal pattern. As the name suggests (leading), this pattern often appears at the beginning of a zig zag formation and is a valid formation within this context.
A leading diagonal is a five-wave structure, where each wave consists of three sub-waves. In the case of the SPX, we can observe this five-wave structure, which is now complete. The recent drop was expected, and the 4020 level has been a point of interest for some time. The index experienced an overthrow of this leading diagonal, and we are now below the lower trendline of the pattern.
Current Market Situation and Future Projections
At present, SPX is experiencing a small relief rally after falling below the lower trendline of the leading diagonal pattern. This indicates that bears are currently exhausted, and late short-sellers from yesterday are feeling the impact of time decay on their positions. As we move forward, we can expect a further move to the downside in the coming days or week, likely followed by a rally that takes the index back above the 4000 mark (potentially reaching the 4043-4050 range).
It is essential to keep an eye on the 61.8% retracement level, which stands at 4043. This level could be reached within the next two weeks and coincides with the next full moon, a period that I believe may present unique opportunities. You should be on the lookout for a potentially lucrative short position if the index reaches these levels.
At this time, I am not projecting any further out than the next few weeks, as the current primary path suggests a move back towards the 61.8% retracement level, followed by a potential short opportunity. However, it is crucial to keep in mind that market conditions can change rapidly, and you must remain vigilant and adaptable in their strategies.
The recent leading diagonal pattern observed in the SPX serves as a valid formation, signifying the beginning of a larger zig zag pattern. By monitoring the 61.8% retracement level at 4043 and the next full moon, traders can identify potential short opportunities in the coming weeks. It is crucial to remain vigilant, as market conditions can change rapidly, and traders must be prepared to adapt their strategies accordingly. This analysis serves as a guide for understanding the current market situation and identifying potential entry points, but it is essential to conduct your research and evaluate your risk tolerance before making any investment decisions.

End of Week Wrap! SPX, ES & Leading DiagonalAs the trading week comes to a close, market participants have witnessed a slow yet steady rise in SPX futures. I'm going to dive into the advantages of trading futures, analyze the recent price action in ES futures and the SPX index, and discuss the leading diagonal pattern that played out in the market. I will also provide insights into what to expect for the week ahead and share some advice on trading cautiously.
The Advantages of Trading Futures
Futures trading offers several benefits to traders, one of which is the absence of theta decay. Theta decay refers to the decline in the value of an option as time passes, which can erode profits in options trading. With futures, traders can benefit from even slight movements in their favor, making it easier to secure profits. Be careful for futures rollover dates, which TradingView conveniently places on the chart for your reference.
Recent Price Action in ES Futures and SPX Index
The ES futures experienced an upward movement, reaching the 4000 mark and hitting the resistance level at 4010. On the other hand, the SPX index did not quite make it to 4000. However, it is possible that it could reach that level next week, potentially after a lower open on Sunday evening. As the market conditions evolve, I will be closely monitoring ES for a move up to 4020.
The Leading Diagonal Pattern in Action
As anticipated, the leading diagonal pattern played out, and after breaking out, the price action briefly retested the trendline before moving up to 4000. This pattern indicates that the market is poised for a significant trend reversal.
Expectations for the Week Ahead
For the upcoming week, I anticipate that the market may open slightly lower, though not significantly. Shorting the market at this stage should be approached with caution and considered only for short-term day trades. After a potential pullback, I expect the market to make a move up towards the 4020 level later in the week before encountering another rejection. That is where I will consider adding short exposure. However, predicting such a scenario far into the future comes with inherent uncertainties, so it is wise to revisit my hypothesis next week and adjust as necessary.
Trade Carefully and Stay Informed
As we venture into the new trading week, it is crucial to trade carefully and stay abreast of market developments. By understanding the advantages of futures trading, closely monitoring price action in ES futures and the SPX index, and analyzing patterns such as the leading diagonal that unfolded over the last 2 days, you can better navigate the financial markets and make informed decisions.
As market conditions evolve, it is essential to continually reassess your strategies and adapt accordingly. By trading cautiously and staying informed, you can minimize risk and maximize your chances of success in this ever-changing landscape.

Deciphering: Analyzing Leading Diagonal Patterns and Key LevelsThe financial markets are a complex ecosystem where a multitude of factors influence the movement of securities. One of the key aspects of understanding market dynamics is recognizing patterns and monitoring key levels that can indicate possible future trends. In this article, I will discuss the leading diagonal pattern, its importance in technical analysis, and compare the ES futures to the SPX cash index. I will also delve into the significance of key levels and how they are essential for identifying support and resistance.
Leading Diagonal: A Brief Overview
A leading diagonal is a specific pattern in the Elliott Wave Theory, a form of technical analysis used to predict market trends by identifying recurring wave patterns. The leading diagonal pattern is typically found in the initial wave of a new trend and is characterized by a five-wave structure, with each wave subdividing into three smaller waves. This creates a 5-3-5-3-5 pattern, indicating that the market is likely to experience a significant trend reversal.
In my analysis of the ES futures and the SPX cash index, it appears that we have observed a leading diagonal pattern, which may suggest a short-term bottom and a potential upside move in the coming weeks.
Comparing ES Futures and SPX Cash Index
When analyzing market trends, it is crucial to understand that different instruments may display different chart patterns. In our case, the ES futures and SPX cash index exhibit a disparity due to contango, a situation where the futures price is higher than the spot price. This results in the futures chart looking somewhat different when compared to the cash index. Nevertheless, it is essential to take both into consideration when making predictions about the market's direction.
The Importance of Key Levels
Key levels in technical analysis are price points that serve as significant support or resistance areas for a financial instrument. They are essential for identifying potential entry and exit points in trades and can help determine if a trend will continue or reverse.
In my analysis of the ES futures, we are currently sitting at the 3967 level, which is an important support level. If the market breaks below this level, it could drop down to the next key level around 3925 before making a corrective move up to the 4000-4010 area. Observing these levels allows you to make informed decisions on when to enter or exit positions based on market behavior.
In the current scenario, the leading diagonal pattern suggests that we may see a short-term bottom soon, followed by a corrective move up and potential further downside. Keeping an eye on key levels, such as 3967 and 3925, will help us determine potential support and resistance areas, which in turn can guide our trading decisions. Moving forward, it is important to continually monitor the market and adjust your analysis based on new information, always taking into account both the futures and cash indices to get a comprehensive understanding of market dynamics since futures trades ~23/5 and the cash indicies do not.
By staying vigilant and utilizing the principles of technical analysis, such as leading diagonal patterns and key levels, you can better navigate the ever-changing landscape of the financial markets. This approach, combined with other fundamental and technical indicators, can provide a solid foundation for making informed decisions and managing risk in an often unpredictable environment.

BTC Elliott Wave count 4H TFAt this moment I have an ABC scenario that may also be an impulse with wave 3 instead of C.
Wave A or 1 finished at 2.618 fib extension wave 1 (of wave A or 1) vs wave 2 (of wave B or 2), wave B or 2 that may be an extended flat pattern finished at 0.5 fib retracement of wave A or 1.
Now probably we have finished also wave 1 from wave C or 3 ( a leading diagonal that may continue up to 0.618 (29550) fib extension 3 vs 4 (blue count).
I am expecting the wave 2 from wave C or 3 to fall at 0.382 - 0.5 fib retracement zone (if wave 5 (blue count) from this leading diagonal is finished now and will be truncated).
If will lose 24000 I will do not have so much confident in this count.
I will post updates to this count anytime I see a change into it.
Good luck and have a great weekend!
Press like button and follow if you want to see more updates. Thank you!

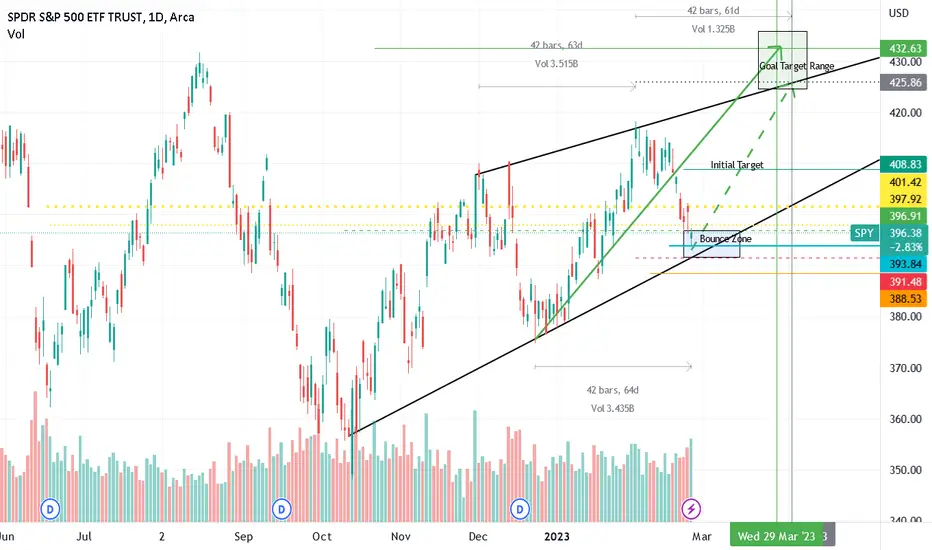
Its More Straight-Forward Than You ThinkThis is an Update to my previous SPY idea - same target/time to target, just more simplified. After the last 2 weeks there is a lot of bearish sentiment but its really just finding support at wave 4 of a leading diagonal.
The initial target is 408 in the next week or 2, and then goal target is 425-432 by late March-Early April.
The symmetry in the waves indicates this is a leading diagonal (or bearish wolfe wave that is about to complete the final wave). Either way its still bullish near-term. After 425-432 there will be significant downside risk, but for now expect a nice rally through March.
We are in the bounce zone, there is still risk to 388-391 early this week, but if any of the following occur we won't see the 388-391:
- retest and hold 393
- close above 397.92
- Intraday breach of 401.42 (above 401.42 it will turn into explosive upside)
TTB | Wave Analysis | Triangle 4-wave Trading SetupPrice action and chart pattern trading
> An overall global leading diagonal pattern with a possible A -wave uptrend with minor triangle 4-wave
> Target minor 5-wave of local A wave at 0.5 - 0.618 retracement global 4 wave +8-10%
> Stoploss @ lower triangle support - 3 - 4%
> RRR: 2.5:1
Always trade with affordable risk and respect your stoploss, nothing is 100%!

USDJPY LONG: Bullish RetracementUSDJPY is finally ready to bounce to the up-side.
The Elliott Wave Diagonal (Wedge) is certainly saying that.
XAUUSD is diverging, EURUSD found a top and the DXY looks ready to bounce.
My Technicals on USDJPY:
* Elliott Wave Reversal
* Leading Diagonal in Primary A (red)
* Bullish Divergence
* Harmonic Pattern: Bullish Shark
* Demand Zone
* Fibonacci Extension Confluence
* Golden Ratio Fibonacci Retracement
USDJPY LONG Signal:
* Entry @ 132.00
* SL @ 122.00
* TP1 @ 137.90
* TP2 @ 143.30
* TP3 @ 149.30
* Safety Measure: when in the green, moving SL to BE.
* BUY Stops on the way up, after pull-backs.
Many pips ahead!
Richard, the Wave Jedi.

NZDUSD SHORT: Bearish ReversalNZDUSD is about to make a Reversal, with a Bearish Wave expected.
I am expecting an Impulse Wave in Minor C (orng).
My Kiwi Technicals:
* Elliott Wave Reversal
* Leading Diagonal in Minor C (orng), of Intermediate (W) (orng)
* Upcoming Bearish Divergence
* 61.8% Fibonacci Retracement
* 127.2% Fibonacci Extension
* Harmonic Pattern: Bearish Shark
* Supply Zone
NZDUSD SELL Signal:
* Entry @ 0.6400
* SL @ 0.6630
* TP1 @ 0.6135
* TP2 @ 0.5900
* TP3 @ 0.5730
* Safety Measure: when in the green, moving SL to BE.
* SELL Stops on the way down, after pull-backs.
Many pips ahead!
Richard, the Wave Jedi.

XAUUSD Possible Sell-off as Price Forms An Ending Diagonal Previously we talked about Gold selling-off as we saw wave (C) form an Ending Diagonal Pattern which in this was a contracting diagonal. It seems like price continued to rise and that doesn't really invalidate the idea of an Ending Diagonal Pattern, but we have to see a short term buy before seeing the next drop on the XAUUSD chart. The pattern is still occurring on the wave (C) of a flat correction pattern.

LTIM: Elliott Wave ViewHey Guys !
Hope you all doing well, I really was busy in last 1 month and could not upload my views on the stocks.
Today seen the chart of LTIM (Larson and Toubro Infotech: Mindtree).
It had finished its 5 wave rally near 7588.80 on Jan 04.2022. Being in correction for the entire 2022, now it seems, it has completed its correction near 3733.30 on May 26.2022 (more than 50% from the all time high). Keeping that low as a reversal point I found a diagonal structure formed from May 26 2022 to Nov 15 2022, I have counted them as a five wave structure.
To me it looks, it already have corrected about 61.8% of the move from May 26 2022 to Nov 15 2022. In a diagonal structure we assume that a correction of nearly 61.8% to 78.6 % is a healthy correction.
So guys we can further see 4081.50 level if it correct 78.6% but in my view it seems it has given the signal of reversal.
My invalidation point will be 3733.30 that is the low of 26 May 2022.
This analysis is only for educational purpose any losses will be sole responsibility of the traders/investors.
Thank you for watching this chart. if you liked the analysis please hit boost button.
Regards

Crude Oil Can Stabilze At $70-$72 Markets are slow as most of traders will stay aside today after Thanksgiving yesterday in the US. So we think there will be no real changes in the price action and that market will stay in risk-on mode, at least from a technical perspective. The only thing that can shake the markets a bit going into a next week are potential new COVID restrictions in China after more cases were reported recently. Lower energy prices can also cause some volatility on CAD, NOK, and MXN after Saudi and Iraqi energy ministers said that they will introduce additional measures to ensure stability in the oil market. We see the energy coming down into the fifth wave of decline with some support seen at 72 area where the price may stabilize, at the lower side of a wedge pattern; a leading diagonal in wave A. In fact, weeks back the White House has released a fact sheet that establishes its intention to refill the Strategic Petroleum Reserve when oil prices are between $67 and $72, so yes, the downside can be limited.

ADAUSDT - Next move - Its about to explode !!!Hello, according to this wave count i think ADA will explode very soon.
We can see an ending diagonal finished and a potential wave 1 developing.
I found this structure LEADING DIAGONAL - ENDING DIAGONAL on other pairs (see TRXUSDT related idea)
Our strategy can be:
- Buy here and start to accumulate ADA every new low.
- Our invalidation point is 0.4025
Happy trading.
If this idea is helpfull please like and follow.

SPX500 - Inminent crash soon?This is not a trade.
According to this count a can see a clear leading diagonal.
Last week price broke last low (June 17) and is developing a strong impulse (wave 3)
Next targets could be 3132 and 2399
This means BTC will make new lows very soon.
If this idea is helpful please like, follow and share.
Best Regards.

Expanding scenario for SP500Looks like we're in the last leg of expanding leading diagonal with minimum target of 3,335
scenario must be watched to catch a sharp rebound after that kind of patterns finish.
Good luck!

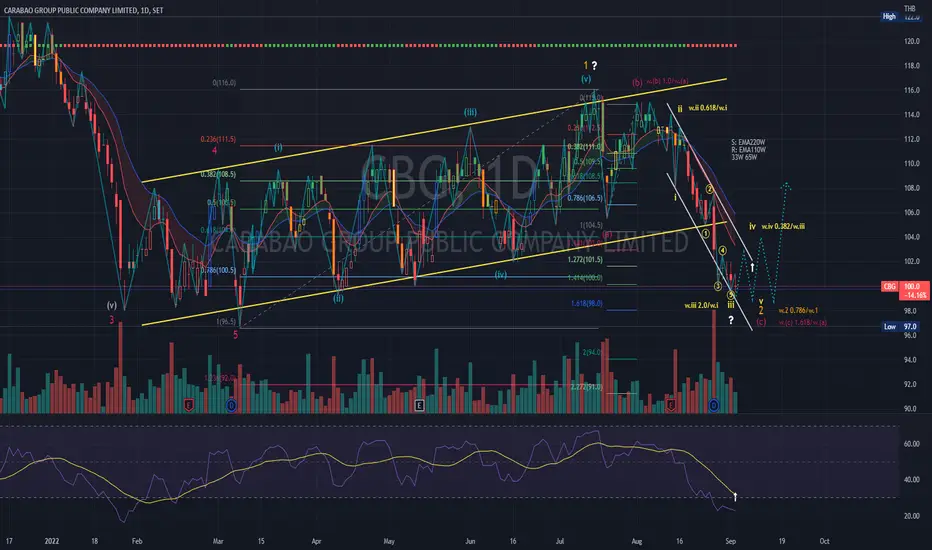
CBG | Wave Analysis | Leading Diagonal 2-Wave Price action and chart pattern trading setup
> A possible 2-wave leading diagonal pattern ending at 0.786 retracement zone
> Entry @ downtrend breakout with reversal pattern - watch for double bottom / inverse head & shoulders / triangle wave candlestick consolidation
> Target @ 0.786-1.0 retracement to previous 1-wave + 10 - 12%
> Stoploss @ the lowest position -4-5%
> Risk reward ratio: 2.5:1
Always trade with affordable risk and respect your stoploss

It's been a while since I provided an update on the Wyckoff ideaGood morning traders,
I have been a little busy recently, so haven't had chance to provide an update on my wyckoff accumulation idea.
As you can see on my chart, we are well and truly in to the new bullish trend that follows a wyckoff accumulation pattern and from the looks of things there is a Leading diagonal pattern forming, made up from waves and the sub waves within each wave.
As you can see my elliot waves have been measured and my targets for each wave marked up.
I believe the 5th purple wave will complete around $31,775 which is a key support/resistance level.
These waves I have marked up are minor waves and once the 5 wave cycle has completed, I believe this will be primary wave 1 which will be followed by a correction down to primary wave 2. What this will come down to will be determined once we know where the end of the primary wave 1 is and we can then measure the wave 2, which I will sure to provide an update for.
Please like and share my idea along with leaving your comments if you don't agree.
Happy trading 👍🏻
GDuB

WAVES/USD Elliott Wave countA perfect example of a leading diagonal.
This type of pattern is formed in the current conditions of the market when the buyers still do not have a great confidence, thus forming wave 1 of a higher degree in the Elliott Wave structure.
I will present the Fibonacci relations from such a pattern:
Wave 2 corrects in the area 0.768 of the Fibonacci retracement of wave 1;
Wave 3 rises to the area of the Fibonacci projection 0.768 of waves 1 and 2;
Wave 4 corrects in the area 0.768 of the Fibonacci retracement of wave 3;
Wave 5 could rise in the area of the Fibonacci projection 0.768 of waves 3 and 4; (Sometimes wave 5 can be truncated and shorter than the area where wave 3 ended).
So you can trade a long position up to the Fibonacci projection area of 0.768 of waves 3 and 4. After that you can also play short on the correction of wave 2 of higher degree. Success!
Like and subscribe if you like my analysis!
Also I will kepp do updates on the waves/usd because I like to trade it!

TOTAL Crypto cap - Mega support, 200MA + 0.382 FIB + MACD/RSI- It is a common thing to test the previous all time high (in this case from 2018) on the weekly chart.
- Last weekly candle has a huge wick, which is definitely a good sign for all bulls!
- 200 moving average is a strong support and the price is currently sitting on this level, which provides us with a good buying opportunity.
- 0.382 FIB retracement is also a noticable support level on the LOG scale.
- As per my Elliott Wave analysis - ABC correction should be completed on the macro scale and now we are ready for another bull market!
- We have a falling wedge - bullish reversal pattern or a bullish flag on the weekly chart.
- Indicators: RSI oversold and MACD first bullish tick.
- There is a tremendous confluence to buy cryptocurrencies at this moment!
- Look at my ideas about Bitcoin and Ethereum in the related section down below ↓
- For more content, please hit "Like" & "Follow"!

TOP | Wave Projection - Leading Diagonal Trading SetupPrice action and chart pattern trading
> Leading diagonal - contracting triangle pattern
> Entry @ triangle support
> Target @ Wave 3 position + 20% upside for short term trade
> RRR: 2:1 with -10% downside
> Long term trading target primary wave 5 at 1.618 extension zone at 75 baht +40% upside
Always trade with affordable risk and respect your stoploss
