Why the Market Loves to Trap Traders!!!If trading ever feels personal, it’s not.
The market isn’t hunting you; it’s hunting liquidity.
Understanding this single idea changes how you read charts forever.
1️⃣ The Market Moves Toward Liquidity, Not Logic
Most traders expect price to move because a pattern is “complete” or a level is “perfect.”
In reality, price moves to where orders are sitting.
Where is liquidity usually found?
- Above obvious highs
- Below obvious lows
- Around round numbers
- Near breakout levels everyone is watching
The market goes where the orders are, not where traders hope it goes.
2️⃣ Breakouts Are the Most Common Liquidity Pools
When price approaches a clear resistance, traders place:
- breakout buys above
- stop-losses from shorts just above
That creates a liquidity magnet.
Price spikes above the level, fills those orders…
and often reverses sharply once liquidity is consumed.
That’s not manipulation... that’s mechanics.
3️⃣ Traps Reveal Who’s Really in Control
A trap happens when price:
- breaks a key level
- fails to follow through
- returns back inside the range
This tells you something critical:
➡️ The side that should have won… didn’t.
4️⃣ Professionals Don’t Chase; They Wait
Retail traders react to the breakout.
Professionals wait for the reaction after the breakout.
They ask:
- Did price accept above the level?
- Did momentum expand or fade?
- Did structure shift or snap back?
Patience turns traps into opportunities.
📚The Core Lesson
The market’s job is not to reward anticipation. It’s to test conviction.
Once you stop trading where everyone else enters and start observing who gets trapped,
price action becomes clearer, calmer, and more logical.
⚠️ Disclaimer: This is not financial advice. Always do your own research and manage risk properly.
📚 Stick to your trading plan regarding entries, risk, and management.
Good luck! 🍀
All Strategies Are Good; If Managed Properly!
~Richard Nasr
Learn
Reading institutional intentions through Volume ProfileReading institutional intentions through Volume Profile
Price moves where money flows. Simple truth that most traders overlook the most obvious source of money information: volume.
Volume Profile shows where trading happened. Not when, but where. The histogram on the side reveals which levels attracted buyers and sellers. While beginners draw support lines by candle wicks, money flows elsewhere.
Value zones versus noise zones
Point of Control (POC) marks the price level with maximum trading volume for the period. Price spent most time here. Buyers and sellers agreed on this price. Fair value at this moment.
Value Area covers 70% of traded volume. Boundaries of this zone show where the market considers the asset undervalued or overvalued. Price gravitates back to Value Area like a magnet.
Look at the practice. Price broke the high, everyone expects growth. Check Volume Profile—volume on the breakout is tiny. Big players didn't participate. Fake breakout. Price will return.
High Volume Node and Low Volume Node
HVN appears as thick sections on the profile. Many transactions, lots of liquidity. Price slows down at HVN, reverses, consolidates. These are market anchors.
LVN shows as thin sections. Few transactions, little liquidity. Price flies through LVN like a hot knife through butter. Nothing to grab onto there.
Traders often place stops behind HVN. Big players know this. Sometimes price deliberately hits those stops to accumulate positions. Called stop hunt .
Profile types and their meaning
P-shaped profile: one wide POC in the middle, volume distributed evenly. Market in balance. Breaking boundaries of such profile produces strong moves.
b-shaped profile: volume shifted to the bottom. Buyers active at low levels. Accumulation before growth.
D-profile: volume at the top. Distribution before decline. Big players exit positions.
Using profile in trading
Find areas with low volume between zones of high volume. LVN between two HVNs creates a corridor for fast price movement. Enter at HVN boundary, target the next HVN.
When price moves outside Value Area boundaries and volume appears there—trend gains strength. New value zone forms. Old levels stop working.
If price returns to old Value Area after strong movement—look for reversal. Market rejects new prices.
Session profiles versus weekly ones
Daily profile shows where trading happened today. Weekly shows where positions accumulated all week. Monthly gives the picture of big money distribution.
Profiles of different periods overlay each other. Daily profile POC can match weekly Value Area boundary. Strong zone. Price will react here.
On futures, account for session times:
Asian session forms its profile
European forms its own
American forms its own, with heavier volume weight
Profile rotation
Price migrates between value zones. Old Value Area becomes support or resistance for the new one. Last week's POC works as a magnet on current week.
When profiles connect—market consolidates. When they separate—trend begins.
Volume and volatility
Low volume at some level means price didn't linger there. Passed quickly. On return to this level, reaction will be weak.
Volume grows at range boundaries. Battle of buyers and sellers happens there. Winner determines breakout direction.
Composite profile
Built from several trading days. Shows where main battle happened over the period. Removes noise of individual days. Picture becomes clearer.
Composite profile helps find long-term support and resistance zones. Monthly composite shows levels institutional traders will work from all next month.
Many traders build Volume Profile directly on Trading View charts. Adjust the period, watch volume distribution, plan trades.

Geopolitical Tensions & Trade Wars1. Understanding Geopolitical Tensions
Definition
Geopolitical tensions refer to conflicts or rivalries between nations that arise from differences in political systems, territorial claims, military strategies, or economic interests. These tensions often extend beyond diplomacy into military confrontations, sanctions, cyber warfare, and trade restrictions.
Key Drivers of Geopolitical Tensions
Territorial disputes – e.g., South China Sea, India-China border, Israel-Palestine conflict.
Resource competition – oil, natural gas, rare earth minerals, and even water supplies.
Ideological differences – democracy vs. authoritarianism, capitalism vs. socialism.
Technological dominance – battles over 5G, semiconductors, and artificial intelligence.
Strategic influence – the U.S. vs. China in Asia-Pacific, Russia vs. NATO in Eastern Europe.
Geopolitical tensions may not always escalate into war, but they often manifest as economic weapons, including tariffs, sanctions, and restrictions on trade.
2. What Are Trade Wars?
Definition
A trade war is an economic conflict between nations where countries impose tariffs, quotas, or other trade barriers against each other, often in retaliation. Instead of cooperating in the free exchange of goods and services, they use trade as a weapon to gain leverage.
Mechanisms of Trade Wars
Tariffs – taxes on imported goods (e.g., U.S. tariffs on Chinese steel).
Quotas – limits on the number of goods imported (e.g., Japan’s rice import restrictions).
Subsidies – financial aid to domestic industries, making exports cheaper.
Export controls – restricting key goods, like semiconductors or defense equipment.
Sanctions – blocking trade altogether with specific countries or entities.
Difference Between Trade Dispute and Trade War
A trade dispute is usually limited and negotiable (resolved via WTO).
A trade war escalates into repeated rounds of retaliatory measures, often causing collateral damage to global supply chains.
3. Historical Background of Trade Wars
Mercantilism in the 16th–18th centuries – European powers imposed heavy tariffs and colonized territories to control resources.
Smoot-Hawley Tariff Act (1930, USA) – raised tariffs on over 20,000 goods, worsening the Great Depression.
Cold War Trade Restrictions (1947–1991) – U.S. and Soviet blocs limited economic interaction, fueling technological and arms races.
Japan-U.S. Trade Tensions (1980s) – disputes over Japanese car and electronics exports to the U.S. led to tariffs and voluntary export restraints.
U.S.-China Trade War (2018–present) – the most significant modern trade war, involving hundreds of billions in tariffs, sanctions, and tech restrictions.
4. Causes of Trade Wars in the Modern Era
Economic Protectionism – shielding domestic industries from foreign competition.
National Security Concerns – restricting sensitive technologies like 5G, AI, and semiconductors.
Geopolitical Rivalry – economic weapons as part of larger power struggles (e.g., U.S. vs. China, Russia vs. NATO).
Unfair Trade Practices Allegations – accusations of currency manipulation, IP theft, or dumping.
Populism & Domestic Politics – leaders use trade wars to appeal to local voters by promising to "bring jobs back home."
5. Case Study: The U.S.-China Trade War
The U.S.-China trade war (2018–present) is the most important example of how geopolitical rivalry shapes global trade.
Phase 1 (2018): U.S. imposed tariffs on $50 billion worth of Chinese goods, citing unfair trade practices and intellectual property theft.
Retaliation: China imposed tariffs on U.S. agricultural products, especially soybeans, targeting American farmers.
Escalation: Tariffs expanded to cover $360+ billion worth of goods.
Technology Restrictions: U.S. banned Huawei and restricted semiconductor exports.
Phase 1 Agreement (2020): China promised to increase U.S. imports, but tensions remain unresolved.
Impact:
Global supply chains disrupted.
Rising inflation due to higher import costs.
Shift of manufacturing from China to Vietnam, India, and Mexico.
U.S. farmers and Chinese exporters both suffered losses.
6. Geopolitical Hotspots Affecting Trade
1. Russia-Ukraine War
Western sanctions cut Russia off from global finance (SWIFT ban, oil & gas restrictions).
Europe shifted away from Russian energy, sparking energy crises.
Global wheat and fertilizer exports disrupted, raising food inflation worldwide.
2. Middle East Conflicts
Oil is a geopolitical weapon—any conflict in the Persian Gulf impacts global crude prices.
OPEC+ decisions are often politically influenced, affecting both producers and consumers.
3. South China Sea
A vital shipping lane ($3.5 trillion in trade passes annually).
Territorial disputes between China and Southeast Asian nations raise risks of blockades.
4. Taiwan & Semiconductors
Taiwan produces over 60% of global semiconductors (TSMC).
Any conflict over Taiwan could paralyze global tech supply chains.
5. India-China Border & Indo-Pacific Rivalries
India bans Chinese apps and tightens investment rules.
Strengthening of Quad alliance (US, India, Japan, Australia) reshapes Asian trade.
7. Impact of Geopolitical Tensions & Trade Wars
1. On Global Economy
Slower global growth due to reduced trade flows.
Inflationary pressures from higher tariffs and supply disruptions.
Increased uncertainty reduces foreign direct investment (FDI).
2. On Businesses
Supply chain realignments (China+1 strategy).
Rising costs of raw materials and logistics.
Technology companies face export bans and restrictions.
3. On Consumers
Higher prices for imported goods (electronics, fuel, food).
Limited choices in the market.
4. On Financial Markets
Stock market volatility increases.
Commodity prices (oil, gold, wheat) spike during conflicts.
Currency fluctuations as investors seek safe havens (USD, gold, yen).
5. On Developing Nations
Export-dependent economies suffer as global demand falls.
Some benefit by replacing disrupted supply chains (e.g., Vietnam, India, Mexico).
8. The Role of International Institutions
World Trade Organization (WTO)
Provides a platform to resolve disputes.
However, its influence has declined due to U.S.-China disputes and non-compliance.
International Monetary Fund (IMF) & World Bank
Provide financial stability during crises.
Encourage open trade but have limited enforcement power.
Regional Trade Agreements
CPTPP, RCEP, EU, USMCA act as counterbalances to global tensions.
Countries diversify trade partnerships to reduce dependence on rivals.
9. Strategies to Manage Geopolitical Risks
Diversification of Supply Chains – "China+1" strategy by multinationals.
Hedging Against Commodity Risks – futures contracts for oil, wheat, etc.
Regionalization of Trade – building self-sufficient trade blocs.
Technology Independence – countries investing in local semiconductor and AI industries.
Diplomacy & Dialogue – ongoing talks via G20, BRICS, ASEAN, and other forums.
10. The Future of Geopolitical Tensions & Trade Wars
Rise of Economic Nationalism: Countries prioritizing local industries over globalization.
Technology Wars Intensify: AI, semiconductors, and green energy will be new battlegrounds.
Fragmentation of Global Trade: Shift from globalization to "regionalization" or "friend-shoring."
Energy Transition Risks: Conflicts over rare earth metals, lithium, and cobalt needed for batteries.
New Alliances: BRICS expansion, Belt & Road Initiative, and Indo-Pacific strategies will reshape global economic influence.
Conclusion
Geopolitical tensions and trade wars are not temporary disruptions but structural features of the modern global economy. While globalization created interdependence, it also exposed vulnerabilities. Trade wars, sanctions, and economic blockades have become powerful tools of foreign policy, often with far-reaching economic consequences.
For businesses and investors, the challenge lies in navigating uncertainty through diversification, resilience, and adaptation. For policymakers, the task is to strike a balance between protecting national interests and sustaining global cooperation.
Ultimately, the world may not return to the hyper-globalization era of the early 2000s. Instead, we are moving toward a multipolar trade system shaped by regional blocs, strategic rivalries, and technological competition. How nations manage these tensions will determine the stability and prosperity of the 21st-century global economy.
World Market Types 1. Stock Markets (Equity Markets)
The stock market is where people buy and sell shares of companies. A share means a small piece of a company.
Why it exists?
Companies need money to grow. They sell shares to the public. In return, investors can make money if the company does well.
Two parts:
Primary Market: Where new shares are first sold (IPO).
Secondary Market: Where old shares are bought and sold between investors.
Examples:
New York Stock Exchange (USA)
London Stock Exchange (UK)
National Stock Exchange (India)
👉 Simple Example: If you buy shares of Apple, you own a very tiny part of Apple.
2. Bond & Debt Markets
Bonds are like loans. Governments and companies borrow money from people. In return, they promise to pay interest.
Why it exists?
To fund big projects (like roads, airports) or business expansion.
Types of Bonds:
Government Bonds (very safe, like U.S. Treasuries).
Corporate Bonds (issued by companies).
Municipal Bonds (issued by cities).
Example: India issues “G-Secs” (Government Securities).
👉 Simple Example: If you buy a bond for ₹1,000, the government will return your money later and give you interest in the meantime.
3. Commodity Markets
Commodities are raw materials like gold, oil, wheat, or coffee.
Two ways to trade:
Spot Market: Immediate buying/selling.
Futures Market: Agreement to buy/sell at a fixed price in the future.
Examples:
Chicago Mercantile Exchange (USA)
Multi Commodity Exchange (India)
👉 Simple Example: A coffee company may buy coffee beans in advance to protect against future price hikes.
4. Foreign Exchange Market (Forex)
The forex market is where currencies are traded. It’s the biggest market in the world, with $7 trillion traded every day.
Why it exists?
For global trade. (India imports oil and pays in USD).
For travel (changing INR to USD or EUR).
For investment and speculation.
Examples: EUR/USD, USD/INR, GBP/USD pairs.
👉 Simple Example: When you travel abroad and exchange rupees for dollars, you are part of the forex market.
5. Derivatives Market
Derivatives are contracts whose value comes from something else (like stocks, gold, or currency).
Types:
Futures
Options
Swaps
Why it exists?
To manage risk.
To make profit through speculation.
👉 Simple Example: An airline can buy a futures contract for oil to protect against rising fuel costs.
6. Real Estate Market
This market is about buying, selling, or renting property (land, houses, offices, malls, factories).
Direct Way: Owning a house or land.
Indirect Way: Investing in REITs (Real Estate Investment Trusts), which let people invest in property without owning it directly.
👉 Simple Example: If you buy a flat in Mumbai, you are part of the real estate market.
7. Cryptocurrency Market
This is a new and fast-growing market. It deals with digital coins like Bitcoin and Ethereum.
Where it happens?
On exchanges like Binance, Coinbase, or decentralized apps (Uniswap).
Why it exists?
People use it for investment.
Some use it for payments.
Others use it for decentralized finance (DeFi).
👉 Simple Example: If you buy Bitcoin on Binance, you are in the crypto market.
8. Primary vs Secondary Markets
Primary Market: New shares/bonds are sold for the first time (IPO).
Secondary Market: Old shares/bonds are traded among investors (stock exchange).
👉 Simple Example: Buying Zomato shares during IPO = Primary. Buying Zomato shares on NSE later = Secondary.
9. Developed, Emerging, and Frontier Markets
Markets are also classified based on the country’s economy.
Developed Markets: Rich, stable, and safe. Examples: USA, UK, Japan.
Emerging Markets: Fast-growing but risky. Examples: India, Brazil, China.
Frontier Markets: Very small, risky, but full of potential. Examples: Vietnam, Nigeria.
👉 Simple Example: Investing in USA is safer, but investing in India may give higher returns.
10. Domestic, International, and Regional Markets
Domestic: Inside one country (NSE India).
International: Across countries (Forex, Eurobond).
Regional: Between groups of countries (EU Single Market, ASEAN).
👉 Simple Example: Trading only in India = Domestic. Trading USD/EUR = International.
11. OTC (Over-the-Counter) vs Exchange-Traded
Exchange-Traded: Official, transparent, with rules (Stock Exchange).
OTC: Directly between two parties, less regulated (Bond and Forex markets).
👉 Simple Example: Buying Reliance shares on NSE = Exchange. A bank selling USD to another bank = OTC.
12. Traditional vs Digital Markets
Traditional Markets: Face-to-face, physical trading pits.
Digital Markets: Online platforms, apps, and blockchain.
👉 Simple Example: Old stock exchanges used hand signals; now trades happen in seconds via computers.
13. Special Market Segments
Insurance Markets: For managing risks (life, health, property).
Carbon Credit Markets: For trading emission rights.
Art & Luxury Markets: Trading in paintings, collectibles, wine, etc.
14. Future of World Markets
Markets are changing fast. Some big trends are:
AI and Algorithmic Trading – Robots and AI make trades in microseconds.
Green & ESG Investing – Investors prefer eco-friendly companies.
Tokenization of Assets – Even property or art can be split into digital tokens.
Central Bank Digital Currencies (CBDCs) – Countries creating digital versions of money.
Conclusion
World markets are the backbone of global trade and investment. From stock markets in New York to commodity markets in Chicago, from bond markets in Europe to crypto markets online, each type of market serves a unique purpose.
Stock markets give companies money and investors ownership.
Bond markets provide loans to governments and companies.
Commodities markets keep global trade flowing.
Forex markets keep international payments possible.
Derivatives markets help manage risks.
Real estate and crypto open new doors for investors.
In simple words: Markets are where the world connects. They decide prices, move money, and drive economies forward.
Opportunities and Risks in Global MarketsSection 1: Opportunities in Global Markets
1.1 Expansion of International Trade
The lowering of trade barriers and rise of free-trade agreements have created enormous opportunities for companies to reach international consumers. Businesses can:
Diversify revenue sources beyond their domestic markets.
Scale production with access to global demand.
Benefit from competitive advantages like cheaper labor or raw materials in different regions.
For example, Asian electronics manufacturers sell across North America and Europe, while African agricultural producers tap into Middle Eastern and Asian demand.
1.2 Access to Capital Markets
Globalization has enabled firms to tap into international capital markets for funding. Companies can raise money through cross-border IPOs, bond issuances, and venture capital flows. Investors, in turn, gain exposure to high-growth markets like India, Africa, and Southeast Asia.
This cross-border capital flow:
Improves liquidity.
Reduces financing costs.
Helps small and medium enterprises (SMEs) scale faster.
1.3 Technological Innovation and Digital Markets
Technology is perhaps the biggest driver of modern opportunities:
E-commerce platforms like Amazon, Alibaba, and Flipkart have made global consumer bases accessible.
Fintech solutions such as digital payments, blockchain, and decentralized finance (DeFi) have transformed financial inclusion.
Artificial Intelligence (AI) and data analytics allow companies to forecast demand, optimize supply chains, and personalize customer experiences.
Digital markets also open up remote work opportunities, enabling firms to access global talent at lower costs.
1.4 Emerging Market Growth
Emerging economies such as India, Vietnam, Nigeria, and Brazil present massive opportunities due to:
Rising middle-class populations.
Expanding digital infrastructure.
Government reforms promoting business and investment.
These markets often offer higher returns compared to saturated developed economies, though with higher volatility.
1.5 Supply Chain Diversification
Globalization allows firms to diversify production bases. Instead of relying on a single country (e.g., China), companies are adopting a “China + 1” strategy by investing in Vietnam, India, or Mexico. This reduces risks while taking advantage of cost efficiency and new markets.
1.6 Sustainable and Green Finance
The transition to clean energy and sustainability has created a trillion-dollar opportunity. Investors and companies are increasingly focused on:
Renewable energy projects (solar, wind, hydrogen).
Carbon trading markets.
Sustainable investment funds (ESG-focused).
The global push toward net-zero emissions offers growth in sectors like electric vehicles, energy storage, and recycling technologies.
1.7 Cultural Exchange and Global Branding
Brands that succeed globally (Apple, Coca-Cola, Nike, Samsung) benefit from cultural globalization. A global presence not only increases revenues but also strengthens brand equity. Local firms can also “go global” by leveraging cultural exports (e.g., K-pop, Bollywood, anime).
Section 2: Risks in Global Markets
2.1 Economic Risks
Recession and Slowdowns: Global interconnectedness means downturns in one major economy ripple across the world (e.g., the 2008 financial crisis, COVID-19 pandemic).
Currency Volatility: Exchange rate fluctuations can erode profits in cross-border transactions. For instance, a strong U.S. dollar hurts emerging markets with dollar-denominated debt.
Inflation Pressures: Global commodity price spikes (oil, food) affect inflation, reducing purchasing power.
2.2 Geopolitical Risks
Geopolitics plays a decisive role in shaping market risks:
Trade wars (U.S.-China tariffs) disrupt global supply chains.
Sanctions on countries like Russia or Iran limit market access.
Military conflicts destabilize entire regions, raising commodity prices (e.g., oil during Middle East crises).
Nationalism and protectionism are reversing decades of globalization, creating uncertainty for investors.
2.3 Regulatory and Legal Risks
Differences in tax laws, intellectual property rights, and compliance frameworks create legal complexities.
Sudden regulatory changes—like India banning certain apps, or the EU imposing strict data privacy laws (GDPR)—can disrupt global operations.
2.4 Financial Market Volatility
Global markets are vulnerable to shocks from:
Speculative bubbles in stocks, bonds, or cryptocurrencies.
Interest rate hikes by central banks (like the U.S. Federal Reserve), which trigger global capital outflows from emerging markets.
Banking crises, which undermine investor confidence.
2.5 Technological Risks
While technology creates opportunities, it also brings risks:
Cybersecurity threats: Global firms are increasingly targets of hacking, ransomware, and data breaches.
Digital monopolies: A few tech giants dominate markets, creating anti-competitive concerns.
Automation risks: Job displacement caused by robotics and AI could destabilize labor markets.
2.6 Environmental and Climate Risks
Climate change disrupts agricultural production, supply chains, and insurance markets.
Extreme weather events damage infrastructure and raise commodity prices.
Firms face carbon taxation and regulatory costs in transitioning toward sustainability.
2.7 Social and Cultural Risks
Cultural misalignment: Global firms sometimes fail to adapt products to local preferences (e.g., Walmart’s exit from Germany).
Inequality: Globalization can widen the gap between rich and poor, fueling social unrest.
Demographics: Aging populations in developed economies (Japan, Europe) create labor shortages and higher social costs.
Section 3: Balancing Opportunities and Risks
To succeed in global markets, businesses and investors must adopt strategies that maximize opportunities while managing risks.
3.1 Risk Management Strategies
Hedging: Using derivatives to protect against currency and commodity risks.
Diversification: Investing in multiple markets and asset classes to spread risk.
Scenario Planning: Preparing for political, economic, and technological disruptions.
Local Partnerships: Collaborating with local firms to navigate regulations and cultural differences.
3.2 Role of Governments and Institutions
Global governance bodies like WTO, IMF, and World Bank ensure smoother trade and financial stability.
Central banks influence global capital flows through monetary policies.
Regional trade blocs (EU, ASEAN, NAFTA) create stability and cooperation.
3.3 Technological Adaptation
Firms must invest in cybersecurity to safeguard against digital risks.
Adoption of AI and automation should balance efficiency with social responsibility.
Data compliance is essential in markets with strict privacy laws.
3.4 Sustainability as a Competitive Edge
Firms that embrace ESG (Environmental, Social, Governance) principles not only mitigate regulatory risks but also attract investors. Green finance, circular economy practices, and carbon neutrality commitments enhance long-term profitability.
Section 4: Future Outlook
The global market of the next decade will be shaped by megatrends:
Shift of economic power to Asia and Africa – China, India, and Africa will drive consumption growth.
Digital economy dominance – AI, blockchain, metaverse, and fintech will redefine global commerce.
Climate transition economy – Renewable energy, carbon markets, and sustainable finance will become mainstream.
Geopolitical fragmentation – Competing power blocs may create parallel financial and trade systems.
Hybrid supply chains – “Friend-shoring” and regionalization will coexist with globalization.
The winners will be firms and investors who are adaptive, diversified, and innovative.
Conclusion
The global market is a double-edged sword—full of unprecedented opportunities but also fraught with significant risks. Opportunities arise from trade liberalization, digital transformation, emerging markets, and sustainability, while risks emerge from volatility, geopolitical conflicts, regulatory challenges, and climate change.
Ultimately, success in the global marketplace depends on the ability to balance opportunity with risk management. Companies, investors, and governments must act with foresight, agility, and resilience to navigate this ever-changing landscape.
In a hyper-connected world, those who can adapt to technological, economic, and geopolitical shifts will thrive, while those who remain rigid may struggle. Global markets are not just about chasing profits; they are about building sustainable, resilient systems that create long-term value.

Stock Market Crashes & Their Global ImpactIntroduction
Stock markets are often described as the heartbeat of modern economies. They reflect investor confidence, corporate performance, and broader macroeconomic conditions. When markets rise steadily, optimism spreads across societies—businesses expand, jobs are created, and wealth grows. But when they crash, the opposite happens: wealth evaporates, panic sets in, and economies often spiral into recession or even depression.
A stock market crash is typically defined as a sudden, dramatic decline in stock prices across major indexes, often accompanied by panic selling and loss of investor confidence. Crashes are not mere financial events; they ripple through entire economies, affecting employment, government policies, trade, and even geopolitical stability.
This essay explores the history of major crashes, their causes, consequences, and the global impact they leave behind. It also discusses the lessons learned and whether crashes can be prevented—or if they are an unavoidable feature of capitalism.
Understanding Stock Market Crashes
A stock market crash differs from a normal market correction. A correction is usually a modest decline (around 10–20%), often seen as healthy after strong rallies. A crash, however, is sudden and severe, typically involving a drop of 20% or more in a very short time.
Key characteristics of a crash include:
Panic selling – Investors rush to liquidate holdings, driving prices down further.
Liquidity crisis – Buyers disappear, making it difficult to sell assets at fair value.
Systemic contagion – Losses spread to other sectors like banking, housing, and commodities.
Psychological impact – Fear and loss of trust in financial systems exacerbate the downturn.
Historical Stock Market Crashes
1. The Panic of 1907
Triggered by a failed attempt to corner the copper market, the 1907 crash caused bank runs across the U.S. The absence of a central bank made matters worse until J.P. Morgan personally intervened to provide liquidity. The crisis directly led to the creation of the U.S. Federal Reserve in 1913.
2. The Great Depression (1929–1939)
The crash of October 1929 is the most infamous. The Dow Jones lost almost 90% of its value from peak to trough. Banks failed, unemployment in the U.S. reached 25%, and global trade collapsed as protectionist tariffs rose. The Great Depression reshaped the global order and gave rise to both welfare capitalism and extreme political movements.
3. Black Monday (1987)
On October 19, 1987, global markets lost trillions in value, with the Dow plunging 22% in a single day—the largest one-day percentage drop in history. Interestingly, the economic fundamentals were relatively strong, but computerized program trading amplified panic. This crash led to better circuit-breaker mechanisms.
4. Dot-Com Bubble (2000–2002)
Fueled by excessive speculation in internet startups, tech stocks soared in the late 1990s. When profitability didn’t match expectations, the bubble burst, erasing $5 trillion in market value. Many companies went bankrupt, but survivors like Amazon and Google emerged stronger.
5. Global Financial Crisis (2008–2009)
Triggered by the collapse of the U.S. housing bubble and subprime mortgages, this crash nearly collapsed the global banking system. Lehman Brothers’ bankruptcy sent shockwaves worldwide. Governments had to bail out banks, and trillions were injected into economies. The aftershocks shaped global monetary policy for over a decade.
6. COVID-19 Pandemic Crash (2020)
In March 2020, as the pandemic spread globally, markets experienced one of the fastest declines in history. Supply chains froze, oil prices collapsed, and entire economies went into lockdown. Central banks intervened with massive liquidity injections, and markets rebounded faster than expected, though inequality widened.
Causes of Stock Market Crashes
Speculative Bubbles – Excessive optimism leads investors to drive prices far beyond intrinsic values (e.g., tulip mania, dot-com bubble).
Leverage & Debt – Borrowed money magnifies gains but also magnifies losses when markets turn.
Banking Failures – Weak banking systems spread panic when liquidity dries up.
Geopolitical Events – Wars, oil shocks, or political instability can trigger sudden sell-offs.
Technological Factors – Automated trading systems can accelerate crashes.
Psychological Herding – Fear and greed amplify movements, leading to irrational decisions.
Economic & Social Consequences
A market crash is not just numbers falling on screens; it creates real-world damage:
Wealth Destruction – Households lose savings, pensions shrink, and corporate valuations collapse.
Unemployment – Businesses cut back, leading to layoffs and wage stagnation.
Banking Stress – Non-performing loans rise, banks tighten credit, stifling growth.
Government Debt – States often borrow heavily to stabilize economies, leading to long-term fiscal challenges.
Social Unrest – Rising inequality, poverty, and frustration often trigger protests and political upheaval.
Shift in Global Power – Crashes can weaken one region while strengthening another (e.g., U.S. decline in 1930s, rise of Europe and later Asia).
Global Ripple Effects
Stock markets are interconnected; a crash in one major market spills over into others.
Trade Decline: Reduced demand lowers imports/exports, hurting global supply chains.
Currency Volatility: Investors flee to safe havens like gold, U.S. treasuries, or the Swiss franc.
Capital Flight: Emerging markets often see massive outflows during global downturns.
Policy Shifts: Central banks coordinate interventions, lowering rates and providing stimulus.
Geopolitical Shifts: Crashes often weaken alliances, spark nationalism, or accelerate the rise of new powers.
Case Study: 2008 Crisis Global Impact
U.S.: Housing collapse, unemployment peaking at 10%, massive bailouts.
Europe: Sovereign debt crises in Greece, Spain, and Italy.
Asia: Export-driven economies like China saw slowed growth, but also emerged as stronger alternatives to Western dependence.
Developing Nations: Suffered from falling commodity prices, reduced remittances, and currency instability.
This showed how deeply integrated the global economy had become.
Lessons Learned
Stronger Regulation – The 2008 crash showed the need for tighter oversight of derivatives and shadow banking.
Central Bank Coordination – Global central banks now act in unison to stabilize liquidity.
Risk Management – Investors are more cautious about leverage and speculative excess.
Diversification – Global portfolios help mitigate region-specific risks.
Psychological Awareness – Understanding behavioral finance helps explain panic-driven moves.
Are Crashes Preventable?
History suggests crashes are not entirely preventable because markets are built on human behavior, which swings between fear and greed. However, their severity can be managed:
Circuit breakers and trading halts prevent extreme panic.
Transparent regulation reduces systemic risk.
Global cooperation cushions shocks.
Investor education lowers herd mentality.
The Future of Stock Market Crashes
Looking ahead, new risks emerge:
Algorithmic & AI Trading – Speed of trading could magnify volatility.
Cryptocurrency Integration – Digital assets could create new bubbles.
Climate Change – Extreme weather could disrupt industries, creating market shocks.
Geopolitical Tensions – Trade wars, cyber conflicts, and resource scarcity may fuel future crises.
While markets will continue to experience crashes, societies are better equipped to handle them—though not immune.
Conclusion
Stock market crashes are dramatic reminders of the fragility of financial systems. They destroy wealth, disrupt lives, and alter the trajectory of nations. From the Great Depression to COVID-19, each crash has reshaped global finance, politics, and society.
Yet, paradoxically, crashes also pave the way for renewal. They expose weaknesses, force reforms, and create opportunities for resilient businesses to thrive. In this sense, crashes are not just destructive—they are part of capitalism’s self-correcting cycle.
For investors, policymakers, and citizens, the lesson is clear: crashes cannot be avoided, but their impact can be mitigated through preparation, diversification, and prudent regulation. The challenge is not to eliminate volatility but to ensure societies are resilient enough to withstand it.
Global Private Equity Trends1. Introduction
Private equity (PE) has emerged as one of the most powerful forces in global finance. Over the last four decades, it has transformed from a niche investment strategy practiced by a handful of firms into a multi-trillion-dollar asset class that shapes industries, creates jobs, restructures companies, and influences the broader global economy.
The private equity model—raising capital from institutional investors, acquiring or investing in private companies, actively managing them, and ultimately exiting at a profit—has proven highly successful. Today, pension funds, sovereign wealth funds, university endowments, and family offices rely on private equity as a key component of their portfolios.
But the private equity industry is not static. It evolves in response to macroeconomic conditions, technological innovation, regulatory shifts, and investor demands. In recent years, global private equity trends have reflected both challenges—rising interest rates, geopolitical instability, inflation—and opportunities—digital transformation, ESG investing, and emerging market growth.
2. Historical Evolution of Private Equity
The origins of private equity date back to the mid-20th century. In the 1940s and 1950s, early venture capital firms in the U.S. funded technology startups and post-war industrial companies. The modern private equity boom began in the 1980s, with leveraged buyouts (LBOs) making headlines—most famously the $25 billion buyout of RJR Nabisco by KKR in 1989.
The 1990s saw PE expand into Europe and Asia, with institutional investors increasingly allocating capital. By the 2000s, private equity had become mainstream, with mega-funds raising tens of billions of dollars. The global financial crisis of 2008 slowed activity, but the industry rebounded strongly in the 2010s, fueled by low interest rates and abundant liquidity.
By the 2020s, private equity assets under management (AUM) exceeded $10 trillion, cementing its role as a dominant force in global finance.
3. The Global Scale of Private Equity
As of 2024, global private equity AUM is estimated to exceed $12 trillion, making it one of the fastest-growing segments of the alternative investment universe. North America remains the largest hub, followed by Europe and Asia-Pacific. However, new regions—such as the Middle East and Africa—are increasingly attracting investor interest.
Private equity firms vary in size, from global giants like Blackstone, KKR, Carlyle, and Apollo, to specialized boutique firms focused on specific sectors or geographies. This diversity contributes to a wide spectrum of investment strategies, from billion-dollar buyouts to small growth-capital investments.
4. Key Drivers of Private Equity Growth
Several forces underpin the rise of private equity:
Institutional Investor Demand: Pension funds and sovereign wealth funds allocate heavily to private equity for higher returns compared to public markets.
Low Public Market Returns: Sluggish equity markets push investors toward alternative assets.
Operational Value Creation: Unlike passive stockholders, PE firms actively manage portfolio companies, improving efficiency and profitability.
Globalization of Capital: Cross-border deals and global funds create opportunities beyond domestic markets.
Technological Innovation: PE firms increasingly invest in tech-driven companies and use data analytics to enhance decision-making.
5. Regional Trends in Private Equity
North America
The U.S. remains the largest and most mature private equity market.
Mega-funds dominate, but mid-market firms thrive in niche strategies.
Strong focus on technology, healthcare, and financial services.
Europe
Regulatory oversight is stronger, especially post-Brexit.
Countries like the U.K., Germany, and France are major PE hubs.
Infrastructure and ESG-driven deals are gaining traction.
Asia-Pacific
China and India are hotbeds of growth equity and venture deals.
Japan and South Korea are seeing more buyouts.
Sovereign wealth funds in Singapore and the Middle East play key roles as LPs.
Middle East & Africa
The Gulf states, especially Saudi Arabia and the UAE, are deploying sovereign wealth funds into global private equity.
Africa offers opportunities in infrastructure, fintech, and consumer markets, though risks remain high.
Latin America
Brazil and Mexico are leading PE markets.
Focus on energy, fintech, and consumer growth stories.
Political instability is a limiting factor.
6. Sectoral Trends in Private Equity
Technology
Cloud computing, cybersecurity, fintech, and AI startups attract significant PE capital.
Many PE firms are setting up tech-dedicated funds.
Healthcare
Aging populations and post-pandemic healthcare reforms drive investments.
Biotech, pharmaceuticals, and healthcare services are hotspots.
Infrastructure & Energy
Renewable energy projects are a major PE focus, especially in Europe and Asia.
Infrastructure funds targeting transport, logistics, and utilities are growing.
Consumer & Retail
PE firms are adapting to e-commerce-driven retail models.
Luxury brands and lifestyle companies remain attractive.
Financial Services
Fintech and digital banking are top priorities.
Insurance and asset management firms are also targets for buyouts.
7. Deal-Making Trends
Buyouts: Leveraged buyouts remain the backbone of PE, though high interest rates challenge traditional models.
Growth Equity: Rising interest in scaling innovative companies without full buyouts.
Venture Capital Convergence: Many PE firms are moving into late-stage venture deals.
Distressed & Special Situations: Economic uncertainty creates opportunities in restructuring and distressed debt.
Secondary Market Deals: The secondary market for PE fund stakes has grown into a $100+ billion segment.
8. Fundraising Dynamics
Mega-Funds vs. Mid-Market: Mega-funds raise over $20 billion each, while mid-market players thrive in niche areas.
Niche & Sector-Specific Funds: Focus on technology, ESG, healthcare, and infrastructure.
ESG & Impact Funds: Increasingly popular among institutional investors seeking responsible investing.
9. Exit Strategies
IPOs: Still attractive, though public market volatility poses challenges.
Strategic Sales: Corporations buying PE-backed firms remain a strong exit path.
Secondary Buyouts: Common in mature markets where PE firms sell to other PE players.
Recapitalizations: Partial exits allow firms to return capital while retaining ownership.
10. Role of Technology & Data in Private Equity
AI and machine learning enhance deal sourcing, due diligence, and risk assessment.
Big data analytics improve operational oversight of portfolio companies.
Digital transformation is now a value-creation strategy, not just a risk factor.
Conclusion
Private equity has grown into a cornerstone of global finance, shaping economies and industries. While challenges remain—rising interest rates, regulatory hurdles, and geopolitical risks—the long-term growth story of private equity remains intact. Its adaptability, global reach, and ability to create value beyond capital injection make it an enduring force.
Looking ahead, the industry will continue to evolve—becoming more technology-driven, more sustainability-focused, and more globally interconnected. For investors, entrepreneurs, and policymakers, understanding private equity trends is essential to navigating the future of finance.

Global Agricultural Commodities MarketWhat Are Agricultural Commodities?
Agricultural commodities are raw, unprocessed products grown or raised to be sold or exchanged. They fall broadly into two categories:
Food Commodities
Grains & cereals: Wheat, rice, maize, barley, oats.
Oilseeds: Soybeans, rapeseed, sunflower, groundnut.
Fruits & vegetables: Bananas, citrus, potatoes, onions.
Livestock & animal products: Beef, pork, poultry, dairy, eggs.
Tropical commodities: Coffee, cocoa, tea, sugar.
Non-Food Commodities
Fibers: Cotton, jute, wool.
Biofuel crops: Corn (ethanol), sugarcane (ethanol), palm oil, soy oil (biodiesel).
Industrial crops: Rubber, tobacco.
These commodities are traded on spot markets (immediate delivery) and futures markets (contracts for future delivery). Futures trading, which developed in places like Chicago and London, allows farmers and buyers to hedge against price fluctuations.
Historical Context of Agricultural Commodities Trade
Ancient Trade: The Silk Road and spice trade routes included agricultural goods like rice, spices, and tea. Grain storage and trade were central to the Roman Empire and ancient Egypt.
Colonial Era: European colonial powers built empires around commodities like sugar, cotton, tobacco, and coffee.
20th Century: Mechanization, the Green Revolution, and globalization expanded agricultural production and trade.
21st Century: Digital platforms, biotechnology, and sustainability initiatives shape modern agricultural commodity markets.
This long history shows how agriculture is not just economic, but political and cultural.
Key Players in the Global Agricultural Commodities Market
Producers (Farmers & Agribusinesses): Smallholder farmers in Asia and Africa; large-scale industrial farms in the U.S., Brazil, and Australia.
Traders & Merchants: Multinational corporations known as the ABCD companies—Archer Daniels Midland (ADM), Bunge, Cargill, and Louis Dreyfus—dominate global grain and oilseed trade.
Governments & Agencies: World Trade Organization (WTO), Food and Agriculture Organization (FAO), national agricultural boards.
Financial Institutions & Exchanges: Chicago Board of Trade (CBOT), Intercontinental Exchange (ICE), and hedge funds/speculators who trade futures.
Consumers & Industries: Food processing companies, retailers, biofuel producers, and ultimately, households.
Major Agricultural Commodities and Their Markets
1. Cereals & Grains
Wheat: Staple for bread and pasta, major producers include Russia, the U.S., Canada, and India.
Rice: Lifeline for Asia; grown largely in China, India, Thailand, and Vietnam.
Corn (Maize): Used for food, feed, and ethanol; U.S. and Brazil dominate exports.
2. Oilseeds & Oils
Soybeans: Key protein for animal feed; U.S., Brazil, and Argentina lead.
Palm Oil: Major in Indonesia and Malaysia; used in food and cosmetics.
Sunflower & Rapeseed Oil: Important in Europe, Ukraine, and Russia.
3. Tropical Commodities
Coffee: Produced mainly in Brazil, Vietnam, Colombia, and Ethiopia.
Cocoa: Critical for chocolate; grown in West Africa (Ivory Coast, Ghana).
Sugar: Brazil, India, and Thailand dominate.
4. Livestock & Dairy
Beef & Pork: U.S., Brazil, China, and EU major players.
Poultry: Fastest-growing meat sector, strong in U.S. and Southeast Asia.
Dairy: New Zealand, EU, and India lead in milk and milk powder exports.
5. Fibers & Industrial Crops
Cotton: Vital for textiles; India, U.S., and China are leading producers.
Rubber: Largely grown in Southeast Asia for tires and industrial use.
Factors Influencing Agricultural Commodity Markets
Weather & Climate: Droughts, floods, hurricanes, and heatwaves strongly affect supply.
Technology: Mechanization, biotechnology (GM crops), digital farming, and precision agriculture boost productivity.
Geopolitics: Wars, sanctions, and trade disputes disrupt supply chains (e.g., Russia-Ukraine war and wheat exports).
Currency Fluctuations: Commodities are priced in USD; exchange rates impact competitiveness.
Government Policies: Subsidies, tariffs, price supports, and export bans affect markets.
Consumer Demand: Rising demand for protein, organic food, and biofuels shapes production.
Speculation: Futures and derivatives markets amplify price volatility.
Supply Chain of Agricultural Commodities
Production (Farmers).
Collection (Local traders & cooperatives).
Processing (Milling, crushing, refining).
Storage & Transportation (Warehouses, silos, shipping lines).
Trading & Export (Grain merchants, commodity exchanges).
Retail & Consumption (Supermarkets, restaurants, households).
The supply chain is global—soybeans grown in Brazil may feed livestock in China, which supplies meat to Europe.
Global Trade in Agricultural Commodities
Top Exporters: U.S., Brazil, Argentina, Canada, EU, Australia.
Top Importers: China, India, Japan, Middle East, North Africa.
Trade Routes: Panama Canal, Suez Canal, Black Sea, and major ports like Rotterdam, Shanghai, and New Orleans.
Agricultural trade is often uneven—developed nations dominate exports, while developing nations rely heavily on imports.
Price Volatility in Agricultural Commodities
Agricultural commodities are highly volatile due to:
Seasonal cycles of planting and harvest.
Weather shocks (El Niño, La Niña).
Energy prices (fertilizers, transport).
Speculative trading on futures markets.
Volatility impacts both farmers’ incomes and consumers’ food security.
Role of Futures and Derivatives Markets
Commodity exchanges such as CBOT (Chicago), ICE (New York), and NCDEX (India) allow:
Hedging: Farmers and buyers reduce risk by locking in prices.
Speculation: Traders bet on price movements, adding liquidity but also volatility.
Price Discovery: Futures prices signal supply-demand trends.
Challenges Facing the Global Agricultural Commodities Market
Climate Change: Increased droughts, floods, and pests reduce yields.
Food Security: Rising global population (10 billion by 2050) requires 50% more food production.
Trade Wars & Protectionism: Export bans (e.g., rice from India, wheat from Russia) destabilize markets.
Sustainability: Deforestation for soy and palm oil, pesticide use, and water scarcity are major concerns.
Market Power Concentration: Few large corporations dominate, raising fairness concerns.
Infrastructure Gaps: Poor roads, ports, and storage in developing nations lead to waste.
Future Trends in Agricultural Commodities Market
Sustainability & ESG: Demand for eco-friendly, deforestation-free, and fair-trade commodities.
Digitalization: Blockchain for traceability, AI for crop forecasting, precision farming.
Biofuels & Renewable Energy: Growing role of corn, sugarcane, and soy in energy transition.
Alternative Proteins: Lab-grown meat, plant-based proteins reducing demand for livestock feed.
Regional Shifts: Africa emerging as a key producer and consumer market.
Climate-Resilient Crops: GM crops resistant to drought, pests, and diseases.
Case Studies
Russia-Ukraine War (2022–2025): Disrupted global wheat, corn, and sunflower oil supply, driving food inflation.
COVID-19 Pandemic (2020): Supply chain breakdowns exposed vulnerabilities in agricultural trade.
Palm Oil in Indonesia: Tensions between economic growth and environmental concerns over deforestation.
Conclusion
The global agricultural commodities market is one of the most important pillars of the world economy. It determines food security, influences geopolitics, and drives livelihoods for billions of farmers. However, it is also one of the most vulnerable markets—shaped by climate change, population growth, technological advances, and political instability.
In the future, balancing food security, sustainability, and fair trade will be the central challenge. With the right policies, innovation, and cooperation, agricultural commodity markets can continue to feed the world while protecting the planet.

Role of WTO in International TradeIntroduction
International trade is the backbone of the global economy. Countries depend on each other for raw materials, technology, consumer goods, and services. To ensure that this complex web of exchanges remains smooth, fair, and beneficial for all, there must be rules, institutions, and mechanisms for dispute resolution. The World Trade Organization (WTO) plays this central role.
Established in 1995, the WTO replaced the General Agreement on Tariffs and Trade (GATT), which had guided world trade since 1948. Today, it is the only global international organization dealing with the rules of trade between nations. Its primary goal is to help producers of goods and services, exporters, and importers conduct business with as little friction as possible.
The WTO functions as both a forum for trade negotiations and a dispute settlement body. Its agreements, signed by the majority of trading nations, cover not just goods but also services and intellectual property rights. With 164 member countries (as of 2025), representing more than 98% of global trade, the WTO is a critical pillar of globalization.
This essay explores in detail the role of the WTO in international trade, covering its objectives, functions, agreements, dispute settlement system, impact on developed and developing nations, criticisms, and the challenges it faces in the 21st century.
Historical Background
From GATT to WTO
1947: The General Agreement on Tariffs and Trade (GATT) was established after World War II to encourage trade liberalization and economic recovery.
Focus: GATT dealt primarily with trade in goods and sought to reduce tariffs and quotas.
Limitations: GATT was a provisional arrangement and lacked strong enforcement mechanisms. It struggled to handle new trade areas like services, intellectual property, and agriculture.
Creation of the WTO
Uruguay Round (1986–1994): After years of negotiations, member countries agreed to create a stronger institution.
1995: The WTO officially replaced GATT. Unlike GATT, the WTO had a permanent institutional framework, a wider scope, and stronger dispute settlement powers.
Objectives of the WTO
The WTO’s objectives are enshrined in its founding agreements. Some of the key goals include:
Promote Free and Fair Trade
Reduce trade barriers (tariffs, quotas, subsidies).
Ensure equal opportunities for all trading partners.
Establish a Rules-Based System
Provide a transparent, predictable framework for international trade.
Encourage Economic Growth and Employment
Facilitate trade flows that contribute to global economic expansion.
Protect and Preserve the Environment
Ensure trade rules align with sustainable development.
Integrate Developing and Least Developed Countries (LDCs)
Provide special provisions to help them benefit from global trade.
Functions of the WTO
The WTO carries out several critical functions that shape the global trading system:
1. Administering Trade Agreements
The WTO oversees a vast set of agreements that cover goods, services, and intellectual property rights.
Examples: GATT 1994, General Agreement on Trade in Services (GATS), Trade-Related Aspects of Intellectual Property Rights (TRIPS).
2. Acting as a Forum for Trade Negotiations
Members negotiate trade liberalization, new agreements, and reforms.
Example: The ongoing Doha Development Round focused on agricultural subsidies and development issues.
3. Handling Trade Disputes
The WTO provides a structured dispute settlement mechanism.
Example: The US-EU dispute over subsidies to Boeing and Airbus was handled by WTO panels.
4. Monitoring National Trade Policies
Through the Trade Policy Review Mechanism (TPRM), WTO evaluates members’ trade policies to ensure transparency.
5. Technical Assistance and Training
WTO supports developing and least-developed countries by offering training, capacity-building, and special provisions.
6. Cooperation with Other International Institutions
Works with IMF, World Bank, and UN to coordinate trade and financial stability.
WTO Agreements and Coverage
The WTO’s framework is built on a comprehensive set of agreements covering multiple areas of trade.
1. Trade in Goods (GATT 1994)
Rules governing tariffs, quotas, subsidies, anti-dumping measures.
Special agreements on agriculture, textiles, and sanitary measures.
2. Trade in Services (GATS)
Covers sectors like banking, telecommunications, transport, education, and healthcare.
Promotes liberalization of service industries across borders.
3. Intellectual Property Rights (TRIPS)
Protects patents, trademarks, copyrights, and trade secrets.
Ensures innovation while balancing access, especially for medicines.
4. Dispute Settlement Understanding (DSU)
Provides legally binding dispute resolution through panels and an appellate body.
Ensures compliance with rulings.
5. Plurilateral Agreements
Not binding on all members, but important in niche areas.
Example: Agreement on Government Procurement (GPA).
Role of WTO in Promoting International Trade
1. Trade Liberalization
WTO promotes lowering of tariffs and non-tariff barriers.
Example: The Information Technology Agreement (ITA) eliminated tariffs on IT products.
2. Ensuring Fair Competition
Prevents unfair practices like dumping and excessive subsidies.
Allows safeguard measures when domestic industries are threatened.
3. Dispute Resolution
Provides a neutral, rules-based process for settling trade conflicts.
Avoids trade wars and unilateral retaliations.
4. Encouraging Transparency
Members must notify trade measures and policies.
Enhances predictability for businesses.
5. Helping Developing Countries
Special and Differential Treatment (SDT) provisions allow flexibility.
Example: Longer time frames for implementing commitments.
Case Studies of WTO’s Role
1. US–China Trade Disputes
Numerous disputes over intellectual property rights, tariffs, and subsidies.
WTO acted as a mediator, though recent tensions have tested its authority.
2. Bananas Dispute (EU vs. Latin American Countries)
EU’s banana import regime discriminated against Latin American exporters.
WTO panels ruled in favor of Latin American countries.
3. India’s Solar Panels Case
US challenged India’s domestic content requirements for solar power.
WTO ruled against India, showing the clash between trade rules and environmental goals.
Role for Developing and Least Developed Countries
The WTO plays a crucial role in integrating developing nations into global trade.
Market Access: WTO commitments open markets for exports.
Capacity Building: Technical assistance and training programs.
Flexibility: Longer transition periods for reforms.
Special Safeguards: Protection for vulnerable sectors like agriculture.
Example: African nations benefit from WTO’s Aid for Trade initiative.
Criticisms of the WTO
Despite its role, the WTO faces significant criticism:
Favoring Developed Nations
Rules on intellectual property and subsidies often benefit wealthy countries.
Stalled Negotiations
The Doha Round has been largely unsuccessful due to disagreements.
Dispute Settlement Crisis
Since 2019, the Appellate Body has been paralyzed because the US blocked appointments.
Environmental Concerns
Critics argue WTO prioritizes trade over climate change and sustainability.
Limited Inclusiveness
Small economies struggle to influence negotiations dominated by large economies.
Challenges for WTO in the 21st Century
Rise of Protectionism
Trade wars (e.g., US-China) undermine WTO rules.
Digital Trade and E-commerce
WTO lacks comprehensive rules for cross-border digital trade.
Climate Change and Sustainability
Balancing environmental protection with trade liberalization.
Geopolitical Tensions
Rivalries between major economies weaken global consensus.
Reform of Dispute Settlement
Restoring credibility by fixing the Appellate Body crisis.
Future Role of WTO
The WTO must evolve to remain relevant:
Revive Multilateralism: Rebuild trust in global trade rules.
Strengthen Dispute Resolution: Restore a fully functioning appellate system.
Adapt to Digital Trade: Frame rules for e-commerce, data flows, and digital taxation.
Promote Inclusive Growth: Ensure benefits reach developing and least-developed countries.
Support Green Trade: Align trade rules with climate commitments.
Conclusion
The World Trade Organization remains a cornerstone of international trade. Since 1995, it has provided a rules-based system that promotes predictability, reduces trade barriers, and offers a platform for resolving disputes. It has played a vital role in integrating developing nations into the global economy.
However, its credibility has been challenged by stalled negotiations, the crisis in dispute settlement, and rising protectionism. The future of the WTO depends on its ability to reform, embrace digital trade, support sustainability, and balance the interests of both developed and developing nations.
In an interconnected world, no country can afford to isolate itself from global trade. The WTO, despite its shortcomings, is indispensable in ensuring that trade remains a force for prosperity, cooperation, and peace.

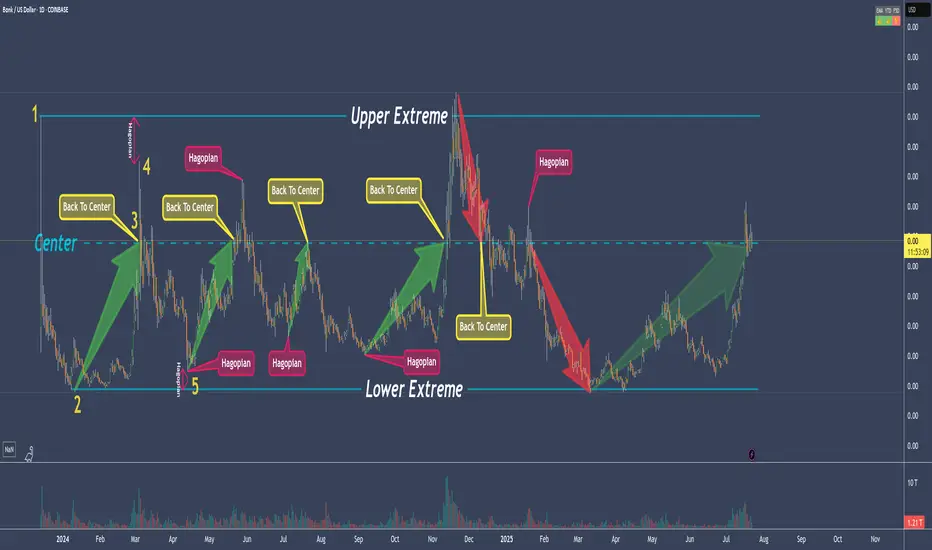
80% Of Time - A Trading Edge You Don't Want To MissDo you want to know why trading with median lines, also known as pitchforks, can be so successful? It’s simple:
Prices swing from one extreme back to the middle.
From the middle, they often swing to the other extreme.
What do we see on the chart?
- The upper extreme
- The center
- The lower extreme
So far, so good.
Now let’s follow the price and learn a few important rules that belong to the rulebook of median lines/pitchforks, and with which you can make great trades.
Point 1
The price starts and is sold off down to…
Point 2
...and from there starts to rise again, up to…
Point 3
...which is the center. And here we have a rule that is very important and one that you need to be aware of in trading to be successful:
THE PRICE RETURNS TO THE CENTER IN ABOUT 80% OF ALL CASES
If we know this, then we can stay in a trade with confidence.
Point 4
The price climbed even higher but missed the upper extreme.
This is the “Hagopian Rule” (named after the man who discovered it).
And the rule goes: If the price does not reach the next line (upper extreme, lower extreme, or center), then the price will continue moving in the opposite direction from where it originally came.
Phew...that’s a mouthful ;-)
But yes, we actually see that the price does exactly this.
From point 4, where the price missed the upper extreme, the price not only goes back to the center but continues and almost reaches the lower extreme!
Now if that isn’t cool, I don’t know what is!
And what do we have at point 5?
A "HAGOPIAN"!
What did we just learn?
The price should go higher than the center line.
Does it do that?
Oh yes!
But wait!
Not only does the Hagopian Rule apply. Remember?
"The price returns to the center line in about 80% of the cases."
HA!
Interesting or interesting?
So, that’s it.
That’s enough for now.
Now follow the price yourself and always consider which rule applies and whether it’s being followed.
How exactly do you trade all this, and what are the setups?
...one step at a time.
Don’t miss the next lesson and follow me here on TradingView.
Wishing you lots of success and fun!
EURCHF LONG LIVE TRADE AND EDUCATIONAL BREAK DOWN LONGCentral Bank Policies:
The Swiss National Bank (SNB) policy decisions significantly impact the CHF. Recent SNB rate cuts are a key factor influencing the EUR/CHF pair.
Conversely, the European Central Bank (ECB) policies regarding the Eurozone also have a large impact on the EUR side of the pairing.

The Hardest Part About Trading Isn't The Charts-Its Your MindWhen I first started trading, I thought the key to success was all about the strategy. If I could just figure out the right indicators or master technical analysis, I’d be unstoppable.
But the truth hit me hard. I wasn’t losing because I didn’t understand the charts—I was losing because I didn’t understand myself.
Here’s how I learned that the biggest battle in trading isn’t with the market—it’s with your own mind.
Lesson 1: Stop Obsessing Over Results
I used to get way too caught up in the outcome of every single trade. A win would make me feel on top of the world, but a loss? That would send me into a spiral. I’d overanalyze, doubt myself, and sometimes even swear I was done trading altogether.
One day, I realized I was focusing on the wrong thing. Instead of asking, “Did I win or lose?” I started asking, “Did I follow my plan?”
That simple shift changed everything for me. I started measuring success by how consistent I was, not by whether every trade was a winner. The funny thing? Once I started doing that, the wins came more naturally.
Lesson 2: Losses Aren’t Failures
I’ll never forget the trade that wiped out 30% of my account. It was gut-wrenching. I felt like I’d failed—not just as a trader, but as a person.
It took me a long time to understand that losses are part of trading. Even the best traders take hits. What separates the pros from the rest is how they handle those losses.
Now, instead of beating myself up, I treat losses as a chance to learn. Did I miss something in my analysis? Did I break my rules? Sometimes, the market just didn’t cooperate, and that’s okay.
Lesson 3: Don’t Let Emotions Run the Show
I can’t tell you how many times I’ve let emotions wreck me. Chasing losses, revenge trading, doubling down on bad positions—I’ve done it all. And every single time, it made things worse.
The biggest game-changer for me was journaling my trades. Not just the technical stuff, but how I felt during the trade.
-Was I calm or anxious?
-Was I trading because it was a good setup or because I felt like I had to?
It was eye-opening to see how much my emotions were driving my decisions. Now, if I feel frustrated or off, I don’t even touch the charts. I’d rather miss a trade than make a bad one.
My Biggest Takeaway I Learned
Trading isn’t just about the market—it’s about you. The strategies, the charts, the setups—they’re important, but they’re not enough. You need to master your mind if you want to master the market.
I’m not perfect, and I still have tough days. But every step I’ve taken to manage my emotions, stay consistent, and focus on the process has brought me closer to where I want to be.
If you’re struggling with the mental side of trading, I get it. I’ve been there. Send me a DM or check my profile—I’m happy to share what worked for me and help however I can. You don’t have to do this alone.
Kris/Mindbloome Trading
Trade What You See

Mindfulness: The Zen Path to Trading MasteryMindfulness is a practice that involves being fully present and engaged in the moment, aware of your thoughts and feelings without judgment. It originates from ancient Buddhist meditation practices but has been widely adopted across the world for its mental health benefits. In this post, we'll explore what mindfulness is, its origins, and how it can benefit traders. Plus, we'll share practical tips to help you get started, so keep reading till the end.
❓ What is mindfulness?Mindfulness is like a special tool that helps you focus on the present moment without wishing things were different. It’s about noticing the little things—how your breath feels as it moves in and out, the way your body feels as you sit or stand, or even the sounds around you. Practicing mindfulness is like watching a movie, noticing every detail without being distracted by thoughts about what’s next.
When you practice mindfulness, you train your brain to focus on the present. It’s similar to using a magnifying glass: you see details you might otherwise miss. Mindfulness works internally, helping you observe your thoughts, feelings, and sensations with clarity. This practice allows you to respond to situations with calmness rather than reacting impulsively. It’s like pressing a “pause” button, giving you time to choose your response.
In simple terms, mindfulness helps you live in the “now,” handle emotions more effectively, and be kinder to yourself. It’s like having a secret garden in your mind where you can retreat to find peace, no matter what’s happening around you.
❓ Where does it come from?Mindfulness originated over 2,500 years ago within Buddhist meditation practices and addresses a universal human need: the desire to be fully present and aware in life. First cultivated in the serene landscapes of ancient India, mindfulness has evolved beyond its religious roots, finding expression in various Eastern traditions like Taoism and Zen Buddhism. These cultures emphasized awareness, intention, and compassion, highlighting mindfulness's universal appeal.
In the late 20th century, mindfulness crossed into the Western world, thanks to pioneers like Jon Kabat-Zinn. His Mindfulness-Based Stress Reduction (MBSR) program at the University of Massachusetts Medical School demonstrated how mindfulness improves psychological well-being, reduces stress, and enhances quality of life—all without its spiritual trappings. Today, mindfulness is embraced in diverse fields for its profound benefits, proving to be a timeless practice that deepens our connection to the present moment.
❓ Why mindfulness for trading?Why is mindfulness important for trading? Think of trading as a room filled with buttons, each evoking different emotions—joy when you win, fear or frustration when you lose. Mindfulness acts as a guide in this room, helping you notice the buttons (your emotions) without pressing them all. It allows you to experience the highs and lows without becoming overwhelmed, keeping your mind steady regardless of market fluctuations.
Mindfulness helps traders stay calm and clear-headed. The trading world is full of excitement and anxiety, but mindfulness serves as a pair of glasses, bringing clarity to the chaos. It anchors you in the present, preventing you from getting lost in worries about the future or regrets about the past. This clarity helps you make better decisions, free from emotional bias. In essence, mindfulness becomes a secret weapon that keeps you focused and composed amid market turbulence.
❓ How does it help in trading?
Emotional Regulation: Trading is an emotionally charged activity, with stress, anxiety, and reactions to wins and losses. Mindfulness helps traders recognize their emotions without becoming overwhelmed, promoting a balanced approach to decision-making.
Improved Focus and Concentration: Mindfulness enhances your ability to concentrate. For traders, this means staying focused on market analysis, monitoring trades, and making decisions without distractions.
Reducing Impulsive Behavior: By increasing awareness of your thoughts and feelings, mindfulness helps you avoid impulsive decisions driven by emotions like fear, greed, or frustration, leading to more disciplined strategies.
Stress Management: Trading can be high-stress, especially in volatile markets. Mindfulness reduces stress levels, helping traders maintain clarity and avoid burnout.
Enhanced Decision-Making: Mindfulness fosters calm and clarity, allowing for objective evaluation. This reduces the likelihood of emotion-driven or biased decisions.
Learning from Mistakes: Mindfulness promotes a non-judgmental perspective, encouraging traders to view mistakes as learning opportunities rather than failures. This growth mindset is crucial for long-term success.
Incorporating Mindfulness into Your Trading RoutineHere’s how to integrate mindfulness into your daily trading routine:
💖 Daily Meditation: Start with just 5 minutes a day. Apps like Headspace or Calm can guide you.
😱 Setting Intentions: Each morning, remind yourself of your trading goals and commit to approaching the day mindfully.
😒 Mindful Breathing: Feeling overwhelmed? Pause and take ten deep breaths to reset your mental state.
🚶♂️ Mindful Pauses: Before placing a trade, take a moment to reflect and ensure the decision feels right.
📝 Reflective Journaling: At the end of the day, write about your emotional journey alongside your trades. You’ll discover patterns that can guide future decisions.
✅ TakeawayWho knew that the path to trading success could involve a bit of Zen? By embracing mindfulness, you’re not just becoming a better trader; you’re investing in your overall well-being. Here’s to trading mindfully and finding inner peace amidst the market’s chaos. Remember, in the trading world, the best investment is in yourself.
🗎 Join the Conversation!Now it’s your turn! Have you tried integrating mindfulness into your trading routine? Have you noticed any changes in your decision-making or emotional resilience? Perhaps you have mindfulness tips of your own to share. Drop your stories, insights, or even skepticism in the comments below. Let’s build a community of mindful traders, learning and growing together. We can’t wait to hear about your experiences!

Master the Market: Top Secrets to Prevent Losses in Any Trend!
Common Reasons Why Traders Lose Money Even in an Uptrend
Not Setting Stop-Loss:
Not Conducting Technical Analysis:
Going Against the Trends:
Following the Herd:
Being Impatient:
Not Doing Homework or Research:
Averaging on Losing Position:
'Buy low, sell high' is the motto. As simple as it sounds, why do most people lose money trading or investing?
There are four major mistakes that most beginners make:
Excessive Confidence
This stems from the belief that individuals are uniquely gifted. They think they can 'crack the code' in the stock market that 99.9% of people fail to, with the goal of making a living from trading and investing. However, given that more people lose money in the market, this wishful thinking is akin to walking into a casino feeling lucky. You might get lucky and win big a few times, but ultimately, the house always wins.
Distorted Judgments
While simplicity is key, most beginners approach trading and investing with overly simplistic methods, hardly qualifying as trading logic or investment reasoning. They might spot a few recurring patterns in the market, akin to discovering fire. However, they soon realize that these "patterns" were not based on solid reasoning or, worse, were not patterns at all.
Herding Behavior
This behavior is rooted in a gambling mindset. Beginners are lured by the prospect of a single trade or investment that will turn them into millionaires. Yet, they fail to understand that trading and investing are not like winning the lottery. It's about making consistent profits that compound over time. While people should look for assets with high liquidity and some volatility, the get-rich-quick mentality leads to investing in overextended or overbought stocks that eventually plummet.
Risk Aversion
Risk aversion is a psychological trait embedded in human DNA. Winning is enjoyable, but we can't tolerate losing. As a result, many beginners take small profits, fearing they might close their positions at a loss, leading to trading with a poor risk-reward ratio. Over time, this reluctance to take risks results in losses.
Depending on price action, traders go through seven psychological stages:
Anxiety
Interest
Confidence
Greed
Doubt
Concern
Regret
Lack of Discipline
An intraday trader must adhere to a well-defined plan. A comprehensive intraday trading plan includes profit targets, considerations, methods for setting stop losses, and optimal trading hours. Such a plan offers an overview of how trading should be executed. Keeping a daily record of trades with performance analysis helps identify and correct weaknesses in your strategy. Discipline is crucial in trading to minimize losses and preserve capital.
Not Setting Proper Trading Limits
Success in intraday trading hinges on risk management. You should predefine a stop loss and profit target before entering a trade. This is a part of trading discipline where many fail. For example, if you suffer a loss in the first hour, you should close your trading terminal for the day. Setting an overall capital loss limit also protects against further trading losses.
Compensating for a Rapid Loss
A common mistake among traders is attempting to average down a position or overtrade to recover losses. This often leads to greater losses. Instead of overtrading, accept the loss, analyze your strategy, and make improvements for the next trading session.
Heavy Dependency on Tips
With the abundance of intraday tips on digital media, it's tempting for traders to rely on these external sources. However, it's advisable to avoid this. The best way to learn intraday trading is by understanding how to read charts, recognize structures, and interpret results independently. Tools like the Beyond App by Nirmal Bang provide insightful market research, but practical experience is irreplaceable.
Not Keeping Track of Current Affairs
News, events, and global market performances influence stock movements. Intraday traders should monitor both Indian and global markets. Make trades after announcements rather than speculating based on news.
Intraday trading is a skill, not a gamble, requiring time to develop proficiency. Expecting rapid results is unrealistic. The reasons listed above are why many intraday traders lose money; discipline, strategy adherence, and regular strategy analysis are key to success.
We will discuss 3 classic trading strategies and stop placement rules:
Trend Line Strategy
Buying: Identify the previous low; place your stop loss strictly below that.
Selling: Identify the previous high; place your stop loss strictly above that.
Breakout Trading Strategy
Buying: Identify the previous low when buying a breakout of resistance; stop loss below that.
Selling: Identify the previous high when selling a breakout of support; stop loss above that.
Range Trading Strategy
Buying: Place stop loss strictly below the lowest point of support.
Selling: Place stop loss strictly above the highest point of resistance.
These stop placement techniques are simple but effective in avoiding stop hunts and market manipulations.
What Is a Stop-Loss Order?
A stop-loss order is placed with a broker to buy or sell a stock once it reaches a predetermined price, designed to limit an investor's loss. For instance, setting a stop-loss at 10% below your purchase price limits your loss to 10%. If you bought Microsoft (MSFT) at $20 per share, placing a stop-loss at $18 would trigger a sale at the market price if the stock falls below $18.
Stop-Limit Orders are similar but have a limit on the execution price, involving two prices: the stop price, which turns the order into a sell order, and the limit price, which specifies the minimum acceptable price for execution.
Advantages of the Stop-Loss Order
Cost-Effective: No cost until the stop price is hit.
Convenience: No need for daily market monitoring.
Emotional Insulation: Helps maintain discipline and prevent emotional trading decisions.
Strategy Enforcement: Ensures adherence to your investment strategy, though less useful for strict buy-and-hold investors.
Types of Stop-Loss Orders
Fixed Stop Loss: Triggered at a set price or time, ideal for giving trades room to develop.
Trailing Stop-Loss Order: Adjusts with price increases to protect gains while allowing for market downturns.
Stop-Loss Order vs. Market Order
Stop-Loss: Aimed at reducing risk by selling at a specific price.
Market Order: For buying or selling at the current market price to increase liquidity.
Stop-Loss Order and Limit Order
Limit Order: Executes trades at or better than a specified price to maximize profit or minimize losses.
If you appreciate our content, please support our page with a like, comment, and follow for more educational insights and trading setups.

Conquered 250 Pips, What's Next in the Wave? Swingers!Let's keep it simple, As Always!
As of today, GBP/USD has delivered a solid 250-pip move following our analysis shared on October 9th, 2024. Our forecasted move materialized as expected, with the pair continuing its upward momentum after a brief consolidation phase. For those who took the trade, congratulations on securing some solid profits!
Now, the question on everyone's mind is, what's next for GBP/USD? Let’s break down the structure and identify the potential move within the wave.
Keep an eye on price action around these levels for the next wave. A pullback to 1.2300 could offer an entry for the next rally. Stay cautious and wait for confirmation before jumping in.
Let's see how the market unfolds over the coming sessions.
-Zak
Happy Trading! 🔥

Example | Deep Understanding of Market StructureThis is an example of an article that I have made before, you can see it in the attachment below
I will continue to make examples like this for us to learn together,
practice make perfect,right??
don't forget to follow
thankyou

xauusd analysis for 9/07/2024Last week our analyis on xauusd was perfect , we have predicted that if it cannot break the 2319-2312 zone then it will be bullish up to 2385.
Targets hit
2337 ✅✅✅
2347✅✅✅
2362✅✅✅
2385✅✅✅
our analyis for today:
it will be a ranging market from 2353 to 2371 , so buy the dip and sell the high.
▶️ if 2370 is broken then the market will fly upwards to 2385 2393 2404 2421 in extension
▶️ if 2353 support is broken then the market will fall towards
2342 2333 2321 2311 2306
.
we will make a detail analysis on fundamental technical and geopolitical scenarios.
LIKE US BOOST US FOLLOW US SHARE US

What Traders and Rock Climbers Have in Common!This post is inspired by @TradingView's rebranding in 2021 and the recent Leap competition.
At first glance, trading and rock climbing might seem worlds apart. One involves analyzing market trends, while the other requires physical strength and agility.
However, both pursuits share surprising similarities, highlighting unique skills and mindsets.
Here’s a look at what traders and rock climbers have in common.
⚙️ Risk Management: Both traders and rock climbers excel at managing risk. Traders use strategies like stop-loss orders and portfolio diversification to protect their capital.
Rock climbers assess risks, use safety equipment, and plan routes to avoid danger. Effective risk management is crucial in both fields to prevent catastrophic outcomes.
💡Mental Toughness: Traders face market fluctuations and must make quick decisions under pressure.
Rock climbers need to stay focused and composed while navigating challenging routes. Both activities demand mental resilience to overcome fear, maintain focus, and make calculated decisions.
📊 Strategic Planning: Success in trading and rock climbing involves strategic planning.
Traders develop strategies based on market analysis and economic indicators, while rock climbers meticulously plan their ascents, studying routes and assessing conditions. Strategic planning helps achieve goals efficiently in both areas.
⚖️ Adaptability: Adaptability is key for both traders and rock climbers. Market conditions can change rapidly, requiring traders to adjust their strategies.
Rock climbers face changing conditions like weather and rock quality, adapting their techniques to overcome obstacles and reach their objectives.
📜 Continuous Learning: Both traders and rock climbers are committed to continuous learning.
Traders stay updated on market trends and new tools, while rock climbers seek to improve their skills and stay informed about gear and safety practices. The pursuit of knowledge drives success in both fields.
🧘♂️ Focus on Execution: Execution is crucial in trading and rock climbing. Traders need precision, timing, and discipline to execute trades effectively.
Rock climbers must execute their moves with precision and confidence to progress safely. The ability to execute under pressure is essential for success in both activities.
🔄Passion and Commitment: Passion and commitment are integral to both trading and rock climbing.
Traders have a deep interest in financial markets, while rock climbers are driven by their love for the sport and adventure. This passion fuels their dedication, driving them to invest time and effort into their pursuits.
🧗♀️ Conclusion: Despite their apparent differences, trading and rock climbing share many commonalities.
Both require effective risk management, mental toughness, strategic planning, adaptability, continuous learning, focus on execution, and a deep-seated passion.
Recognizing these parallels can provide valuable insights and inspiration for those engaged in either pursuit, highlighting the universal qualities that drive success in diverse fields.
📚 Always follow your trading plan regarding entry, risk management, and trade management.
Good luck!
All Strategies Are Good; If Managed Properly!
~Richard Nasr

The Famous Monkey Story in Every Markets!The Famous Monkey Story in Every Market!
Once upon a time, a rich man from the city arrived in a village. He announced to the villagers that he would buy monkeys for $100 each.
The villagers were thrilled, as there were hundreds of monkeys in a nearby forest. They caught the monkeys and brought them to the rich man, who paid $100 for every monkey they gave him. The villagers began making a living by capturing monkeys from the forest and selling them to the rich man.
Soon, the forest began to run out of monkeys that were easy to catch. Sensing this, the rich man offered $200 for each monkey. The villagers were ecstatic. They went back to the forest, set up traps, caught more monkeys, and brought them to the rich man.
A few days later, the rich man announced he would pay $300 per monkey. The villagers started climbing trees and risking their lives to catch monkeys and bring them to the rich man, who bought them all. Eventually, there were no monkeys left in the forest.
One day, the rich man announced he would like to buy more monkeys, this time for $800 each. The villagers couldn’t believe their luck. They desperately tried to catch more monkeys.
Meanwhile, the rich man said he had to return to the city for some business. Until he returned, his manager would handle transactions on his behalf.
Once the rich man left, the villagers were unhappy. They had been making quick and easy money from selling monkeys, but now the forest had no monkeys left.
This is when the manager of the rich man stepped in. He made an offer the villagers could not refuse. Pointing to all the caged monkeys, he told the villagers he would sell them for $400 each. They could sell them back to the rich man for $800 each when he returned.
The villagers were over the moon. Buy for $400 and sell for $800 in a few days—they had found the easiest way to double their money. They collected all their savings and even borrowed money. There were long queues, and within a few hours, almost all the monkeys were sold out.
Unfortunately, their happiness did not last long. The manager went missing the next day, and the rich man never returned. Many villagers kept the monkeys, hoping the rich man would come back. But soon, they lost hope and had to release the monkeys back into the forest, as feeding and caring for the noisy monkeys became extremely difficult.
This is exactly what happens when you buy low-quality companies in the stock market. There will be a low-priced stock that no one is interested in buying. A few rich men will suddenly start buying it. The stock price will rise because there are suddenly many buyers and very few sellers—a classic case of huge demand and no supply, like the monkeys in the forest.
The stock gets plenty of coverage on business channels and newspapers. These rich men will also use tricks like sending out bulk SMS messages, asking people to buy the shares for huge returns, and giving free tips. New and inexperienced investors, hoping to double or triple their investment, get lured in. Finally, the big players who bought the stock early when no one wanted it sell it back to inexperienced investors at high prices.
Don’t be greedy—there is no quick money in the stock market or in life. It takes time and effort to become wealthy, and there are no shortcuts.
Hit that like button if you like the story. Follow my profile for more content.

📈Mastering Stock Selection:A Journey to Long-Term Wealth💰Part1Interested in selecting high-quality stocks and growing your wealth through long-term investing? Today, I'll guide you through effective stock selection methods, including the top-bottom and bottom-top approaches. Remember, as Warren Buffett famously said, "The stock market is designed to transfer money from the active to the patient." 💼📈
Let's start with the top-bottom approach. First, you choose an economy, such as Indian, US, or UK. Next, select a sector within that economy, like Financial Services, IT, or Pharma. From there, narrow down to an industry within the sector, such as AI, Clean-technology, or Hardware. Finally, choose a company within the industry. Don't worry if it seems complex – I'll provide examples and guidance throughout. 💡🔍
Conversely, the bottom-top approach flips this order. We start by selecting a company, then move up to its industry, sector, and finally, the economy. 💼🔄
Let's put theory into practice with the top-bottom approach: (a random example)
1. Choose India as the economy.
2.Select the IT sector for its promising future.
3. Opt for AI as the industry due to its potential.
4. Select Infosys as a company.
Now, it's your turn! Share examples of top-bottom or bottom-top approaches in the comments for practice. 💬💡
In the upcoming discussions, we'll delve into the fundamentals of sector, industry, and company analysis. Don't worry—I'll explain everything from market cap and cash flow to return on equity (ROE). 📊✨
Target of likes (boosts): 25+ (if we achieve our target than I will make Part 2) 🎯🚀
Follow for more such ideas & learning content! 🔍

What do you see? #GBPAUDTake a look at the #GBPAUD chart. What do you see? As a trader, it's crucial to identify patterns and trends. My analysis shows potential for a bullish breakout after landing near the support level of 1.91750 . With potential targets at around 1.96500 . But what's your perspective? Let's talk.

Learn to Take Losses. Trading Psychology Basics
Hey traders,
In this post, we will discuss a typical psychological mistake that a lot of traders frequently make, facing a losing streak.
🤑 Analyzing different charts, we may spot a decent trading setup. Being 100% sure in our predictions, we open a trading position.
After some time, we are stopped out.
Instead of admitting that we were wrong, we are looking for a reason why it is not our fault: market manipulation, stop hunting, news.
Instead of reevaluation of our analysis, we start forcing our previous predictions.
🧠 We open a position again, being sure that it is a perfect moment for us to recover the loss.
And we are wrong one more time. What the hell is going on? Who to blame? Of course, that is not us.
These ugly hedge fund managers again sunk our trade.
😢 But we stay strong, we have a big trading account, so we decide to show this schmo who is a real pro here.
Consistency! That is the secret of success in trading.
So we open the third position again.
And... we screwed.
🤬 Eureka! The market reversed! It's time to open the position in the opposite direction. The trend has changed, and it's time to get on board and recover this losing streak.
We open a trade, however, it's too late already: while we were forcing our previous predictions a new impulse has already gone exhausted.
We s*ck...
That is a typical situation every struggling trader faced.
The psychological barrier to take the loss and admit the mistake makes many people leave this game.
The only way to proceed is to learn to take losses. Take losses and reevaluate your analysis.
"It's ok to be wrong. It's unforgivable to stay wrong!"

Why You Should Never Hold on to Your Positions Beyond a CertainGood day, traders.
I would like to take this opportunity to advise both new and experienced traders that holding onto your position indefinitely is not recommended. Based on percentage calculations, the return required to recover to break even increases at a considerably faster pace as losses grow in size due to compound interest. After a loss of 10%, a gain of 11% is needed to make up for it. When the loss is 20%, it takes a 25% gain to return to break even. To recover from a 50% loss, a 100% gain is required, and to reach the initial investment value after an 80% loss, a 400% gain is necessary.
Investors who experience a bear market must understand that it will take some time to recover, but compounding returns will aid in the process. Consider a bear market where the value drops by 30% and the stock portfolio is only worth 70% of what it was. Suppose the portfolio increases by 10% to reach 77%. The subsequent 10% gains bring it to 84.7%. After two further years of 10% gains, the portfolio reaches its pre-drop value of 102.5%. Consequently, a 30% decline requires a 42% recovery, but a four-year compounding rate of 10% returns the account to profitability.
I will be doing a second part of this post on the idea of "DOLLAR COST AVERAGING" (DCA).
The math behind stock market losses clearly demonstrates the need for investors to take precautions against significant losses, as depicted in the graphic above. Stop-loss orders to sell stocks or cryptocurrencies that are mental or limit-based exist for a reason. If the market is headed towards a bear market, it will start to pay off once a particular loss threshold is reached. Investors occasionally struggle to sell stocks they enjoy at a loss, but if they can repurchase the stock or cryptocurrency at a lesser cost, they will like it.
Never stop learning! I would also appreciate hearing your thoughts and opinions on the topic in the comment section.
Thank you.
